
 Login Sign Up


| |||||
 |  | ||||

| 12Stocks.com Market Intelligence |
Best Consumer Services Stocks
| In a hurry? Services & Goods Stocks: Performance Trends Table, Stock Charts
Sort Consumer Services: Daily, Weekly, Year-to-Date, Market Cap & Trends. Filter Services & Goods stocks list by size: All Large Mid-Range Small |
| 12Stocks.com Consumer Services Stocks Performances & Trends Daily | |||||||||
|
|  The overall Smart Investing & Trading Score is 68 (0-bearish to 100-bullish) which puts Consumer Services sector in short term neutral to bullish trend. The Smart Investing & Trading Score from previous trading session is 51 and hence an improvement of trend.
| ||||||||
Here are the Smart Investing & Trading Scores of the most requested Consumer Services stocks at 12Stocks.com (click stock name for detailed review):
|


| Consider signing up for our daily 12Stocks.com "Best Stocks Newsletter". You will never ever miss a big stock move again! |
| 12Stocks.com: Investing in Consumer Services sector with Stocks | |
|
The following table helps investors and traders sort through current performance and trends (as measured by Smart Investing & Trading Score) of various
stocks in the Consumer Services sector. Quick View: Move mouse or cursor over stock symbol (ticker) to view short-term Technical chart and over stock name to view long term chart. Click on  to add stock symbol to your watchlist and to add stock symbol to your watchlist and  to view watchlist. Click on any ticker or stock name for detailed market intelligence report for that stock. to view watchlist. Click on any ticker or stock name for detailed market intelligence report for that stock. |
12Stocks.com Performance of Stocks in Consumer Services Sector
| Ticker | Stock Name | Watchlist | Category | Recent Price | Smart Investing & Trading Score | Change % | Weekly Change% |
| BBY | Best Buy |   | Retail | 75.05 | 51 | -0.25% | -1.44% |
| GPC | Genuine Parts | | Auto Parts | 159.93 | 75 | -0.71% | -1.51% |
| ACEL | Accel Entertainment | | Gaming | 11.19 | 76 | -0.97% | -1.58% |
| BOWL | Bowlero | | Leisure | 11.71 | 58 | 1.47% | -1.60% |
| PSMT | PriceSmart | | Retail | 81.52 | 60 | 1.68% | -1.61% |
| LSXMB | Liberty SiriusXM | | Broadcasting | 24.37 | 25 | -2.99% | -1.65% |
| MYGN | Myriad Genetics | | Research | 18.18 | 17 | 1.11% | -1.73% |
| VALU | Value Line | | Publishing | 36.72 | 53 | 1.72% | -1.74% |
| ULTA | Ulta Beauty | | Retail | 406.19 | 10 | -0.45% | -1.77% |
| ENV | Envestnet | | Services | 62.15 | 70 | -0.34% | -1.86% |
| DG | Dollar General | | Retail | 142.07 | 61 | -0.41% | -1.90% |
| KR | Kroger Co | | Grocery | 55.49 | 61 | -0.75% | -1.91% |
| CHWY | Chewy | | Retail | 15.84 | 27 | 2.99% | -1.92% |
| QS | QuantumScape | | Auto Parts | 5.34 | 17 | 7.65% | -1.93% |
| SBGI | Slair Broadcast | | Broadcasting | 12.11 | 67 | -0.66% | -1.94% |
| SIRI | Sirius XM | | Broadcasting | 3.03 | 15 | 0.33% | -1.94% |
| TGNA | TEGNA | | Broadcasting | 13.54 | 45 | -0.81% | -2.03% |
| EDU | New Oriental | | Education | 83.26 | 43 | 4.55% | -2.04% |
| CCRN | Cross Country | | Staffing | 17.14 | 45 | -1.49% | -2.06% |
| TGT | Target | | Retail | 164.74 | 53 | 0.18% | -2.12% |
| MTN | Vail Resorts | | Casinos | 198.33 | 17 | -0.35% | -2.27% |
| MHH | Mastech Digital | | Staffing | 8.66 | 30 | 0.99% | -2.31% |
| QUAD | Quad/Graphics | | Services | 4.52 | 18 | -1.53% | -2.38% |
| WISH | ContextLogic | | Internet Retail | 5.70 | 71 | -0.18% | -2.40% |
| TITN | Titan Machinery | | Equipment | 22.68 | 17 | 0.31% | -2.41% |
| For chart view version of above stock list: Chart View ➞ 0 - 25 , 25 - 50 , 50 - 75 , 75 - 100 , 100 - 125 , 125 - 150 , 150 - 175 , 175 - 200 , 200 - 225 , 225 - 250 , 250 - 275 , 275 - 300 , 300 - 325 , 325 - 350 , 350 - 375 , 375 - 400 , 400 - 425 , 425 - 450 , 450 - 475 | ||
 | Click To Change The Sort Order: By Market Cap or Company Size Performance: Year-to-date, Week and Day |  |
|
Get the most comprehensive stock market coverage daily at 12Stocks.com ➞ Best Stocks Today ➞ Best Stocks Weekly ➞ Best Stocks Year-to-Date ➞ Best Stocks Trends ➞  Best Stocks Today 12Stocks.com Best Nasdaq Stocks ➞ Best S&P 500 Stocks ➞ Best Tech Stocks ➞ Best Biotech Stocks ➞ |
| Detailed Overview of Consumer Services Stocks |
| Consumer Services Technical Overview, Leaders & Laggards, Top Consumer Services ETF Funds & Detailed Consumer Services Stocks List, Charts, Trends & More |
| Consumer Services Sector: Technical Analysis, Trends & YTD Performance | |
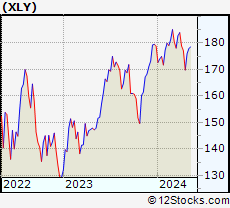
| Consumer Services sector is composed of stocks
from retail, entertainment, media/publishing, consumer goods
and services subsectors. Consumer Services sector, as represented by XLY, an exchange-traded fund [ETF] that holds basket of Consumer Services stocks (e.g, Walmart, Alibaba) is down by -1.62% and is currently underperforming the overall market by -7.76% year-to-date. Below is a quick view of Technical charts and trends: |
|
 XLY Weekly Chart |
|
| Long Term Trend: Good | |
| Medium Term Trend: Not Good | |
 XLY Daily Chart |
|
| Short Term Trend: Very Good | |
| Overall Trend Score: 68 | |
| YTD Performance: -1.62% | |
| **Trend Scores & Views Are Only For Educational Purposes And Not For Investing | |
| 12Stocks.com: Top Performing Consumer Services Sector Stocks | ||||||||||||||||||||||||||||||||||||||||||||||||
 The top performing Consumer Services sector stocks year to date are
Now, more recently, over last week, the top performing Consumer Services sector stocks on the move are


|
||||||||||||||||||||||||||||||||||||||||||||||||
| 12Stocks.com: Investing in Consumer Services Sector using Exchange Traded Funds | |
|
The following table shows list of key exchange traded funds (ETF) that
help investors track Consumer Services Index. For detailed view, check out our ETF Funds section of our website. Quick View: Move mouse or cursor over ETF symbol (ticker) to view short-term Technical chart and over ETF name to view long term chart. Click on ticker or stock name for detailed view. Click on to add stock symbol to your watchlist and to view watchlist. |
12Stocks.com List of ETFs that track Consumer Services Index
| Ticker | ETF Name | Watchlist | Recent Price | Smart Investing & Trading Score | Change % | Week % | Year-to-date % |
| XLY | Consumer Discret Sel | | 175.91 | 68 | 0.90 | 3.62 | -1.62% |
| RTH | Retail | | 201.08 | 56 | 1.22 | 1.23 | 6.83% |
| IYC | Consumer Services | | 78.36 | 43 | 0.63 | 2.74 | 3.42% |
| XRT | Retail | | 73.22 | 63 | 1.40 | 2.88 | 1.24% |
| IYK | Consumer Goods | | 66.82 | 68 | -0.24 | 1.53 | 4.56% |
| UCC | Consumer Services | | 33.88 | 80 | 1.89 | 7.3 | -5.65% |
| RETL | Retail Bull 3X | | 8.83 | 55 | 4.25 | 8.74 | -3.18% |
| RXI | Globl Consumer Discretionary | | 161.18 | 43 | 1.26 | 2.56 | 1.33% |
| SCC | Short Consumer Services | | 15.78 | 35 | -1.74 | -6.92 | 2.98% |
| UGE | Consumer Goods | | 17.17 | 90 | 0.29 | 3.26 | 9.08% |
| 12Stocks.com: Charts, Trends, Fundamental Data and Performances of Consumer Services Stocks | |
|
We now take in-depth look at all Consumer Services stocks including charts, multi-period performances and overall trends (as measured by Smart Investing & Trading Score). One can sort Consumer Services stocks (click link to choose) by Daily, Weekly and by Year-to-Date performances. Also, one can sort by size of the company or by market capitalization. |
| Select Your Default Chart Type: | |||||
| |||||
| Click on stock symbol or name for detailed view. Click on to add stock symbol to your watchlist and to view watchlist. Quick View: Move mouse or cursor over "Daily" to quickly view daily Technical stock chart and over "Weekly" to view weekly Technical stock chart. | |||||

 | BBY Best Buy Co., Inc. |
| Sector: Services & Goods | |
| SubSector: Electronics Stores | |
| MarketCap: 15771.3 Millions | |
| Recent Price: 75.05 Smart Investing & Trading Score: 51 | |
| Day Percent Change: -0.25% Day Change: -0.19 | |
| Week Change: -1.44% Year-to-date Change: -4.1% | |
| BBY Links: Profile News Message Board | |
| Charts:- Daily , Weekly | |
| Add BBY to Watchlist: View: Get Complete BBY Trend Analysis ➞ | |
 | GPC Genuine Parts Company |
| Sector: Services & Goods | |
| SubSector: Auto Parts Stores | |
| MarketCap: 8605.9 Millions | |
| Recent Price: 159.93 Smart Investing & Trading Score: 75 | |
| Day Percent Change: -0.71% Day Change: -1.14 | |
| Week Change: -1.51% Year-to-date Change: 15.5% | |
| GPC Links: Profile News Message Board | |
| Charts:- Daily , Weekly | |
| Add GPC to Watchlist: View: Get Complete GPC Trend Analysis ➞ | |
 | ACEL Accel Entertainment, Inc. |
| Sector: Services & Goods | |
| SubSector: Gaming Activities | |
| MarketCap: 486.589 Millions | |
| Recent Price: 11.19 Smart Investing & Trading Score: 76 | |
| Day Percent Change: -0.97% Day Change: -0.11 | |
| Week Change: -1.58% Year-to-date Change: 9.0% | |
| ACEL Links: Profile News Message Board | |
| Charts:- Daily , Weekly | |
| Add ACEL to Watchlist: View: Get Complete ACEL Trend Analysis ➞ | |
 | BOWL Bowlero Corp. |
| Sector: Services & Goods | |
| SubSector: Leisure | |
| MarketCap: 2000 Millions | |
| Recent Price: 11.71 Smart Investing & Trading Score: 58 | |
| Day Percent Change: 1.47% Day Change: 0.17 | |
| Week Change: -1.6% Year-to-date Change: -17.1% | |
| BOWL Links: Profile News Message Board | |
| Charts:- Daily , Weekly | |
| Add BOWL to Watchlist: View: Get Complete BOWL Trend Analysis ➞ | |
 | PSMT PriceSmart, Inc. |
| Sector: Services & Goods | |
| SubSector: Discount, Variety Stores | |
| MarketCap: 1655.72 Millions | |
| Recent Price: 81.52 Smart Investing & Trading Score: 60 | |
| Day Percent Change: 1.68% Day Change: 1.35 | |
| Week Change: -1.61% Year-to-date Change: 7.6% | |
| PSMT Links: Profile News Message Board | |
| Charts:- Daily , Weekly | |
| Add PSMT to Watchlist: View: Get Complete PSMT Trend Analysis ➞ | |
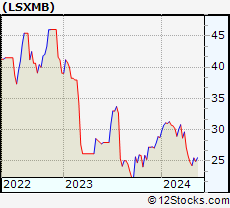 | LSXMB The Liberty SiriusXM Group |
| Sector: Services & Goods | |
| SubSector: Broadcasting - Radio | |
| MarketCap: 252.295 Millions | |
| Recent Price: 24.37 Smart Investing & Trading Score: 25 | |
| Day Percent Change: -2.99% Day Change: -0.75 | |
| Week Change: -1.65% Year-to-date Change: -15.3% | |
| LSXMB Links: Profile News Message Board | |
| Charts:- Daily , Weekly | |
| Add LSXMB to Watchlist: View: Get Complete LSXMB Trend Analysis ➞ | |
 | MYGN Myriad Genetics, Inc. |
| Sector: Services & Goods | |
| SubSector: Research Services | |
| MarketCap: 1051.94 Millions | |
| Recent Price: 18.18 Smart Investing & Trading Score: 17 | |
| Day Percent Change: 1.11% Day Change: 0.20 | |
| Week Change: -1.73% Year-to-date Change: -5.0% | |
| MYGN Links: Profile News Message Board | |
| Charts:- Daily , Weekly | |
| Add MYGN to Watchlist: View: Get Complete MYGN Trend Analysis ➞ | |
 | VALU Value Line, Inc. |
| Sector: Services & Goods | |
| SubSector: Publishing - Periodicals | |
| MarketCap: 254.3 Millions | |
| Recent Price: 36.72 Smart Investing & Trading Score: 53 | |
| Day Percent Change: 1.72% Day Change: 0.62 | |
| Week Change: -1.74% Year-to-date Change: -24.7% | |
| VALU Links: Profile News Message Board | |
| Charts:- Daily , Weekly | |
| Add VALU to Watchlist: View: Get Complete VALU Trend Analysis ➞ | |
 | ULTA Ulta Beauty, Inc. |
| Sector: Services & Goods | |
| SubSector: Specialty Retail, Other | |
| MarketCap: 9429.94 Millions | |
| Recent Price: 406.19 Smart Investing & Trading Score: 10 | |
| Day Percent Change: -0.45% Day Change: -1.82 | |
| Week Change: -1.77% Year-to-date Change: -17.1% | |
| ULTA Links: Profile News Message Board | |
| Charts:- Daily , Weekly | |
| Add ULTA to Watchlist: View: Get Complete ULTA Trend Analysis ➞ | |
 | ENV Envestnet, Inc. |
| Sector: Services & Goods | |
| SubSector: Business Services | |
| MarketCap: 3114.02 Millions | |
| Recent Price: 62.15 Smart Investing & Trading Score: 70 | |
| Day Percent Change: -0.34% Day Change: -0.21 | |
| Week Change: -1.86% Year-to-date Change: 25.5% | |
| ENV Links: Profile News Message Board | |
| Charts:- Daily , Weekly | |
| Add ENV to Watchlist: View: Get Complete ENV Trend Analysis ➞ | |
 | DG Dollar General Corporation |
| Sector: Services & Goods | |
| SubSector: Discount, Variety Stores | |
| MarketCap: 39611.9 Millions | |
| Recent Price: 142.07 Smart Investing & Trading Score: 61 | |
| Day Percent Change: -0.41% Day Change: -0.58 | |
| Week Change: -1.9% Year-to-date Change: 4.5% | |
| DG Links: Profile News Message Board | |
| Charts:- Daily , Weekly | |
| Add DG to Watchlist: View: Get Complete DG Trend Analysis ➞ | |
 | KR The Kroger Co. |
| Sector: Services & Goods | |
| SubSector: Grocery Stores | |
| MarketCap: 26718.5 Millions | |
| Recent Price: 55.49 Smart Investing & Trading Score: 61 | |
| Day Percent Change: -0.75% Day Change: -0.42 | |
| Week Change: -1.91% Year-to-date Change: 21.4% | |
| KR Links: Profile News Message Board | |
| Charts:- Daily , Weekly | |
| Add KR to Watchlist: View: Get Complete KR Trend Analysis ➞ | |
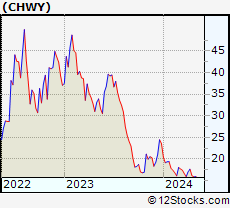 | CHWY Chewy, Inc. |
| Sector: Services & Goods | |
| SubSector: Specialty Retail, Other | |
| MarketCap: 14226.4 Millions | |
| Recent Price: 15.84 Smart Investing & Trading Score: 27 | |
| Day Percent Change: 2.99% Day Change: 0.46 | |
| Week Change: -1.92% Year-to-date Change: -33.0% | |
| CHWY Links: Profile News Message Board | |
| Charts:- Daily , Weekly | |
| Add CHWY to Watchlist: View: Get Complete CHWY Trend Analysis ➞ | |
 | QS QuantumScape Corporation |
| Sector: Services & Goods | |
| SubSector: Auto Parts | |
| MarketCap: 13137 Millions | |
| Recent Price: 5.34 Smart Investing & Trading Score: 17 | |
| Day Percent Change: 7.65% Day Change: 0.38 | |
| Week Change: -1.93% Year-to-date Change: -23.1% | |
| QS Links: Profile News Message Board | |
| Charts:- Daily , Weekly | |
| Add QS to Watchlist: View: Get Complete QS Trend Analysis ➞ | |
 | SBGI Sinclair Broadcast Group, Inc. |
| Sector: Services & Goods | |
| SubSector: Broadcasting - TV | |
| MarketCap: 1461.73 Millions | |
| Recent Price: 12.11 Smart Investing & Trading Score: 67 | |
| Day Percent Change: -0.66% Day Change: -0.08 | |
| Week Change: -1.94% Year-to-date Change: -7.1% | |
| SBGI Links: Profile News Message Board | |
| Charts:- Daily , Weekly | |
| Add SBGI to Watchlist: View: Get Complete SBGI Trend Analysis ➞ | |
 | SIRI Sirius XM Holdings Inc. |
| Sector: Services & Goods | |
| SubSector: Broadcasting - Radio | |
| MarketCap: 21325.5 Millions | |
| Recent Price: 3.03 Smart Investing & Trading Score: 15 | |
| Day Percent Change: 0.33% Day Change: 0.01 | |
| Week Change: -1.94% Year-to-date Change: -44.6% | |
| SIRI Links: Profile News Message Board | |
| Charts:- Daily , Weekly | |
| Add SIRI to Watchlist: View: Get Complete SIRI Trend Analysis ➞ | |
 | TGNA TEGNA Inc. |
| Sector: Services & Goods | |
| SubSector: Broadcasting - TV | |
| MarketCap: 2791.83 Millions | |
| Recent Price: 13.54 Smart Investing & Trading Score: 45 | |
| Day Percent Change: -0.81% Day Change: -0.11 | |
| Week Change: -2.03% Year-to-date Change: -11.5% | |
| TGNA Links: Profile News Message Board | |
| Charts:- Daily , Weekly | |
| Add TGNA to Watchlist: View: Get Complete TGNA Trend Analysis ➞ | |
 | EDU New Oriental Education & Technology Group Inc. |
| Sector: Services & Goods | |
| SubSector: Education & Training Services | |
| MarketCap: 18673.7 Millions | |
| Recent Price: 83.26 Smart Investing & Trading Score: 43 | |
| Day Percent Change: 4.55% Day Change: 3.62 | |
| Week Change: -2.04% Year-to-date Change: 13.6% | |
| EDU Links: Profile News Message Board | |
| Charts:- Daily , Weekly | |
| Add EDU to Watchlist: View: Get Complete EDU Trend Analysis ➞ | |
 | CCRN Cross Country Healthcare, Inc. |
| Sector: Services & Goods | |
| SubSector: Staffing & Outsourcing Services | |
| MarketCap: 348.328 Millions | |
| Recent Price: 17.14 Smart Investing & Trading Score: 45 | |
| Day Percent Change: -1.49% Day Change: -0.26 | |
| Week Change: -2.06% Year-to-date Change: -24.3% | |
| CCRN Links: Profile News Message Board | |
| Charts:- Daily , Weekly | |
| Add CCRN to Watchlist: View: Get Complete CCRN Trend Analysis ➞ | |
 | TGT Target Corporation |
| Sector: Services & Goods | |
| SubSector: Discount, Variety Stores | |
| MarketCap: 55980.6 Millions | |
| Recent Price: 164.74 Smart Investing & Trading Score: 53 | |
| Day Percent Change: 0.18% Day Change: 0.30 | |
| Week Change: -2.12% Year-to-date Change: 15.7% | |
| TGT Links: Profile News Message Board | |
| Charts:- Daily , Weekly | |
| Add TGT to Watchlist: View: Get Complete TGT Trend Analysis ➞ | |
 | MTN Vail Resorts, Inc. |
| Sector: Services & Goods | |
| SubSector: Resorts & Casinos | |
| MarketCap: 6259.64 Millions | |
| Recent Price: 198.33 Smart Investing & Trading Score: 17 | |
| Day Percent Change: -0.35% Day Change: -0.69 | |
| Week Change: -2.27% Year-to-date Change: -7.1% | |
| MTN Links: Profile News Message Board | |
| Charts:- Daily , Weekly | |
| Add MTN to Watchlist: View: Get Complete MTN Trend Analysis ➞ | |
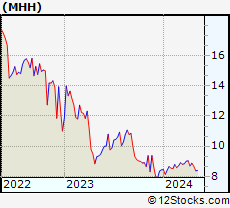 | MHH Mastech Digital, Inc. |
| Sector: Services & Goods | |
| SubSector: Staffing & Outsourcing Services | |
| MarketCap: 109.228 Millions | |
| Recent Price: 8.66 Smart Investing & Trading Score: 30 | |
| Day Percent Change: 0.99% Day Change: 0.08 | |
| Week Change: -2.31% Year-to-date Change: 2.8% | |
| MHH Links: Profile News Message Board | |
| Charts:- Daily , Weekly | |
| Add MHH to Watchlist: View: Get Complete MHH Trend Analysis ➞ | |
 | QUAD Quad/Graphics, Inc. |
| Sector: Services & Goods | |
| SubSector: Business Services | |
| MarketCap: 205.182 Millions | |
| Recent Price: 4.52 Smart Investing & Trading Score: 18 | |
| Day Percent Change: -1.53% Day Change: -0.07 | |
| Week Change: -2.38% Year-to-date Change: -16.6% | |
| QUAD Links: Profile News Message Board | |
| Charts:- Daily , Weekly | |
| Add QUAD to Watchlist: View: Get Complete QUAD Trend Analysis ➞ | |
 | WISH ContextLogic Inc. |
| Sector: Services & Goods | |
| SubSector: Internet Retail | |
| MarketCap: 165 Millions | |
| Recent Price: 5.70 Smart Investing & Trading Score: 71 | |
| Day Percent Change: -0.18% Day Change: -0.01 | |
| Week Change: -2.4% Year-to-date Change: -4.1% | |
| WISH Links: Profile News Message Board | |
| Charts:- Daily , Weekly | |
| Add WISH to Watchlist: View: Get Complete WISH Trend Analysis ➞ | |
 | TITN Titan Machinery Inc. |
| Sector: Services & Goods | |
| SubSector: Industrial Equipment Wholesale | |
| MarketCap: 208.958 Millions | |
| Recent Price: 22.68 Smart Investing & Trading Score: 17 | |
| Day Percent Change: 0.31% Day Change: 0.07 | |
| Week Change: -2.41% Year-to-date Change: -21.5% | |
| TITN Links: Profile News Message Board | |
| Charts:- Daily , Weekly | |
| Add TITN to Watchlist: View: Get Complete TITN Trend Analysis ➞ | |
| For tabular summary view of above stock list: Summary View ➞ 0 - 25 , 25 - 50 , 50 - 75 , 75 - 100 , 100 - 125 , 125 - 150 , 150 - 175 , 175 - 200 , 200 - 225 , 225 - 250 , 250 - 275 , 275 - 300 , 300 - 325 , 325 - 350 , 350 - 375 , 375 - 400 , 400 - 425 , 425 - 450 , 450 - 475 | ||
| Click To Change The Sort Order: By Market Cap or Company Size Performance: Year-to-date, Week and Day | |
| Select Chart Type: | ||
|
Best Stocks Today 12Stocks.com |
© 2024 12Stocks.com Terms & Conditions Privacy Contact Us
All Information Provided Only For Education And Not To Be Used For Investing or Trading. See Terms & Conditions


One More Thing ... Get Best Stocks Delivered Daily!
Never Ever Miss A Move With Our Top Ten Stocks Lists
Find Best Stocks In Any Market - Bull or Bear Market
Take A Peek At Our Top Ten Stocks Lists: Daily, Weekly, Year-to-Date & Top Trends
Find Best Stocks In Any Market - Bull or Bear Market
Take A Peek At Our Top Ten Stocks Lists: Daily, Weekly, Year-to-Date & Top Trends
Consumer Services Stocks With Best Up Trends [0-bearish to 100-bullish]: CAVA [100], Yatsen Holding[100], MINISO [100], Reservoir Media[100], AutoNation [100], Pactiv Evergreen[100], Gaia [100], Tractor Supply[100], Chipotle Mexican[100], Dada Nexus[100], Cheesecake Factory[100]
Best Consumer Services Stocks Year-to-Date:
U Power[2779.46%], Vroom [1804.53%], Yatsen Holding[558.83%], Fluent [337.31%], Codere Online[130.82%], Sweetgreen [116.99%], Research[106.23%], RealReal [78.11%], Carvana Co[59.26%], CAVA [59.06%], PaySign [57.5%] Best Consumer Services Stocks This Week:
Chicken Soup[214.9%], Yatsen Holding[33.33%], Sonic Automotive[28.14%], ATRenew [25.32%], Strategic Education[23.32%], Hibbett Sports[21.05%], Exponent [20.17%], Baozun [19.4%], Altisource Portfolio[19.39%], Golden Heaven[19.11%], Qurate Retail[18.83%] Best Consumer Services Stocks Daily:
ATRenew [22.98%], Exponent [19.40%], XPeng [12.38%], CAVA [10.50%], Sonic Automotive[9.93%], Fluent [9.74%], Yatsen Holding[9.30%], Kratos Defense[9.09%], WW [9.03%], Carvana Co[8.79%], Qurate Retail[8.74%]