
 Login Sign Up


| |||||
 |  | ||||

| 12Stocks.com Market Intelligence |
Best Consumer Services Stocks
| In a hurry? Services & Goods Stocks: Performance Trends Table, Stock Charts
Sort Consumer Services: Daily, Weekly, Year-to-Date, Market Cap & Trends. Filter Services & Goods stocks list by size: All Large Mid-Range Small |
| 12Stocks.com Consumer Services Stocks Performances & Trends Daily | |||||||||
|
|  The overall Smart Investing & Trading Score is 57 (0-bearish to 100-bullish) which puts Consumer Services sector in short term neutral trend. The Smart Investing & Trading Score from previous trading session is 35 and hence an improvement of trend.
| ||||||||
Here are the Smart Investing & Trading Scores of the most requested Consumer Services stocks at 12Stocks.com (click stock name for detailed review):
|


| Consider signing up for our daily 12Stocks.com "Best Stocks Newsletter". You will never ever miss a big stock move again! |
| 12Stocks.com: Investing in Consumer Services sector with Stocks | |
|
The following table helps investors and traders sort through current performance and trends (as measured by Smart Investing & Trading Score) of various
stocks in the Consumer Services sector. Quick View: Move mouse or cursor over stock symbol (ticker) to view short-term Technical chart and over stock name to view long term chart. Click on  to add stock symbol to your watchlist and to add stock symbol to your watchlist and  to view watchlist. Click on any ticker or stock name for detailed market intelligence report for that stock. to view watchlist. Click on any ticker or stock name for detailed market intelligence report for that stock. |
12Stocks.com Performance of Stocks in Consumer Services Sector
| Ticker | Stock Name | Watchlist | Category | Recent Price | Smart Investing & Trading Score | Change % | Weekly Change% |
| CVNA | Carvana Co |   | Automobile | 121.67 | 100 | 4.44% | 44.31% |
| W | Wayfair | | Retail | 63.59 | 95 | 8.44% | 22.26% |
| ATGE | Adtalem Global | | Education | 60.08 | 100 | 14.66% | 20.93% |
| NOVA | Sunnova Energy | | Services | 4.79 | 74 | 8.37% | 19.75% |
| WW | WW | | Services | 2.09 | 64 | 10.58% | 19.43% |
| OLPX | Olaplex | | Specialty Retail | 1.59 | 67 | -5.09% | 18.28% |
| INCR | Research | | Research | 3.12 | 29 | 1.30% | 17.29% |
| HSAI | Hesai | | Auto Parts | 5.15 | 100 | 5.10% | 17.05% |
| GTN | Gray Television | | Broadcasting | 6.48 | 100 | 0.62% | 15.51% |
| SGHC | Super | | Gambling | 3.47 | 100 | 4.83% | 15.28% |
| SDA | SunCar Technology | | Auto & Truck Dealerships | 8.30 | 100 | 9.43% | 14.33% |
| MLCO | Melco Resorts | | Casinos | 7.24 | 74 | 1.26% | 14.20% |
| PSNY | Polestar Automotive | | Auto Manufacturers | 1.35 | 37 | -6.27% | 13.98% |
| MSC | Studio City | | Casinos | 8.00 | 85 | 5.54% | 12.44% |
| FTDR | frontdoor | | Services | 34.65 | 100 | 1.85% | 11.59% |
| FYBR | Frontier | | Telecom Services | 25.59 | 100 | 8.66% | 11.48% |
| RH | RH | | Retail | 275.05 | 82 | 4.98% | 10.50% |
| SFM | Sprouts Farmers | | Grocery | 73.68 | 100 | 2.33% | 10.00% |
| AMCX | AMC Networks | | Entertainment | 11.85 | 69 | 2.69% | 9.42% |
| SBGI | Slair Broadcast | | Broadcasting | 13.21 | 74 | -0.68% | 8.99% |
| HUYA | HUYA | | Entertainment | 4.77 | 83 | 0.42% | 8.90% |
| FWRG | First Watch | | Restaurants | 25.68 | 83 | 1.42% | 8.63% |
| EVGO | EVgo | | Specialty Retail | 1.95 | 59 | 3.46% | 8.06% |
| WSM | Williams-Sonoma | | Retail | 304.70 | 85 | 4.26% | 7.99% |
| TTEK | Tetra Tech | | Services | 207.75 | 100 | 1.71% | 7.92% |
| For chart view version of above stock list: Chart View ➞ 0 - 25 , 25 - 50 , 50 - 75 , 75 - 100 , 100 - 125 , 125 - 150 , 150 - 175 , 175 - 200 | ||
 | Click To Change The Sort Order: By Market Cap or Company Size Performance: Year-to-date, Week and Day |  |
|
Get the most comprehensive stock market coverage daily at 12Stocks.com ➞ Best Stocks Today ➞ Best Stocks Weekly ➞ Best Stocks Year-to-Date ➞ Best Stocks Trends ➞  Best Stocks Today 12Stocks.com Best Nasdaq Stocks ➞ Best S&P 500 Stocks ➞ Best Tech Stocks ➞ Best Biotech Stocks ➞ |
| Detailed Overview of Consumer Services Stocks |
| Consumer Services Technical Overview, Leaders & Laggards, Top Consumer Services ETF Funds & Detailed Consumer Services Stocks List, Charts, Trends & More |
| Consumer Services Sector: Technical Analysis, Trends & YTD Performance | |
| Consumer Services sector is composed of stocks
from retail, entertainment, media/publishing, consumer goods
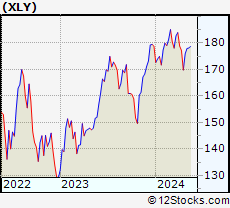
and services subsectors. Consumer Services sector, as represented by XLY, an exchange-traded fund [ETF] that holds basket of Consumer Services stocks (e.g, Walmart, Alibaba) is down by -0.5% and is currently underperforming the overall market by -7.38% year-to-date. Below is a quick view of Technical charts and trends: |
|
 XLY Weekly Chart |
|
| Long Term Trend: Not Good | |
| Medium Term Trend: Very Good | |
 XLY Daily Chart |
|
| Short Term Trend: Very Good | |
| Overall Trend Score: 57 | |
| YTD Performance: -0.5% | |
| **Trend Scores & Views Are Only For Educational Purposes And Not For Investing | |
| 12Stocks.com: Top Performing Consumer Services Sector Stocks | ||||||||||||||||||||||||||||||||||||||||||||||||
 The top performing Consumer Services sector stocks year to date are
Now, more recently, over last week, the top performing Consumer Services sector stocks on the move are


|
||||||||||||||||||||||||||||||||||||||||||||||||
| 12Stocks.com: Investing in Consumer Services Sector using Exchange Traded Funds | |
|
The following table shows list of key exchange traded funds (ETF) that
help investors track Consumer Services Index. For detailed view, check out our ETF Funds section of our website. Quick View: Move mouse or cursor over ETF symbol (ticker) to view short-term Technical chart and over ETF name to view long term chart. Click on ticker or stock name for detailed view. Click on to add stock symbol to your watchlist and to view watchlist. |
12Stocks.com List of ETFs that track Consumer Services Index
| Ticker | ETF Name | Watchlist | Recent Price | Smart Investing & Trading Score | Change % | Week % | Year-to-date % |
| XLY | Consumer Discret Sel | | 177.91 | 57 | 0.67 | 1.14 | -0.5% |
| RTH | Retail | | 200.52 | 40 | 0.87 | -0.28 | 6.53% |
| IYC | Consumer Services | | 79.09 | 57 | 0.84 | 0.93 | 4.38% |
| XRT | Retail | | 73.42 | 54 | 1.28 | 0.27 | 1.52% |
| IYK | Consumer Goods | | 66.59 | 64 | 0.20 | -0.25 | 4.2% |
| UCC | Consumer Services | | 34.07 | 54 | 0.31 | -0.27 | -5.13% |
| RETL | Retail Bull 3X | | 8.83 | 52 | 3.52 | 0 | -3.18% |
| RXI | Globl Consumer Discretionary | | 163.11 | 64 | 1.02 | 1.2 | 2.55% |
| SCC | Short Consumer Services | | 15.39 | 36 | -1.63 | -2.5 | 0.4% |
| UGE | Consumer Goods | | 17.27 | 90 | 0.64 | 0.58 | 9.71% |
| 12Stocks.com: Charts, Trends, Fundamental Data and Performances of Consumer Services Stocks | |
|
We now take in-depth look at all Consumer Services stocks including charts, multi-period performances and overall trends (as measured by Smart Investing & Trading Score). One can sort Consumer Services stocks (click link to choose) by Daily, Weekly and by Year-to-Date performances. Also, one can sort by size of the company or by market capitalization. |
| Select Your Default Chart Type: | |||||
| |||||
| Click on stock symbol or name for detailed view. Click on to add stock symbol to your watchlist and to view watchlist. Quick View: Move mouse or cursor over "Daily" to quickly view daily Technical stock chart and over "Weekly" to view weekly Technical stock chart. | |||||

 | CVNA Carvana Co. |
| Sector: Services & Goods | |
| SubSector: Auto Dealerships | |
| MarketCap: 5585.31 Millions | |
| Recent Price: 121.67 Smart Investing & Trading Score: 100 | |
| Day Percent Change: 4.44% Day Change: 5.17 | |
| Week Change: 44.31% Year-to-date Change: 129.8% | |
| CVNA Links: Profile News Message Board | |
| Charts:- Daily , Weekly | |
| Add CVNA to Watchlist: View: Get Complete CVNA Trend Analysis ➞ | |
 | W Wayfair Inc. |
| Sector: Services & Goods | |
| SubSector: Catalog & Mail Order Houses | |
| MarketCap: 3497.02 Millions | |
| Recent Price: 63.59 Smart Investing & Trading Score: 95 | |
| Day Percent Change: 8.44% Day Change: 4.95 | |
| Week Change: 22.26% Year-to-date Change: 3.1% | |
| W Links: Profile News Message Board | |
| Charts:- Daily , Weekly | |
| Add W to Watchlist: View: Get Complete W Trend Analysis ➞ | |
 | ATGE Adtalem Global Education Inc. |
| Sector: Services & Goods | |
| SubSector: Education & Training Services | |
| MarketCap: 1273.86 Millions | |
| Recent Price: 60.08 Smart Investing & Trading Score: 100 | |
| Day Percent Change: 14.66% Day Change: 7.68 | |
| Week Change: 20.93% Year-to-date Change: 1.9% | |
| ATGE Links: Profile News Message Board | |
| Charts:- Daily , Weekly | |
| Add ATGE to Watchlist: View: Get Complete ATGE Trend Analysis ➞ | |
 | NOVA Sunnova Energy International Inc. |
| Sector: Services & Goods | |
| SubSector: Management Services | |
| MarketCap: 1180.45 Millions | |
| Recent Price: 4.79 Smart Investing & Trading Score: 74 | |
| Day Percent Change: 8.37% Day Change: 0.37 | |
| Week Change: 19.75% Year-to-date Change: -68.6% | |
| NOVA Links: Profile News Message Board | |
| Charts:- Daily , Weekly | |
| Add NOVA to Watchlist: View: Get Complete NOVA Trend Analysis ➞ | |
 | WW WW International, Inc. |
| Sector: Services & Goods | |
| SubSector: Personal Services | |
| MarketCap: 1186.25 Millions | |
| Recent Price: 2.09 Smart Investing & Trading Score: 64 | |
| Day Percent Change: 10.58% Day Change: 0.20 | |
| Week Change: 19.43% Year-to-date Change: -76.1% | |
| WW Links: Profile News Message Board | |
| Charts:- Daily , Weekly | |
| Add WW to Watchlist: View: Get Complete WW Trend Analysis ➞ | |
 | OLPX Olaplex Holdings, Inc. |
| Sector: Services & Goods | |
| SubSector: Specialty Retail | |
| MarketCap: 2340 Millions | |
| Recent Price: 1.59 Smart Investing & Trading Score: 67 | |
| Day Percent Change: -5.09% Day Change: -0.08 | |
| Week Change: 18.28% Year-to-date Change: -38.1% | |
| OLPX Links: Profile News Message Board | |
| Charts:- Daily , Weekly | |
| Add OLPX to Watchlist: View: Get Complete OLPX Trend Analysis ➞ | |
 | INCR INC Research Holdings, Inc. |
| Sector: Services & Goods | |
| SubSector: Research Services | |
| MarketCap: 2486.94 Millions | |
| Recent Price: 3.12 Smart Investing & Trading Score: 29 | |
| Day Percent Change: 1.30% Day Change: 0.04 | |
| Week Change: 17.29% Year-to-date Change: 141.9% | |
| INCR Links: Profile News Message Board | |
| Charts:- Daily , Weekly | |
| Add INCR to Watchlist: View: Get Complete INCR Trend Analysis ➞ | |
 | HSAI Hesai Group |
| Sector: Services & Goods | |
| SubSector: Auto Parts | |
| MarketCap: 1330 Millions | |
| Recent Price: 5.15 Smart Investing & Trading Score: 100 | |
| Day Percent Change: 5.10% Day Change: 0.25 | |
| Week Change: 17.05% Year-to-date Change: -43.3% | |
| HSAI Links: Profile News Message Board | |
| Charts:- Daily , Weekly | |
| Add HSAI to Watchlist: View: Get Complete HSAI Trend Analysis ➞ | |
 | GTN Gray Television, Inc. |
| Sector: Services & Goods | |
| SubSector: Broadcasting - TV | |
| MarketCap: 1144.63 Millions | |
| Recent Price: 6.48 Smart Investing & Trading Score: 100 | |
| Day Percent Change: 0.62% Day Change: 0.04 | |
| Week Change: 15.51% Year-to-date Change: -27.7% | |
| GTN Links: Profile News Message Board | |
| Charts:- Daily , Weekly | |
| Add GTN to Watchlist: View: Get Complete GTN Trend Analysis ➞ | |
 | SGHC Super Group (SGHC) Limited |
| Sector: Services & Goods | |
| SubSector: Gambling | |
| MarketCap: 1390 Millions | |
| Recent Price: 3.47 Smart Investing & Trading Score: 100 | |
| Day Percent Change: 4.83% Day Change: 0.16 | |
| Week Change: 15.28% Year-to-date Change: 8.6% | |
| SGHC Links: Profile News Message Board | |
| Charts:- Daily , Weekly | |
| Add SGHC to Watchlist: View: Get Complete SGHC Trend Analysis ➞ | |
 | SDA SunCar Technology Group Inc. |
| Sector: Services & Goods | |
| SubSector: Auto & Truck Dealerships | |
| MarketCap: 2680 Millions | |
| Recent Price: 8.30 Smart Investing & Trading Score: 100 | |
| Day Percent Change: 9.43% Day Change: 0.72 | |
| Week Change: 14.33% Year-to-date Change: 6.8% | |
| SDA Links: Profile News Message Board | |
| Charts:- Daily , Weekly | |
| Add SDA to Watchlist: View: Get Complete SDA Trend Analysis ➞ | |
 | MLCO Melco Resorts & Entertainment Limited |
| Sector: Services & Goods | |
| SubSector: Resorts & Casinos | |
| MarketCap: 7031.14 Millions | |
| Recent Price: 7.24 Smart Investing & Trading Score: 74 | |
| Day Percent Change: 1.26% Day Change: 0.09 | |
| Week Change: 14.2% Year-to-date Change: -18.4% | |
| MLCO Links: Profile News Message Board | |
| Charts:- Daily , Weekly | |
| Add MLCO to Watchlist: View: Get Complete MLCO Trend Analysis ➞ | |
 | PSNY Polestar Automotive Holding UK PLC |
| Sector: Services & Goods | |
| SubSector: Auto Manufacturers | |
| MarketCap: 7870 Millions | |
| Recent Price: 1.35 Smart Investing & Trading Score: 37 | |
| Day Percent Change: -6.27% Day Change: -0.09 | |
| Week Change: 13.98% Year-to-date Change: -40.9% | |
| PSNY Links: Profile News Message Board | |
| Charts:- Daily , Weekly | |
| Add PSNY to Watchlist: View: Get Complete PSNY Trend Analysis ➞ | |
 | MSC Studio City International Holdings Limited |
| Sector: Services & Goods | |
| SubSector: Resorts & Casinos | |
| MarketCap: 1420.54 Millions | |
| Recent Price: 8.00 Smart Investing & Trading Score: 85 | |
| Day Percent Change: 5.54% Day Change: 0.42 | |
| Week Change: 12.44% Year-to-date Change: 23.5% | |
| MSC Links: Profile News Message Board | |
| Charts:- Daily , Weekly | |
| Add MSC to Watchlist: View: Get Complete MSC Trend Analysis ➞ | |
 | FTDR frontdoor, inc. |
| Sector: Services & Goods | |
| SubSector: Business Services | |
| MarketCap: 2974.22 Millions | |
| Recent Price: 34.65 Smart Investing & Trading Score: 100 | |
| Day Percent Change: 1.85% Day Change: 0.63 | |
| Week Change: 11.59% Year-to-date Change: -1.6% | |
| FTDR Links: Profile News Message Board | |
| Charts:- Daily , Weekly | |
| Add FTDR to Watchlist: View: Get Complete FTDR Trend Analysis ➞ | |
 | FYBR Frontier Communications Parent, Inc. |
| Sector: Services & Goods | |
| SubSector: Telecom Services | |
| MarketCap: 4460 Millions | |
| Recent Price: 25.59 Smart Investing & Trading Score: 100 | |
| Day Percent Change: 8.66% Day Change: 2.04 | |
| Week Change: 11.48% Year-to-date Change: 1.4% | |
| FYBR Links: Profile News Message Board | |
| Charts:- Daily , Weekly | |
| Add FYBR to Watchlist: View: Get Complete FYBR Trend Analysis ➞ | |
 | RH RH |
| Sector: Services & Goods | |
| SubSector: Home Furnishing Stores | |
| MarketCap: 1828.25 Millions | |
| Recent Price: 275.05 Smart Investing & Trading Score: 82 | |
| Day Percent Change: 4.98% Day Change: 13.04 | |
| Week Change: 10.5% Year-to-date Change: -5.6% | |
| RH Links: Profile News Message Board | |
| Charts:- Daily , Weekly | |
| Add RH to Watchlist: View: Get Complete RH Trend Analysis ➞ | |
 | SFM Sprouts Farmers Market, Inc. |
| Sector: Services & Goods | |
| SubSector: Grocery Stores | |
| MarketCap: 2495.85 Millions | |
| Recent Price: 73.68 Smart Investing & Trading Score: 100 | |
| Day Percent Change: 2.33% Day Change: 1.68 | |
| Week Change: 10% Year-to-date Change: 53.2% | |
| SFM Links: Profile News Message Board | |
| Charts:- Daily , Weekly | |
| Add SFM to Watchlist: View: Get Complete SFM Trend Analysis ➞ | |
 | AMCX AMC Networks Inc. |
| Sector: Services & Goods | |
| SubSector: Entertainment - Diversified | |
| MarketCap: 1477.37 Millions | |
| Recent Price: 11.85 Smart Investing & Trading Score: 69 | |
| Day Percent Change: 2.69% Day Change: 0.31 | |
| Week Change: 9.42% Year-to-date Change: -36.9% | |
| AMCX Links: Profile News Message Board | |
| Charts:- Daily , Weekly | |
| Add AMCX to Watchlist: View: Get Complete AMCX Trend Analysis ➞ | |
 | SBGI Sinclair Broadcast Group, Inc. |
| Sector: Services & Goods | |
| SubSector: Broadcasting - TV | |
| MarketCap: 1461.73 Millions | |
| Recent Price: 13.21 Smart Investing & Trading Score: 74 | |
| Day Percent Change: -0.68% Day Change: -0.09 | |
| Week Change: 8.99% Year-to-date Change: 1.4% | |
| SBGI Links: Profile News Message Board | |
| Charts:- Daily , Weekly | |
| Add SBGI to Watchlist: View: Get Complete SBGI Trend Analysis ➞ | |
 | HUYA HUYA Inc. |
| Sector: Services & Goods | |
| SubSector: Entertainment - Diversified | |
| MarketCap: 3358.17 Millions | |
| Recent Price: 4.77 Smart Investing & Trading Score: 83 | |
| Day Percent Change: 0.42% Day Change: 0.02 | |
| Week Change: 8.9% Year-to-date Change: 30.3% | |
| HUYA Links: Profile News Message Board | |
| Charts:- Daily , Weekly | |
| Add HUYA to Watchlist: View: Get Complete HUYA Trend Analysis ➞ | |
 | FWRG First Watch Restaurant Group, Inc. |
| Sector: Services & Goods | |
| SubSector: Restaurants | |
| MarketCap: 1000 Millions | |
| Recent Price: 25.68 Smart Investing & Trading Score: 83 | |
| Day Percent Change: 1.42% Day Change: 0.36 | |
| Week Change: 8.63% Year-to-date Change: 28.9% | |
| FWRG Links: Profile News Message Board | |
| Charts:- Daily , Weekly | |
| Add FWRG to Watchlist: View: Get Complete FWRG Trend Analysis ➞ | |
 | EVGO EVgo, Inc. |
| Sector: Services & Goods | |
| SubSector: Specialty Retail | |
| MarketCap: 1140 Millions | |
| Recent Price: 1.95 Smart Investing & Trading Score: 59 | |
| Day Percent Change: 3.46% Day Change: 0.07 | |
| Week Change: 8.06% Year-to-date Change: -45.8% | |
| EVGO Links: Profile News Message Board | |
| Charts:- Daily , Weekly | |
| Add EVGO to Watchlist: View: Get Complete EVGO Trend Analysis ➞ | |
 | WSM Williams-Sonoma, Inc. |
| Sector: Services & Goods | |
| SubSector: Home Furnishing Stores | |
| MarketCap: 3370.05 Millions | |
| Recent Price: 304.70 Smart Investing & Trading Score: 85 | |
| Day Percent Change: 4.26% Day Change: 12.46 | |
| Week Change: 7.99% Year-to-date Change: 51.0% | |
| WSM Links: Profile News Message Board | |
| Charts:- Daily , Weekly | |
| Add WSM to Watchlist: View: Get Complete WSM Trend Analysis ➞ | |
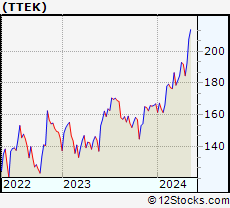 | TTEK Tetra Tech, Inc. |
| Sector: Services & Goods | |
| SubSector: Technical Services | |
| MarketCap: 3985.5 Millions | |
| Recent Price: 207.75 Smart Investing & Trading Score: 100 | |
| Day Percent Change: 1.71% Day Change: 3.49 | |
| Week Change: 7.92% Year-to-date Change: 24.5% | |
| TTEK Links: Profile News Message Board | |
| Charts:- Daily , Weekly | |
| Add TTEK to Watchlist: View: Get Complete TTEK Trend Analysis ➞ | |
| For tabular summary view of above stock list: Summary View ➞ 0 - 25 , 25 - 50 , 50 - 75 , 75 - 100 , 100 - 125 , 125 - 150 , 150 - 175 , 175 - 200 | ||
| Click To Change The Sort Order: By Market Cap or Company Size Performance: Year-to-date, Week and Day | |
| Select Chart Type: | ||
|
Best Stocks Today 12Stocks.com |
© 2024 12Stocks.com Terms & Conditions Privacy Contact Us
All Information Provided Only For Education And Not To Be Used For Investing or Trading. See Terms & Conditions


One More Thing ... Get Best Stocks Delivered Daily!
Never Ever Miss A Move With Our Top Ten Stocks Lists
Find Best Stocks In Any Market - Bull or Bear Market
Take A Peek At Our Top Ten Stocks Lists: Daily, Weekly, Year-to-Date & Top Trends
Find Best Stocks In Any Market - Bull or Bear Market
Take A Peek At Our Top Ten Stocks Lists: Daily, Weekly, Year-to-Date & Top Trends
Consumer Services Stocks With Best Up Trends [0-bearish to 100-bullish]: GameStop [100], El Pollo[100], Adtalem Global[100], Chicken Soup[100], Willdan [100], SunCar Technology[100], Frontier [100], Verra Mobility[100], Mondee [100], Laureate Education[100], Hesai [100]
Best Consumer Services Stocks Year-to-Date:
U Power[3264.96%], Vroom [2061.45%], Yatsen Holding[493.22%], Fluent [422.39%], Research[141.9%], Codere Online[131.85%], Carvana Co[129.83%], Sweetgreen [95.58%], RealReal [94.03%], Smart Share[68.93%], PaySign [68.93%] Best Consumer Services Stocks This Week:
Chicken Soup[192.17%], Carvana Co[44.31%], Smart Share[40.05%], GameStop [38.4%], Perdoceo Education[29.06%], CareDx [28.57%], Gannett Co[22.87%], Wayfair [22.26%], Adtalem Global[20.93%], Sunnova Energy[19.75%], WW [19.43%] Best Consumer Services Stocks Daily:
GameStop [29.08%], El Pollo[16.40%], Team [15.14%], Adtalem Global[14.66%], Chicken Soup[13.51%], WW [10.58%], Willdan [9.87%], U Power[9.44%], SunCar Technology[9.43%], Frontier [8.66%], Wayfair [8.44%]