
 Login Sign Up


| |||||
 |  | ||||

| 12Stocks.com Market Intelligence |
Best Consumer Services Stocks
| In a hurry? Services & Goods Stocks: Performance Trends Table, Stock Charts
Sort Consumer Services: Daily, Weekly, Year-to-Date, Market Cap & Trends. Filter Services & Goods stocks list by size: All Large Mid-Range Small |
| 12Stocks.com Consumer Services Stocks Performances & Trends Daily | |||||||||
|
|  The overall Smart Investing & Trading Score is 100 (0-bearish to 100-bullish) which puts Consumer Services sector in short term bullish trend. The Smart Investing & Trading Score from previous trading session is 50 and an improvement of trend continues.
| ||||||||
Here are the Smart Investing & Trading Scores of the most requested Consumer Services stocks at 12Stocks.com (click stock name for detailed review):
|


| Consider signing up for our daily 12Stocks.com "Best Stocks Newsletter". You will never ever miss a big stock move again! |
| 12Stocks.com: Investing in Consumer Services sector with Stocks | |
|
The following table helps investors and traders sort through current performance and trends (as measured by Smart Investing & Trading Score) of various
stocks in the Consumer Services sector. Quick View: Move mouse or cursor over stock symbol (ticker) to view short-term Technical chart and over stock name to view long term chart. Click on  to add stock symbol to your watchlist and to add stock symbol to your watchlist and  to view watchlist. Click on any ticker or stock name for detailed market intelligence report for that stock. to view watchlist. Click on any ticker or stock name for detailed market intelligence report for that stock. |
12Stocks.com Performance of Stocks in Consumer Services Sector
| Ticker | Stock Name | Watchlist | Category | Recent Price | Smart Investing & Trading Score | Change % | YTD Change% |
| KAR | Openlane |   | Auto & Truck Dealerships | 28.60 | 30 | -0.97 | 41.72% |
| TIF | Tiffany | | Retail | 53.72 | 30 | -0.98 | 0.00% |
| COH | Coach | | Retail | 53.72 | 60 | -0.98 | 0.00% |
| CRMT | Americas Car | | Auto & Truck Dealerships | 34.21 | 10 | -0.98 | -31.32% |
| QRTEB | Qurate Retail | | Retail | 2.00 | 10 | -0.99 | -29.08% |
| VFC | VF Corp | | Apparel Manufacturing | 14.71 | 30 | -1.01 | -30.91% |
| RUTH | Ruth s | | Restaurants | 0.97 | 0 | -1.02 | 0.00% |
| APTI | Apptio | | Services | 27.66 | 80 | -1.04 | 0.00% |
| XPEL | XPEL | | Auto Parts | 34.32 | 20 | -1.04 | -11.93% |
| KBH | KB Home | | Residential Construction | 65.19 | 40 | -1.05 | 2.14% |
| FTDR | Frontdoor | | Services | 65.60 | 70 | -1.06 | 19.64% |
| SG | Sweetgreen | | Restaurants | 8.40 | 10 | -1.06 | -73.82% |
| CSS | CSS Industries | | Retail | 42.29 | 50 | -1.08 | 0.00% |
| MCD | McDonald's Corp | | Restaurants | 302.07 | 20 | -1.09 | 4.45% |
| WGO | Winnebago Industries | | Recreational | 33.50 | 30 | -1.09 | -28.41% |
| SDA | SunCar Technology | | Auto & Truck Dealerships | 2.67 | 70 | -1.11 | -70.37% |
| PTLO | Portillos | | Restaurants | 6.06 | 10 | -1.11 | -24.15% |
| MHO | MI Homes | | Residential Construction | 152.38 | 60 | -1.12 | 16.60% |
| ORLY | O'Reilly Automotive | | Auto Parts | 106.30 | 60 | -1.12 | 34.24% |
| LAD | Lithia Motors | | Auto & Truck Dealerships | 330.30 | 20 | -1.13 | -4.77% |
| DFH | Dream Finders | | Residential Construction | 28.78 | 50 | -1.13 | 25.51% |
| WWW | Wolverine World | | Footwear & Accessories | 30.18 | 30 | -1.15 | 35.20% |
| PLNT | Planet Fitness | | Leisure | 100.56 | 0 | -1.19 | 0.97% |
| TTS | Tile Shop | | Retail | 1.63 | 0 | -1.21 | 0.00% |
| JMIA | Jumia Technologies | | Internet Retail | 9.79 | 80 | -1.21 | 151.03% |
| For chart view version of above stock list: Chart View ➞ 0 - 25 , 25 - 50 , 50 - 75 , 75 - 100 , 100 - 125 , 125 - 150 , 150 - 175 , 175 - 200 , 200 - 225 , 225 - 250 , 250 - 275 , 275 - 300 , 300 - 325 , 325 - 350 , 350 - 375 , 375 - 400 , 400 - 425 , 425 - 450 , 450 - 475 , 475 - 500 , 500 - 525 , 525 - 550 , 550 - 575 , 575 - 600 , 600 - 625 | ||
 | Click To Change The Sort Order: By Market Cap or Company Size Performance: Year-to-date, Week and Day |  |
|
Get the most comprehensive stock market coverage daily at 12Stocks.com ➞ Best Stocks Today ➞ Best Stocks Weekly ➞ Best Stocks Year-to-Date ➞ Best Stocks Trends ➞  Best Stocks Today 12Stocks.com Best Nasdaq Stocks ➞ Best S&P 500 Stocks ➞ Best Tech Stocks ➞ Best Biotech Stocks ➞ |
| Detailed Overview of Consumer Services Stocks |
| Consumer Services Technical Overview, Leaders & Laggards, Top Consumer Services ETF Funds & Detailed Consumer Services Stocks List, Charts, Trends & More |
| Consumer Services Sector: Technical Analysis, Trends & YTD Performance | |
| Consumer Services sector is composed of stocks
from retail, entertainment, media/publishing, consumer goods
and services subsectors. Consumer Services sector, as represented by XLY, an exchange-traded fund [ETF] that holds basket of Consumer Services stocks (e.g, Walmart, Alibaba) is up by 9.2482% and is currently underperforming the overall market by -4.1526% year-to-date. Below is a quick view of Technical charts and trends: |
|
 XLY Weekly Chart |
|
| Long Term Trend: Very Good | |
| Medium Term Trend: Good | |
 XLY Daily Chart |
|
| Short Term Trend: Very Good | |
| Overall Trend Score: 100 | |
| YTD Performance: 9.2482% | |
| **Trend Scores & Views Are Only For Educational Purposes And Not For Investing | |
| 12Stocks.com: Top Performing Consumer Services Sector Stocks | ||||||||||||||||||||||||||||||||||||||||||||||||
 The top performing Consumer Services sector stocks year to date are
Now, more recently, over last week, the top performing Consumer Services sector stocks on the move are


|
||||||||||||||||||||||||||||||||||||||||||||||||
| 12Stocks.com: Investing in Consumer Services Sector using Exchange Traded Funds | |
|
The following table shows list of key exchange traded funds (ETF) that
help investors track Consumer Services Index. For detailed view, check out our ETF Funds section of our website. Quick View: Move mouse or cursor over ETF symbol (ticker) to view short-term Technical chart and over ETF name to view long term chart. Click on ticker or stock name for detailed view. Click on to add stock symbol to your watchlist and to view watchlist. |
12Stocks.com List of ETFs that track Consumer Services Index
| Ticker | ETF Name | Watchlist | Recent Price | Smart Investing & Trading Score | Change % | Week % | Year-to-date % |
| PMR | Retail | | 40.96 | 70 | -0.0244081 | 2.86288 | 0% |
| 12Stocks.com: Charts, Trends, Fundamental Data and Performances of Consumer Services Stocks | |
|
We now take in-depth look at all Consumer Services stocks including charts, multi-period performances and overall trends (as measured by Smart Investing & Trading Score). One can sort Consumer Services stocks (click link to choose) by Daily, Weekly and by Year-to-Date performances. Also, one can sort by size of the company or by market capitalization. |
| Select Your Default Chart Type: | |||||
| |||||
| Click on stock symbol or name for detailed view. Click on to add stock symbol to your watchlist and to view watchlist. Quick View: Move mouse or cursor over "Daily" to quickly view daily Technical stock chart and over "Weekly" to view weekly Technical stock chart. | |||||

 | KAR Openlane Inc |
| Sector: Services & Goods | |
| SubSector: Auto & Truck Dealerships | |
| MarketCap: 3090.25 Millions | |
| Recent Price: 28.60 Smart Investing & Trading Score: 30 | |
| Day Percent Change: -0.969529% Day Change: 0.22 | |
| Week Change: -1.61679% Year-to-date Change: 41.7% | |
| KAR Links: Profile News Message Board | |
| Charts:- Daily , Weekly | |
| Add KAR to Watchlist: View: Get Complete KAR Trend Analysis ➞ | |
 | TIF Tiffany & Co. |
| Sector: Services & Goods | |
| SubSector: Jewelry Stores | |
| MarketCap: 15545.8 Millions | |
| Recent Price: 53.72 Smart Investing & Trading Score: 30 | |
| Day Percent Change: -0.976959% Day Change: -9999 | |
| Week Change: 4.73777% Year-to-date Change: 0.0% | |
| TIF Links: Profile News Message Board | |
| Charts:- Daily , Weekly | |
| Add TIF to Watchlist: View: Get Complete TIF Trend Analysis ➞ | |
 | COH Coach, Inc. |
| Sector: Services & Goods | |
| SubSector: Textile - Apparel Footwear & Accessories | |
| MarketCap: 11180.7 Millions | |
| Recent Price: 53.72 Smart Investing & Trading Score: 60 | |
| Day Percent Change: -0.976959% Day Change: -9999 | |
| Week Change: 4.73777% Year-to-date Change: 0.0% | |
| COH Links: Profile News Message Board | |
| Charts:- Daily , Weekly | |
| Add COH to Watchlist: View: Get Complete COH Trend Analysis ➞ | |
 | CRMT Americas Car Mart, Inc |
| Sector: Services & Goods | |
| SubSector: Auto & Truck Dealerships | |
| MarketCap: 298.95 Millions | |
| Recent Price: 34.21 Smart Investing & Trading Score: 10 | |
| Day Percent Change: -0.984081% Day Change: 0.31 | |
| Week Change: -5.27482% Year-to-date Change: -31.3% | |
| CRMT Links: Profile News Message Board | |
| Charts:- Daily , Weekly | |
| Add CRMT to Watchlist: View: Get Complete CRMT Trend Analysis ➞ | |
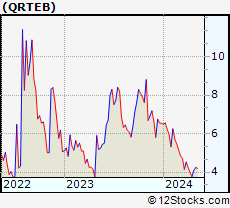 | QRTEB Qurate Retail, Inc. |
| Sector: Services & Goods | |
| SubSector: Specialty Retail, Other | |
| MarketCap: 124.244 Millions | |
| Recent Price: 2.00 Smart Investing & Trading Score: 10 | |
| Day Percent Change: -0.990099% Day Change: -9999 | |
| Week Change: -0.497512% Year-to-date Change: -29.1% | |
| QRTEB Links: Profile News Message Board | |
| Charts:- Daily , Weekly | |
| Add QRTEB to Watchlist: View: Get Complete QRTEB Trend Analysis ➞ | |
 | VFC VF Corp |
| Sector: Services & Goods | |
| SubSector: Apparel Manufacturing | |
| MarketCap: 5859.25 Millions | |
| Recent Price: 14.71 Smart Investing & Trading Score: 30 | |
| Day Percent Change: -1.00942% Day Change: -0.05 | |
| Week Change: -1.93333% Year-to-date Change: -30.9% | |
| VFC Links: Profile News Message Board | |
| Charts:- Daily , Weekly | |
| Add VFC to Watchlist: View: Get Complete VFC Trend Analysis ➞ | |
 | RUTH Ruth s Hospitality Group, Inc. |
| Sector: Services & Goods | |
| SubSector: Restaurants | |
| MarketCap: 138.97 Millions | |
| Recent Price: 0.97 Smart Investing & Trading Score: 0 | |
| Day Percent Change: -1.02041% Day Change: -9999 | |
| Week Change: -95.4863% Year-to-date Change: 0.0% | |
| RUTH Links: Profile News Message Board | |
| Charts:- Daily , Weekly | |
| Add RUTH to Watchlist: View: Get Complete RUTH Trend Analysis ➞ | |
 | APTI Apptio, Inc. |
| Sector: Services & Goods | |
| SubSector: Business Services | |
| MarketCap: 477.77 Millions | |
| Recent Price: 27.66 Smart Investing & Trading Score: 80 | |
| Day Percent Change: -1.03757% Day Change: -9999 | |
| Week Change: 96.7283% Year-to-date Change: 0.0% | |
| APTI Links: Profile News Message Board | |
| Charts:- Daily , Weekly | |
| Add APTI to Watchlist: View: Get Complete APTI Trend Analysis ➞ | |
 | XPEL XPEL Inc |
| Sector: Services & Goods | |
| SubSector: Auto Parts | |
| MarketCap: 987.36 Millions | |
| Recent Price: 34.32 Smart Investing & Trading Score: 20 | |
| Day Percent Change: -1.03806% Day Change: -0.23 | |
| Week Change: -3.81166% Year-to-date Change: -11.9% | |
| XPEL Links: Profile News Message Board | |
| Charts:- Daily , Weekly | |
| Add XPEL to Watchlist: View: Get Complete XPEL Trend Analysis ➞ | |
 | KBH KB Home |
| Sector: Services & Goods | |
| SubSector: Residential Construction | |
| MarketCap: 4625.37 Millions | |
| Recent Price: 65.19 Smart Investing & Trading Score: 40 | |
| Day Percent Change: -1.04736% Day Change: -0.64 | |
| Week Change: -4.09004% Year-to-date Change: 2.1% | |
| KBH Links: Profile News Message Board | |
| Charts:- Daily , Weekly | |
| Add KBH to Watchlist: View: Get Complete KBH Trend Analysis ➞ | |
 | FTDR Frontdoor Inc |
| Sector: Services & Goods | |
| SubSector: Personal Services | |
| MarketCap: 4593.15 Millions | |
| Recent Price: 65.60 Smart Investing & Trading Score: 70 | |
| Day Percent Change: -1.05581% Day Change: -0.19 | |
| Week Change: 4.04441% Year-to-date Change: 19.6% | |
| FTDR Links: Profile News Message Board | |
| Charts:- Daily , Weekly | |
| Add FTDR to Watchlist: View: Get Complete FTDR Trend Analysis ➞ | |
 | SG Sweetgreen Inc |
| Sector: Services & Goods | |
| SubSector: Restaurants | |
| MarketCap: 1055.63 Millions | |
| Recent Price: 8.40 Smart Investing & Trading Score: 10 | |
| Day Percent Change: -1.06007% Day Change: -0.04 | |
| Week Change: -5.93505% Year-to-date Change: -73.8% | |
| SG Links: Profile News Message Board | |
| Charts:- Daily , Weekly | |
| Add SG to Watchlist: View: Get Complete SG Trend Analysis ➞ | |
 | CSS CSS Industries, Inc. |
| Sector: Services & Goods | |
| SubSector: Specialty Retail, Other | |
| MarketCap: 210.46 Millions | |
| Recent Price: 42.29 Smart Investing & Trading Score: 50 | |
| Day Percent Change: -1.07602% Day Change: -9999 | |
| Week Change: 23.8723% Year-to-date Change: 0.0% | |
| CSS Links: Profile News Message Board | |
| Charts:- Daily , Weekly | |
| Add CSS to Watchlist: View: Get Complete CSS Trend Analysis ➞ | |
 | MCD McDonald's Corp |
| Sector: Services & Goods | |
| SubSector: Restaurants | |
| MarketCap: 224343 Millions | |
| Recent Price: 302.07 Smart Investing & Trading Score: 20 | |
| Day Percent Change: -1.09037% Day Change: -2.57 | |
| Week Change: -3.91564% Year-to-date Change: 4.5% | |
| MCD Links: Profile News Message Board | |
| Charts:- Daily , Weekly | |
| Add MCD to Watchlist: View: Get Complete MCD Trend Analysis ➞ | |
 | WGO Winnebago Industries, Inc |
| Sector: Services & Goods | |
| SubSector: Recreational Vehicles | |
| MarketCap: 1031.24 Millions | |
| Recent Price: 33.50 Smart Investing & Trading Score: 30 | |
| Day Percent Change: -1.09241% Day Change: -0.67 | |
| Week Change: -8.94265% Year-to-date Change: -28.4% | |
| WGO Links: Profile News Message Board | |
| Charts:- Daily , Weekly | |
| Add WGO to Watchlist: View: Get Complete WGO Trend Analysis ➞ | |
 | SDA SunCar Technology Group Inc |
| Sector: Services & Goods | |
| SubSector: Auto & Truck Dealerships | |
| MarketCap: 270.98 Millions | |
| Recent Price: 2.67 Smart Investing & Trading Score: 70 | |
| Day Percent Change: -1.11111% Day Change: -0.02 | |
| Week Change: 1.13636% Year-to-date Change: -70.4% | |
| SDA Links: Profile News Message Board | |
| Charts:- Daily , Weekly | |
| Add SDA to Watchlist: View: Get Complete SDA Trend Analysis ➞ | |
 | PTLO Portillos Inc |
| Sector: Services & Goods | |
| SubSector: Restaurants | |
| MarketCap: 513.87 Millions | |
| Recent Price: 6.06 Smart Investing & Trading Score: 10 | |
| Day Percent Change: -1.11% Day Change: -0.08 | |
| Week Change: -7.4% Year-to-date Change: -24.2% | |
| PTLO Links: Profile News Message Board | |
| Charts:- Daily , Weekly | |
| Add PTLO to Watchlist: View: Get Complete PTLO Trend Analysis ➞ | |
 | MHO MI Homes Inc |
| Sector: Services & Goods | |
| SubSector: Residential Construction | |
| MarketCap: 4140.97 Millions | |
| Recent Price: 152.38 Smart Investing & Trading Score: 60 | |
| Day Percent Change: -1.11616% Day Change: -1.16 | |
| Week Change: -2.88701% Year-to-date Change: 16.6% | |
| MHO Links: Profile News Message Board | |
| Charts:- Daily , Weekly | |
| Add MHO to Watchlist: View: Get Complete MHO Trend Analysis ➞ | |
 | ORLY O'Reilly Automotive, Inc |
| Sector: Services & Goods | |
| SubSector: Auto Parts | |
| MarketCap: 88956.4 Millions | |
| Recent Price: 106.30 Smart Investing & Trading Score: 60 | |
| Day Percent Change: -1.12093% Day Change: -1.54 | |
| Week Change: 1.38783% Year-to-date Change: 34.2% | |
| ORLY Links: Profile News Message Board | |
| Charts:- Daily , Weekly | |
| Add ORLY to Watchlist: View: Get Complete ORLY Trend Analysis ➞ | |
 | LAD Lithia Motors, Inc |
| Sector: Services & Goods | |
| SubSector: Auto & Truck Dealerships | |
| MarketCap: 8743.82 Millions | |
| Recent Price: 330.30 Smart Investing & Trading Score: 20 | |
| Day Percent Change: -1.12555% Day Change: -1.52 | |
| Week Change: -3.15771% Year-to-date Change: -4.8% | |
| LAD Links: Profile News Message Board | |
| Charts:- Daily , Weekly | |
| Add LAD to Watchlist: View: Get Complete LAD Trend Analysis ➞ | |
 | DFH Dream Finders Homes Inc |
| Sector: Services & Goods | |
| SubSector: Residential Construction | |
| MarketCap: 2873.76 Millions | |
| Recent Price: 28.78 Smart Investing & Trading Score: 50 | |
| Day Percent Change: -1.13363% Day Change: -0.49 | |
| Week Change: -6.98125% Year-to-date Change: 25.5% | |
| DFH Links: Profile News Message Board | |
| Charts:- Daily , Weekly | |
| Add DFH to Watchlist: View: Get Complete DFH Trend Analysis ➞ | |
 | WWW Wolverine World Wide, Inc |
| Sector: Services & Goods | |
| SubSector: Footwear & Accessories | |
| MarketCap: 2587.95 Millions | |
| Recent Price: 30.18 Smart Investing & Trading Score: 30 | |
| Day Percent Change: -1.14641% Day Change: 0.24 | |
| Week Change: -5.24333% Year-to-date Change: 35.2% | |
| WWW Links: Profile News Message Board | |
| Charts:- Daily , Weekly | |
| Add WWW to Watchlist: View: Get Complete WWW Trend Analysis ➞ | |
 | PLNT Planet Fitness Inc |
| Sector: Services & Goods | |
| SubSector: Leisure | |
| MarketCap: 8803.24 Millions | |
| Recent Price: 100.56 Smart Investing & Trading Score: 0 | |
| Day Percent Change: -1.18896% Day Change: -0.87 | |
| Week Change: -3.77954% Year-to-date Change: 1.0% | |
| PLNT Links: Profile News Message Board | |
| Charts:- Daily , Weekly | |
| Add PLNT to Watchlist: View: Get Complete PLNT Trend Analysis ➞ | |
 | TTS Tile Shop Holdings, Inc. |
| Sector: Services & Goods | |
| SubSector: Home Improvement Stores | |
| MarketCap: 938.74 Millions | |
| Recent Price: 1.63 Smart Investing & Trading Score: 0 | |
| Day Percent Change: -1.21212% Day Change: -9999 | |
| Week Change: -89.1261% Year-to-date Change: 0.0% | |
| TTS Links: Profile News Message Board | |
| Charts:- Daily , Weekly | |
| Add TTS to Watchlist: View: Get Complete TTS Trend Analysis ➞ | |
 | JMIA Jumia Technologies Ag ADR |
| Sector: Services & Goods | |
| SubSector: Internet Retail | |
| MarketCap: 1085 Millions | |
| Recent Price: 9.79 Smart Investing & Trading Score: 80 | |
| Day Percent Change: -1.2109% Day Change: -0.08 | |
| Week Change: 10.4966% Year-to-date Change: 151.0% | |
| JMIA Links: Profile News Message Board | |
| Charts:- Daily , Weekly | |
| Add JMIA to Watchlist: View: Get Complete JMIA Trend Analysis ➞ | |
| For tabular summary view of above stock list: Summary View ➞ 0 - 25 , 25 - 50 , 50 - 75 , 75 - 100 , 100 - 125 , 125 - 150 , 150 - 175 , 175 - 200 , 200 - 225 , 225 - 250 , 250 - 275 , 275 - 300 , 300 - 325 , 325 - 350 , 350 - 375 , 375 - 400 , 400 - 425 , 425 - 450 , 450 - 475 , 475 - 500 , 500 - 525 , 525 - 550 , 550 - 575 , 575 - 600 , 600 - 625 | ||
| Click To Change The Sort Order: By Market Cap or Company Size Performance: Year-to-date, Week and Day | |
| Select Chart Type: | ||
|
Best Stocks Today 12Stocks.com |
© 2025 12Stocks.com Terms & Conditions Privacy Contact Us
All Information Provided Only For Education And Not To Be Used For Investing or Trading. See Terms & Conditions


One More Thing ... Get Best Stocks Delivered Daily!
Never Ever Miss A Move With Our Top Ten Stocks Lists
Find Best Stocks In Any Market - Bull or Bear Market
Take A Peek At Our Top Ten Stocks Lists: Daily, Weekly, Year-to-Date & Top Trends
Find Best Stocks In Any Market - Bull or Bear Market
Take A Peek At Our Top Ten Stocks Lists: Daily, Weekly, Year-to-Date & Top Trends
Consumer Services Stocks With Best Up Trends [0-bearish to 100-bullish]: Whole Foods[100], Net 1[100], LiveWire [100], Denny's Corp[100], Ermenegildo Zegna[100], Revolve [100], Therealreal [100], Carters [100], Resources Connection[100], Sally Beauty[100], Advance Auto[100]
Best Consumer Services Stocks Year-to-Date:
WW [1871.33%], Nova Lifestyle[690.41%], ThredUp [665.957%], Lucid [554.785%], Vroom [455.146%], China Yuchai[297.742%], Luxottica [210.802%], Cooper-Standard [190.99%], Masterbeef [156.098%], Jumia Technologies[151.026%], Niu Technologies[136.782%] Best Consumer Services Stocks This Week:
Party City[37593.9%], Companhia Brasileira[18587.4%], Conn s[16420.1%], Rite Aid[10214.6%], Arctic Cat[2387.5%], Chico s[2120.53%], Multi-Color [2063.68%], Reis [1734.59%], Quotient Technology[954.386%], Express [946.725%], Volt Information[705.085%] Best Consumer Services Stocks Daily:
Container Store[22.6852%], SUPERVALU [20.4138%], Irobot Corp[15.4971%], World Wrestling[14.734%], Global Sources[13.1016%], Masterbeef [12.2995%], Whole Foods[11.8363%], iClick Interactive[10%], Net 1[9.46197%], LiveWire [9.09091%], Peloton Interactive[8.17942%]