
 Login Sign Up


| |||||
 |  | ||||

| 12Stocks.com Market Intelligence |
Best Consumer Services Stocks
| In a hurry? Services & Goods Stocks: Performance Trends Table, Stock Charts
Sort Consumer Services: Daily, Weekly, Year-to-Date, Market Cap & Trends. Filter Services & Goods stocks list by size: All Large Mid-Range Small |
| 12Stocks.com Consumer Services Stocks Performances & Trends Daily | |||||||||
|
|  The overall Smart Investing & Trading Score is 13 (0-bearish to 100-bullish) which puts Consumer Services sector in short term bearish trend. The Smart Investing & Trading Score from previous trading session is 26 and hence a deterioration of trend.
| ||||||||
Here are the Smart Investing & Trading Scores of the most requested Consumer Services stocks at 12Stocks.com (click stock name for detailed review):
|


| Consider signing up for our daily 12Stocks.com "Best Stocks Newsletter". You will never ever miss a big stock move again! |
| 12Stocks.com: Investing in Consumer Services sector with Stocks | |
|
The following table helps investors and traders sort through current performance and trends (as measured by Smart Investing & Trading Score) of various
stocks in the Consumer Services sector. Quick View: Move mouse or cursor over stock symbol (ticker) to view short-term Technical chart and over stock name to view long term chart. Click on  to add stock symbol to your watchlist and to add stock symbol to your watchlist and  to view watchlist. Click on any ticker or stock name for detailed market intelligence report for that stock. to view watchlist. Click on any ticker or stock name for detailed market intelligence report for that stock. |
12Stocks.com Performance of Stocks in Consumer Services Sector
| Ticker | Stock Name | Watchlist | Category | Recent Price | Smart Investing & Trading Score | Change % | YTD Change% |
| DBI | Designer Brands |   | Apparel | 8.51 | 38 | -0.82 | -3.84% |
| HLT | Hilton Worldwide | | Lodging | 198.82 | 26 | -0.83 | 9.19% |
| YSG | Yatsen Holding | | Specialty Retail | 3.58 | 83 | -0.83 | 389.34% |
| SIX | Six Flags | | Entertainment | 23.58 | 10 | -0.84 | -5.98% |
| MYPS | PLAYSTUDIOS | | Electronic Gaming & Multimedia | 2.34 | 36 | -0.85 | -12.52% |
| DENN | Denny s | | Restaurants | 8.06 | 0 | -0.86 | -25.92% |
| DKS | DICK S | | Retail | 195.22 | 46 | -0.87 | 32.85% |
| HURN | Huron Consulting | | Services | 90.44 | 0 | -0.88 | -12.02% |
| WING | Wingstop | | Restaurants | 356.40 | 46 | -0.88 | 38.90% |
| KMX | CarMax | | Automobile | 67.91 | 10 | -0.90 | -11.51% |
| MAR | Marriott | | Lodging | 236.30 | 0 | -0.91 | 4.78% |
| CTAS | Cintas | | Services | 662.44 | 34 | -0.91 | 9.92% |
| BATRK | Liberty Braves | | Broadcasting | 37.15 | 0 | -0.93 | -6.14% |
| BARK | BARK | | Specialty Retail | 1.06 | 36 | -0.93 | 32.47% |
| WSM | Williams-Sonoma | | Retail | 279.53 | 41 | -0.94 | 38.53% |
| GPI | 1 | | Automobile | 263.16 | 26 | -0.97 | -13.64% |
| KFRC | Kforce | | Staffing | 62.81 | 10 | -0.98 | -7.03% |
| RBA | Ritchie Bros. | | Services | 72.49 | 36 | -0.98 | 8.37% |
| REZI | Resideo Technologies | | Security | 19.20 | 26 | -0.98 | 2.02% |
| PKOH | Park-Ohio | | Equipment | 23.08 | 0 | -0.99 | -14.39% |
| LPX | Louisiana-Pacific | | Wholesale | 72.02 | 36 | -1.00 | 1.68% |
| EVC | Entravision | | Broadcasting | 1.98 | 32 | -1.00 | -52.52% |
| PDCO | Patterson | | Medical | 25.47 | 18 | -1.01 | -10.47% |
| HTHT | Huazhu | | Lodging | 37.36 | 36 | -1.01 | 11.72% |
| OMC | Omnicom | | Advertising | 91.50 | 68 | -1.03 | 5.77% |
| For chart view version of above stock list: Chart View ➞ 0 - 25 , 25 - 50 , 50 - 75 , 75 - 100 , 100 - 125 , 125 - 150 , 150 - 175 , 175 - 200 , 200 - 225 , 225 - 250 , 250 - 275 , 275 - 300 , 300 - 325 , 325 - 350 , 350 - 375 , 375 - 400 , 400 - 425 , 425 - 450 , 450 - 475 | ||
 | Click To Change The Sort Order: By Market Cap or Company Size Performance: Year-to-date, Week and Day |  |
|
Get the most comprehensive stock market coverage daily at 12Stocks.com ➞ Best Stocks Today ➞ Best Stocks Weekly ➞ Best Stocks Year-to-Date ➞ Best Stocks Trends ➞  Best Stocks Today 12Stocks.com Best Nasdaq Stocks ➞ Best S&P 500 Stocks ➞ Best Tech Stocks ➞ Best Biotech Stocks ➞ |
| Detailed Overview of Consumer Services Stocks |
| Consumer Services Technical Overview, Leaders & Laggards, Top Consumer Services ETF Funds & Detailed Consumer Services Stocks List, Charts, Trends & More |
| Consumer Services Sector: Technical Analysis, Trends & YTD Performance | |
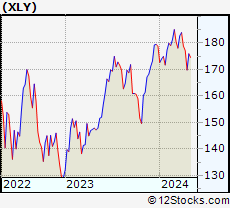
| Consumer Services sector is composed of stocks
from retail, entertainment, media/publishing, consumer goods
and services subsectors. Consumer Services sector, as represented by XLY, an exchange-traded fund [ETF] that holds basket of Consumer Services stocks (e.g, Walmart, Alibaba) is down by -4.22% and is currently underperforming the overall market by -8.41% year-to-date. Below is a quick view of Technical charts and trends: |
|
 XLY Weekly Chart |
|
| Long Term Trend: Good | |
| Medium Term Trend: Not Good | |
 XLY Daily Chart |
|
| Short Term Trend: Not Good | |
| Overall Trend Score: 13 | |
| YTD Performance: -4.22% | |
| **Trend Scores & Views Are Only For Educational Purposes And Not For Investing | |
| 12Stocks.com: Top Performing Consumer Services Sector Stocks | ||||||||||||||||||||||||||||||||||||||||||||||||
 The top performing Consumer Services sector stocks year to date are
Now, more recently, over last week, the top performing Consumer Services sector stocks on the move are


|
||||||||||||||||||||||||||||||||||||||||||||||||
| 12Stocks.com: Investing in Consumer Services Sector using Exchange Traded Funds | |
|
The following table shows list of key exchange traded funds (ETF) that
help investors track Consumer Services Index. For detailed view, check out our ETF Funds section of our website. Quick View: Move mouse or cursor over ETF symbol (ticker) to view short-term Technical chart and over ETF name to view long term chart. Click on ticker or stock name for detailed view. Click on to add stock symbol to your watchlist and to view watchlist. |
12Stocks.com List of ETFs that track Consumer Services Index
| Ticker | ETF Name | Watchlist | Recent Price | Smart Investing & Trading Score | Change % | Week % | Year-to-date % |
| XLY | Consumer Discret Sel | | 171.26 | 13 | -0.62 | -3.3 | -4.22% |
| RTH | Retail | | 198.63 | 44 | -0.20 | -1.52 | 5.53% |
| IYC | Consumer Services | | 77.06 | 36 | -0.49 | -2.69 | 1.7% |
| XRT | Retail | | 70.69 | 51 | 0.04 | -1.66 | -2.25% |
| IYK | Consumer Goods | | 64.97 | 40 | 0.70 | 1.26 | 1.67% |
| UCC | Consumer Services | | 32.64 | 53 | -0.37 | -5.19 | -9.1% |
| RETL | Retail Bull 3X | | 7.95 | 41 | -0.25 | -5.47 | -12.83% |
| RXI | Globl Consumer Discretionary | | 157.45 | 36 | -0.10 | -2.08 | -1.01% |
| SCC | Short Consumer Services | | 16.60 | 74 | 0.97 | 6.64 | 8.33% |
| UGE | Consumer Goods | | 16.26 | 73 | 0.81 | 0.44 | 3.3% |
| 12Stocks.com: Charts, Trends, Fundamental Data and Performances of Consumer Services Stocks | |
|
We now take in-depth look at all Consumer Services stocks including charts, multi-period performances and overall trends (as measured by Smart Investing & Trading Score). One can sort Consumer Services stocks (click link to choose) by Daily, Weekly and by Year-to-Date performances. Also, one can sort by size of the company or by market capitalization. |
| Select Your Default Chart Type: | |||||
| |||||
| Click on stock symbol or name for detailed view. Click on to add stock symbol to your watchlist and to view watchlist. Quick View: Move mouse or cursor over "Daily" to quickly view daily Technical stock chart and over "Weekly" to view weekly Technical stock chart. | |||||

 | DBI Designer Brands Inc. |
| Sector: Services & Goods | |
| SubSector: Apparel Stores | |
| MarketCap: 467.308 Millions | |
| Recent Price: 8.51 Smart Investing & Trading Score: 38 | |
| Day Percent Change: -0.82% Day Change: -0.07 | |
| Week Change: 2.65% Year-to-date Change: -3.8% | |
| DBI Links: Profile News Message Board | |
| Charts:- Daily , Weekly | |
| Add DBI to Watchlist: View: Get Complete DBI Trend Analysis ➞ | |
 | HLT Hilton Worldwide Holdings Inc. |
| Sector: Services & Goods | |
| SubSector: Lodging | |
| MarketCap: 18064.6 Millions | |
| Recent Price: 198.82 Smart Investing & Trading Score: 26 | |
| Day Percent Change: -0.83% Day Change: -1.66 | |
| Week Change: -3.06% Year-to-date Change: 9.2% | |
| HLT Links: Profile News Message Board | |
| Charts:- Daily , Weekly | |
| Add HLT to Watchlist: View: Get Complete HLT Trend Analysis ➞ | |
 | YSG Yatsen Holding Limited |
| Sector: Services & Goods | |
| SubSector: Specialty Retail | |
| MarketCap: 11827 Millions | |
| Recent Price: 3.58 Smart Investing & Trading Score: 83 | |
| Day Percent Change: -0.83% Day Change: -0.03 | |
| Week Change: 18.94% Year-to-date Change: 389.3% | |
| YSG Links: Profile News Message Board | |
| Charts:- Daily , Weekly | |
| Add YSG to Watchlist: View: Get Complete YSG Trend Analysis ➞ | |
 | SIX Six Flags Entertainment Corporation |
| Sector: Services & Goods | |
| SubSector: General Entertainment | |
| MarketCap: 1282.69 Millions | |
| Recent Price: 23.58 Smart Investing & Trading Score: 10 | |
| Day Percent Change: -0.84% Day Change: -0.20 | |
| Week Change: -1.79% Year-to-date Change: -6.0% | |
| SIX Links: Profile News Message Board | |
| Charts:- Daily , Weekly | |
| Add SIX to Watchlist: View: Get Complete SIX Trend Analysis ➞ | |
 | MYPS PLAYSTUDIOS, Inc. |
| Sector: Services & Goods | |
| SubSector: Electronic Gaming & Multimedia | |
| MarketCap: 635 Millions | |
| Recent Price: 2.34 Smart Investing & Trading Score: 36 | |
| Day Percent Change: -0.85% Day Change: -0.02 | |
| Week Change: -10.34% Year-to-date Change: -12.5% | |
| MYPS Links: Profile News Message Board | |
| Charts:- Daily , Weekly | |
| Add MYPS to Watchlist: View: Get Complete MYPS Trend Analysis ➞ | |
 | DENN Denny s Corporation |
| Sector: Services & Goods | |
| SubSector: Restaurants | |
| MarketCap: 367.47 Millions | |
| Recent Price: 8.06 Smart Investing & Trading Score: 0 | |
| Day Percent Change: -0.86% Day Change: -0.07 | |
| Week Change: -4.16% Year-to-date Change: -25.9% | |
| DENN Links: Profile News Message Board | |
| Charts:- Daily , Weekly | |
| Add DENN to Watchlist: View: Get Complete DENN Trend Analysis ➞ | |
 | DKS DICK S Sporting Goods, Inc. |
| Sector: Services & Goods | |
| SubSector: Sporting Goods Stores | |
| MarketCap: 1672.04 Millions | |
| Recent Price: 195.22 Smart Investing & Trading Score: 46 | |
| Day Percent Change: -0.87% Day Change: -1.71 | |
| Week Change: -3.89% Year-to-date Change: 32.9% | |
| DKS Links: Profile News Message Board | |
| Charts:- Daily , Weekly | |
| Add DKS to Watchlist: View: Get Complete DKS Trend Analysis ➞ | |
 | HURN Huron Consulting Group Inc. |
| Sector: Services & Goods | |
| SubSector: Management Services | |
| MarketCap: 968.645 Millions | |
| Recent Price: 90.44 Smart Investing & Trading Score: 0 | |
| Day Percent Change: -0.88% Day Change: -0.80 | |
| Week Change: -2.11% Year-to-date Change: -12.0% | |
| HURN Links: Profile News Message Board | |
| Charts:- Daily , Weekly | |
| Add HURN to Watchlist: View: Get Complete HURN Trend Analysis ➞ | |
 | WING Wingstop Inc. |
| Sector: Services & Goods | |
| SubSector: Restaurants | |
| MarketCap: 1744.7 Millions | |
| Recent Price: 356.40 Smart Investing & Trading Score: 46 | |
| Day Percent Change: -0.88% Day Change: -3.17 | |
| Week Change: -2.4% Year-to-date Change: 38.9% | |
| WING Links: Profile News Message Board | |
| Charts:- Daily , Weekly | |
| Add WING to Watchlist: View: Get Complete WING Trend Analysis ➞ | |
 | KMX CarMax, Inc. |
| Sector: Services & Goods | |
| SubSector: Auto Dealerships | |
| MarketCap: 8121.71 Millions | |
| Recent Price: 67.91 Smart Investing & Trading Score: 10 | |
| Day Percent Change: -0.90% Day Change: -0.62 | |
| Week Change: -4.9% Year-to-date Change: -11.5% | |
| KMX Links: Profile News Message Board | |
| Charts:- Daily , Weekly | |
| Add KMX to Watchlist: View: Get Complete KMX Trend Analysis ➞ | |
 | MAR Marriott International, Inc. |
| Sector: Services & Goods | |
| SubSector: Lodging | |
| MarketCap: 25831.6 Millions | |
| Recent Price: 236.30 Smart Investing & Trading Score: 0 | |
| Day Percent Change: -0.91% Day Change: -2.16 | |
| Week Change: -5.88% Year-to-date Change: 4.8% | |
| MAR Links: Profile News Message Board | |
| Charts:- Daily , Weekly | |
| Add MAR to Watchlist: View: Get Complete MAR Trend Analysis ➞ | |
 | CTAS Cintas Corporation |
| Sector: Services & Goods | |
| SubSector: Business Services | |
| MarketCap: 20154.6 Millions | |
| Recent Price: 662.44 Smart Investing & Trading Score: 34 | |
| Day Percent Change: -0.91% Day Change: -6.07 | |
| Week Change: -0.89% Year-to-date Change: 9.9% | |
| CTAS Links: Profile News Message Board | |
| Charts:- Daily , Weekly | |
| Add CTAS to Watchlist: View: Get Complete CTAS Trend Analysis ➞ | |
 | BATRK The Liberty Braves Group |
| Sector: Services & Goods | |
| SubSector: Broadcasting - TV | |
| MarketCap: 638.363 Millions | |
| Recent Price: 37.15 Smart Investing & Trading Score: 0 | |
| Day Percent Change: -0.93% Day Change: -0.35 | |
| Week Change: -3.58% Year-to-date Change: -6.1% | |
| BATRK Links: Profile News Message Board | |
| Charts:- Daily , Weekly | |
| Add BATRK to Watchlist: View: Get Complete BATRK Trend Analysis ➞ | |
 | BARK BARK, Inc. |
| Sector: Services & Goods | |
| SubSector: Specialty Retail | |
| MarketCap: 234 Millions | |
| Recent Price: 1.06 Smart Investing & Trading Score: 36 | |
| Day Percent Change: -0.93% Day Change: -0.01 | |
| Week Change: -3.64% Year-to-date Change: 32.5% | |
| BARK Links: Profile News Message Board | |
| Charts:- Daily , Weekly | |
| Add BARK to Watchlist: View: Get Complete BARK Trend Analysis ➞ | |
 | WSM Williams-Sonoma, Inc. |
| Sector: Services & Goods | |
| SubSector: Home Furnishing Stores | |
| MarketCap: 3370.05 Millions | |
| Recent Price: 279.53 Smart Investing & Trading Score: 41 | |
| Day Percent Change: -0.94% Day Change: -2.64 | |
| Week Change: -3.23% Year-to-date Change: 38.5% | |
| WSM Links: Profile News Message Board | |
| Charts:- Daily , Weekly | |
| Add WSM to Watchlist: View: Get Complete WSM Trend Analysis ➞ | |
 | GPI Group 1 Automotive, Inc. |
| Sector: Services & Goods | |
| SubSector: Auto Dealerships | |
| MarketCap: 921.021 Millions | |
| Recent Price: 263.16 Smart Investing & Trading Score: 26 | |
| Day Percent Change: -0.97% Day Change: -2.58 | |
| Week Change: -2.33% Year-to-date Change: -13.6% | |
| GPI Links: Profile News Message Board | |
| Charts:- Daily , Weekly | |
| Add GPI to Watchlist: View: Get Complete GPI Trend Analysis ➞ | |
 | KFRC Kforce Inc. |
| Sector: Services & Goods | |
| SubSector: Staffing & Outsourcing Services | |
| MarketCap: 622.828 Millions | |
| Recent Price: 62.81 Smart Investing & Trading Score: 10 | |
| Day Percent Change: -0.98% Day Change: -0.62 | |
| Week Change: -3.16% Year-to-date Change: -7.0% | |
| KFRC Links: Profile News Message Board | |
| Charts:- Daily , Weekly | |
| Add KFRC to Watchlist: View: Get Complete KFRC Trend Analysis ➞ | |
 | RBA Ritchie Bros. Auctioneers Incorporated |
| Sector: Services & Goods | |
| SubSector: Business Services | |
| MarketCap: 3491.02 Millions | |
| Recent Price: 72.49 Smart Investing & Trading Score: 36 | |
| Day Percent Change: -0.98% Day Change: -0.72 | |
| Week Change: -1.13% Year-to-date Change: 8.4% | |
| RBA Links: Profile News Message Board | |
| Charts:- Daily , Weekly | |
| Add RBA to Watchlist: View: Get Complete RBA Trend Analysis ➞ | |
 | REZI Resideo Technologies, Inc. |
| Sector: Services & Goods | |
| SubSector: Security & Protection Services | |
| MarketCap: 712.603 Millions | |
| Recent Price: 19.20 Smart Investing & Trading Score: 26 | |
| Day Percent Change: -0.98% Day Change: -0.19 | |
| Week Change: -8.92% Year-to-date Change: 2.0% | |
| REZI Links: Profile News Message Board | |
| Charts:- Daily , Weekly | |
| Add REZI to Watchlist: View: Get Complete REZI Trend Analysis ➞ | |
 | PKOH Park-Ohio Holdings Corp. |
| Sector: Services & Goods | |
| SubSector: Industrial Equipment Wholesale | |
| MarketCap: 214.358 Millions | |
| Recent Price: 23.08 Smart Investing & Trading Score: 0 | |
| Day Percent Change: -0.99% Day Change: -0.23 | |
| Week Change: -8.67% Year-to-date Change: -14.4% | |
| PKOH Links: Profile News Message Board | |
| Charts:- Daily , Weekly | |
| Add PKOH to Watchlist: View: Get Complete PKOH Trend Analysis ➞ | |
 | LPX Louisiana-Pacific Corporation |
| Sector: Services & Goods | |
| SubSector: Building Materials Wholesale | |
| MarketCap: 1943.43 Millions | |
| Recent Price: 72.02 Smart Investing & Trading Score: 36 | |
| Day Percent Change: -1.00% Day Change: -0.73 | |
| Week Change: -6.19% Year-to-date Change: 1.7% | |
| LPX Links: Profile News Message Board | |
| Charts:- Daily , Weekly | |
| Add LPX to Watchlist: View: Get Complete LPX Trend Analysis ➞ | |
 | EVC Entravision Communications Corporation |
| Sector: Services & Goods | |
| SubSector: Broadcasting - TV | |
| MarketCap: 171.763 Millions | |
| Recent Price: 1.98 Smart Investing & Trading Score: 32 | |
| Day Percent Change: -1.00% Day Change: -0.02 | |
| Week Change: -3.88% Year-to-date Change: -52.5% | |
| EVC Links: Profile News Message Board | |
| Charts:- Daily , Weekly | |
| Add EVC to Watchlist: View: Get Complete EVC Trend Analysis ➞ | |
 | PDCO Patterson Companies, Inc. |
| Sector: Services & Goods | |
| SubSector: Medical Equipment Wholesale | |
| MarketCap: 1672.2 Millions | |
| Recent Price: 25.47 Smart Investing & Trading Score: 18 | |
| Day Percent Change: -1.01% Day Change: -0.26 | |
| Week Change: 0.04% Year-to-date Change: -10.5% | |
| PDCO Links: Profile News Message Board | |
| Charts:- Daily , Weekly | |
| Add PDCO to Watchlist: View: Get Complete PDCO Trend Analysis ➞ | |
 | HTHT Huazhu Group Limited |
| Sector: Services & Goods | |
| SubSector: Lodging | |
| MarketCap: 9164.46 Millions | |
| Recent Price: 37.36 Smart Investing & Trading Score: 36 | |
| Day Percent Change: -1.01% Day Change: -0.38 | |
| Week Change: -0.32% Year-to-date Change: 11.7% | |
| HTHT Links: Profile News Message Board | |
| Charts:- Daily , Weekly | |
| Add HTHT to Watchlist: View: Get Complete HTHT Trend Analysis ➞ | |
 | OMC Omnicom Group Inc. |
| Sector: Services & Goods | |
| SubSector: Advertising Agencies | |
| MarketCap: 11813.5 Millions | |
| Recent Price: 91.50 Smart Investing & Trading Score: 68 | |
| Day Percent Change: -1.03% Day Change: -0.95 | |
| Week Change: 1% Year-to-date Change: 5.8% | |
| OMC Links: Profile News Message Board | |
| Charts:- Daily , Weekly | |
| Add OMC to Watchlist: View: Get Complete OMC Trend Analysis ➞ | |
| For tabular summary view of above stock list: Summary View ➞ 0 - 25 , 25 - 50 , 50 - 75 , 75 - 100 , 100 - 125 , 125 - 150 , 150 - 175 , 175 - 200 , 200 - 225 , 225 - 250 , 250 - 275 , 275 - 300 , 300 - 325 , 325 - 350 , 350 - 375 , 375 - 400 , 400 - 425 , 425 - 450 , 450 - 475 | ||
| Click To Change The Sort Order: By Market Cap or Company Size Performance: Year-to-date, Week and Day | |
| Select Chart Type: | ||
|
Best Stocks Today 12Stocks.com |
© 2024 12Stocks.com Terms & Conditions Privacy Contact Us
All Information Provided Only For Education And Not To Be Used For Investing or Trading. See Terms & Conditions


One More Thing ... Get Best Stocks Delivered Daily!
Never Ever Miss A Move With Our Top Ten Stocks Lists
Find Best Stocks In Any Market - Bull or Bear Market
Take A Peek At Our Top Ten Stocks Lists: Daily, Weekly, Year-to-Date & Top Trends
Find Best Stocks In Any Market - Bull or Bear Market
Take A Peek At Our Top Ten Stocks Lists: Daily, Weekly, Year-to-Date & Top Trends
Consumer Services Stocks With Best Up Trends [0-bearish to 100-bullish]: Genuine Parts[100], IMAX [100], Envestnet [100], Smart Share[93], MYT Netherlands[93], Gannett Co[93], TAL Education[90], Outbrain [90], Winmark [90], Coupang [90], Fluent [88]
Best Consumer Services Stocks Year-to-Date:
U Power[2874.33%], Vroom [1729.11%], Yatsen Holding[389.34%], Fluent [305.97%], Codere Online[139.04%], Research[100.81%], Sweetgreen [84.42%], RealReal [56.72%], Spotify Technology[53.9%], PaySign [53.21%], Bright Scholar[50.4%] Best Consumer Services Stocks This Week:
Yatsen Holding[18.94%], TH [18.18%], ContextLogic [15%], Secoo Holding[11.83%], Genuine Parts[10.21%], AMC Entertainment[10.19%], Smart Share[9.93%], Research[9.75%], Advance Auto[9.5%], Envestnet [8.59%], Children s[7.99%] Best Consumer Services Stocks Daily:
TH [25.00%], Golden Heaven[21.20%], ContextLogic [15.81%], Fluent [12.40%], Genuine Parts[11.22%], Gaia [9.86%], Research[9.75%], Secoo Holding[9.32%], Faraday Future[9.30%], U Power[8.11%], Big Lots[6.71%]