
 Login Sign Up


| |||||
 |  | ||||

| 12Stocks.com Market Intelligence |
Best Consumer Services Stocks
| In a hurry? Services & Goods Stocks: Performance Trends Table, Stock Charts
Sort Consumer Services: Daily, Weekly, Year-to-Date, Market Cap & Trends. Filter Services & Goods stocks list by size: All Large Mid-Range Small |
| 12Stocks.com Consumer Services Stocks Performances & Trends Daily | |||||||||
|
|  The overall Smart Investing & Trading Score is 100 (0-bearish to 100-bullish) which puts Consumer Services sector in short term bullish trend. The Smart Investing & Trading Score from previous trading session is 50 and an improvement of trend continues.
| ||||||||
Here are the Smart Investing & Trading Scores of the most requested Consumer Services stocks at 12Stocks.com (click stock name for detailed review):
|


| Consider signing up for our daily 12Stocks.com "Best Stocks Newsletter". You will never ever miss a big stock move again! |
| 12Stocks.com: Investing in Consumer Services sector with Stocks | |
|
The following table helps investors and traders sort through current performance and trends (as measured by Smart Investing & Trading Score) of various
stocks in the Consumer Services sector. Quick View: Move mouse or cursor over stock symbol (ticker) to view short-term Technical chart and over stock name to view long term chart. Click on  to add stock symbol to your watchlist and to add stock symbol to your watchlist and  to view watchlist. Click on any ticker or stock name for detailed market intelligence report for that stock. to view watchlist. Click on any ticker or stock name for detailed market intelligence report for that stock. |
12Stocks.com Performance of Stocks in Consumer Services Sector
| Ticker | Stock Name | Watchlist | Category | Recent Price | Smart Investing & Trading Score | Change % | YTD Change% |
| YUMC | Yum China |   | Restaurants | 43.97 | 0 | -2.55% | -4.64% |
| QRTEA | Qurate Retail | | Retail | 0.36 | 20 | -0.33% | -4.85% |
| FWRG | First Watch | | Restaurants | 17.02 | 68 | 0.98% | -5.43% |
| CBRL | Cracker Barrel | | Restaurants | 51.17 | 40 | -1.84% | -5.45% |
| YETI | YETI | | Leisure | 35.46 | 50 | -3.19% | -5.49% |
| ODP | ODP | | Specialty Retail | 20.73 | 70 | -2.68% | -5.77% |
| SKX | Skechers U | | Footwear & Accessories | 63.13 | 50 | -0.11% | -6.18% |
| EDR | Endeavor | | Entertainment | 29.25 | 50 | 1.46% | -6.25% |
| BBBY | Bed Bath | | Internet Retail | 10.39 | 20 | -1.70% | -6.48% |
| VVI | Viad Corp | | Services | 38.91 | 30 | -0.13% | -6.53% |
| BURL | Burlington Stores | | Apparel Retail | 266.91 | 20 | -4.42% | -6.61% |
| ABNB | Airbnb | | Travel Services | 122.55 | 0 | -0.41% | -6.79% |
| FOXF | Fox Factory | | Auto Parts | 27.25 | 20 | -5.41% | -6.96% |
| ONEW | Onewater Marine | | Specialty Retail | 15.96 | 50 | -3.56% | -7.05% |
| HNI | HNI Corp | | Furnishings, Fixtures & Appliances | 45.24 | 40 | -1.72% | -7.14% |
| FLXS | Flexsteel Industries | | Furnishings, Fixtures & Appliances | 48.94 | 90 | -1.22% | -7.14% |
| TXRH | Texas Roadhouse | | Restaurants | 166.69 | 10 | -0.28% | -7.32% |
| HZO | Marinemax | | Specialty Retail | 25.92 | 50 | -2.88% | -7.46% |
| H | Hyatt Hotels | | Lodging | 143.44 | 50 | -1.63% | -8.03% |
| ARCO | Arcos Dorados | | Restaurants | 6.79 | 20 | -3.69% | -8.07% |
| AVY | Avery Dennison | | Packaging | 165.65 | 40 | -1.72% | -8.72% |
| WING | Wingstop | | Restaurants | 266.02 | 0 | -3.16% | -8.72% |
| RIVN | Rivian Automotive | | Auto Manufacturers | 13.46 | 10 | 0.41% | -8.87% |
| AMCR | Amcor | | Packaging | 8.28 | 40 | -0.60% | -9.07% |
| FND | Floor & Decor | | Home Improvement Retail | 88.68 | 100 | -1.92% | -9.07% |
| For chart view version of above stock list: Chart View ➞ 0 - 25 , 25 - 50 , 50 - 75 , 75 - 100 , 100 - 125 , 125 - 150 , 150 - 175 , 175 - 200 , 200 - 225 , 225 - 250 , 250 - 275 , 275 - 300 , 300 - 325 , 325 - 350 , 350 - 375 , 375 - 400 , 400 - 425 , 425 - 450 , 450 - 475 , 475 - 500 , 500 - 525 , 525 - 550 , 550 - 575 , 575 - 600 , 600 - 625 | ||
 | Click To Change The Sort Order: By Market Cap or Company Size Performance: Year-to-date, Week and Day |  |
|
Get the most comprehensive stock market coverage daily at 12Stocks.com ➞ Best Stocks Today ➞ Best Stocks Weekly ➞ Best Stocks Year-to-Date ➞ Best Stocks Trends ➞  Best Stocks Today 12Stocks.com Best Nasdaq Stocks ➞ Best S&P 500 Stocks ➞ Best Tech Stocks ➞ Best Biotech Stocks ➞ |
| Detailed Overview of Consumer Services Stocks |
| Consumer Services Technical Overview, Leaders & Laggards, Top Consumer Services ETF Funds & Detailed Consumer Services Stocks List, Charts, Trends & More |
| Consumer Services Sector: Technical Analysis, Trends & YTD Performance | |
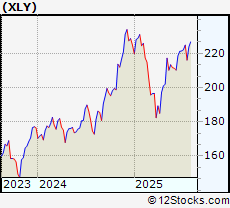
| Consumer Services sector is composed of stocks
from retail, entertainment, media/publishing, consumer goods
and services subsectors. Consumer Services sector, as represented by XLY, an exchange-traded fund [ETF] that holds basket of Consumer Services stocks (e.g, Walmart, Alibaba) is up by 8.30867% and is currently underperforming the overall market by -4.54233% year-to-date. Below is a quick view of Technical charts and trends: |
|
 XLY Weekly Chart |
|
| Long Term Trend: Very Good | |
| Medium Term Trend: Good | |
 XLY Daily Chart |
|
| Short Term Trend: Very Good | |
| Overall Trend Score: 100 | |
| YTD Performance: 8.30867% | |
| **Trend Scores & Views Are Only For Educational Purposes And Not For Investing | |
| 12Stocks.com: Top Performing Consumer Services Sector Stocks | ||||||||||||||||||||||||||||||||||||||||||||||||
 The top performing Consumer Services sector stocks year to date are
Now, more recently, over last week, the top performing Consumer Services sector stocks on the move are


|
||||||||||||||||||||||||||||||||||||||||||||||||
| 12Stocks.com: Investing in Consumer Services Sector using Exchange Traded Funds | |
|
The following table shows list of key exchange traded funds (ETF) that
help investors track Consumer Services Index. For detailed view, check out our ETF Funds section of our website. Quick View: Move mouse or cursor over ETF symbol (ticker) to view short-term Technical chart and over ETF name to view long term chart. Click on ticker or stock name for detailed view. Click on to add stock symbol to your watchlist and to view watchlist. |
12Stocks.com List of ETFs that track Consumer Services Index
| Ticker | ETF Name | Watchlist | Recent Price | Smart Investing & Trading Score | Change % | Week % | Year-to-date % |
| PMR | Retail | | 40.96 | 70 | -0.0244081 | 2.86288 | 0% |
| 12Stocks.com: Charts, Trends, Fundamental Data and Performances of Consumer Services Stocks | |
|
We now take in-depth look at all Consumer Services stocks including charts, multi-period performances and overall trends (as measured by Smart Investing & Trading Score). One can sort Consumer Services stocks (click link to choose) by Daily, Weekly and by Year-to-Date performances. Also, one can sort by size of the company or by market capitalization. |
| Select Your Default Chart Type: | |||||
| |||||
| Click on stock symbol or name for detailed view. Click on to add stock symbol to your watchlist and to view watchlist. Quick View: Move mouse or cursor over "Daily" to quickly view daily Technical stock chart and over "Weekly" to view weekly Technical stock chart. | |||||

 | YUMC Yum China Holdings Inc |
| Sector: Services & Goods | |
| SubSector: Restaurants | |
| MarketCap: 16566.5 Millions | |
| Recent Price: 43.97 Smart Investing & Trading Score: 0 | |
| Day Percent Change: -2.54876% Day Change: 0.48 | |
| Week Change: -1.63311% Year-to-date Change: -4.6% | |
| YUMC Links: Profile News Message Board | |
| Charts:- Daily , Weekly | |
| Add YUMC to Watchlist: View: Get Complete YUMC Trend Analysis ➞ | |
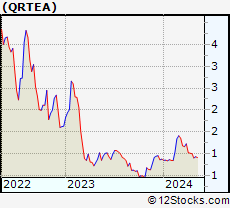 | QRTEA Qurate Retail, Inc. |
| Sector: Services & Goods | |
| SubSector: Specialty Retail, Other | |
| MarketCap: 1980.44 Millions | |
| Recent Price: 0.36 Smart Investing & Trading Score: 20 | |
| Day Percent Change: -0.333333% Day Change: -9999 | |
| Week Change: -1.69863% Year-to-date Change: -4.9% | |
| QRTEA Links: Profile News Message Board | |
| Charts:- Daily , Weekly | |
| Add QRTEA to Watchlist: View: Get Complete QRTEA Trend Analysis ➞ | |
 | FWRG First Watch Restaurant Group Inc |
| Sector: Services & Goods | |
| SubSector: Restaurants | |
| MarketCap: 1134.44 Millions | |
| Recent Price: 17.02 Smart Investing & Trading Score: 68 | |
| Day Percent Change: 0.98% Day Change: 0.17 | |
| Week Change: -1.46% Year-to-date Change: -5.4% | |
| FWRG Links: Profile News Message Board | |
| Charts:- Daily , Weekly | |
| Add FWRG to Watchlist: View: Get Complete FWRG Trend Analysis ➞ | |
 | CBRL Cracker Barrel Old Country Store Inc |
| Sector: Services & Goods | |
| SubSector: Restaurants | |
| MarketCap: 1175.92 Millions | |
| Recent Price: 51.17 Smart Investing & Trading Score: 40 | |
| Day Percent Change: -1.84155% Day Change: -4.22 | |
| Week Change: -1.91681% Year-to-date Change: -5.5% | |
| CBRL Links: Profile News Message Board | |
| Charts:- Daily , Weekly | |
| Add CBRL to Watchlist: View: Get Complete CBRL Trend Analysis ➞ | |
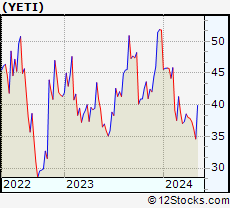 | YETI YETI Holdings Inc |
| Sector: Services & Goods | |
| SubSector: Leisure | |
| MarketCap: 2949.25 Millions | |
| Recent Price: 35.46 Smart Investing & Trading Score: 50 | |
| Day Percent Change: -3.1941% Day Change: -0.9 | |
| Week Change: -2.07125% Year-to-date Change: -5.5% | |
| YETI Links: Profile News Message Board | |
| Charts:- Daily , Weekly | |
| Add YETI to Watchlist: View: Get Complete YETI Trend Analysis ➞ | |
 | ODP ODP Corporation |
| Sector: Services & Goods | |
| SubSector: Specialty Retail | |
| MarketCap: 668.17 Millions | |
| Recent Price: 20.73 Smart Investing & Trading Score: 70 | |
| Day Percent Change: -2.67606% Day Change: -0.53 | |
| Week Change: -2.72173% Year-to-date Change: -5.8% | |
| ODP Links: Profile News Message Board | |
| Charts:- Daily , Weekly | |
| Add ODP to Watchlist: View: Get Complete ODP Trend Analysis ➞ | |
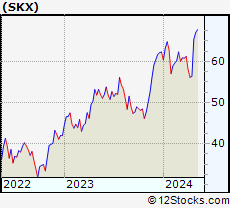 | SKX Skechers U S A, Inc |
| Sector: Services & Goods | |
| SubSector: Footwear & Accessories | |
| MarketCap: 9500.45 Millions | |
| Recent Price: 63.13 Smart Investing & Trading Score: 50 | |
| Day Percent Change: -0.110759% Day Change: -0.07 | |
| Week Change: -0.0949517% Year-to-date Change: -6.2% | |
| SKX Links: Profile News Message Board | |
| Charts:- Daily , Weekly | |
| Add SKX to Watchlist: View: Get Complete SKX Trend Analysis ➞ | |
 | EDR Endeavor Group Holdings, Inc. |
| Sector: Services & Goods | |
| SubSector: Entertainment | |
| MarketCap: 11310 Millions | |
| Recent Price: 29.25 Smart Investing & Trading Score: 50 | |
| Day Percent Change: 1.45682% Day Change: -9999 | |
| Week Change: 1.38648% Year-to-date Change: -6.2% | |
| EDR Links: Profile News Message Board | |
| Charts:- Daily , Weekly | |
| Add EDR to Watchlist: View: Get Complete EDR Trend Analysis ➞ | |
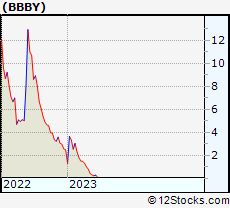 | BBBY Bed Bath & Beyond Inc |
| Sector: Services & Goods | |
| SubSector: Internet Retail | |
| MarketCap: 567.17 Millions | |
| Recent Price: 10.39 Smart Investing & Trading Score: 20 | |
| Day Percent Change: -1.70293% Day Change: -9999 | |
| Week Change: -81.0781% Year-to-date Change: -6.5% | |
| BBBY Links: Profile News Message Board | |
| Charts:- Daily , Weekly | |
| Add BBBY to Watchlist: View: Get Complete BBBY Trend Analysis ➞ | |
 | VVI Viad Corp |
| Sector: Services & Goods | |
| SubSector: Business Services | |
| MarketCap: 270.682 Millions | |
| Recent Price: 38.91 Smart Investing & Trading Score: 30 | |
| Day Percent Change: -0.128337% Day Change: -9999 | |
| Week Change: 1.51318% Year-to-date Change: -6.5% | |
| VVI Links: Profile News Message Board | |
| Charts:- Daily , Weekly | |
| Add VVI to Watchlist: View: Get Complete VVI Trend Analysis ➞ | |
 | BURL Burlington Stores Inc |
| Sector: Services & Goods | |
| SubSector: Apparel Retail | |
| MarketCap: 18355.8 Millions | |
| Recent Price: 266.91 Smart Investing & Trading Score: 20 | |
| Day Percent Change: -4.4224% Day Change: -12.71 | |
| Week Change: -11.4286% Year-to-date Change: -6.6% | |
| BURL Links: Profile News Message Board | |
| Charts:- Daily , Weekly | |
| Add BURL to Watchlist: View: Get Complete BURL Trend Analysis ➞ | |
 | ABNB Airbnb Inc |
| Sector: Services & Goods | |
| SubSector: Travel Services | |
| MarketCap: 76940 Millions | |
| Recent Price: 122.55 Smart Investing & Trading Score: 0 | |
| Day Percent Change: -0.406339% Day Change: -0.38 | |
| Week Change: -2.24934% Year-to-date Change: -6.8% | |
| ABNB Links: Profile News Message Board | |
| Charts:- Daily , Weekly | |
| Add ABNB to Watchlist: View: Get Complete ABNB Trend Analysis ➞ | |
 | FOXF Fox Factory Holding Corp |
| Sector: Services & Goods | |
| SubSector: Auto Parts | |
| MarketCap: 1221.83 Millions | |
| Recent Price: 27.25 Smart Investing & Trading Score: 20 | |
| Day Percent Change: -5.41479% Day Change: -0.53 | |
| Week Change: -3.81221% Year-to-date Change: -7.0% | |
| FOXF Links: Profile News Message Board | |
| Charts:- Daily , Weekly | |
| Add FOXF to Watchlist: View: Get Complete FOXF Trend Analysis ➞ | |
 | ONEW Onewater Marine Inc |
| Sector: Services & Goods | |
| SubSector: Specialty Retail | |
| MarketCap: 275.35 Millions | |
| Recent Price: 15.96 Smart Investing & Trading Score: 50 | |
| Day Percent Change: -3.56495% Day Change: 0.2 | |
| Week Change: -2.14592% Year-to-date Change: -7.0% | |
| ONEW Links: Profile News Message Board | |
| Charts:- Daily , Weekly | |
| Add ONEW to Watchlist: View: Get Complete ONEW Trend Analysis ➞ | |
 | HNI HNI Corp |
| Sector: Services & Goods | |
| SubSector: Furnishings, Fixtures & Appliances | |
| MarketCap: 2141.66 Millions | |
| Recent Price: 45.24 Smart Investing & Trading Score: 40 | |
| Day Percent Change: -1.71627% Day Change: -0.54 | |
| Week Change: -2.14147% Year-to-date Change: -7.1% | |
| HNI Links: Profile News Message Board | |
| Charts:- Daily , Weekly | |
| Add HNI to Watchlist: View: Get Complete HNI Trend Analysis ➞ | |
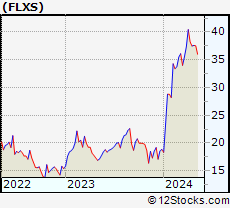 | FLXS Flexsteel Industries, Inc |
| Sector: Services & Goods | |
| SubSector: Furnishings, Fixtures & Appliances | |
| MarketCap: 255.57 Millions | |
| Recent Price: 48.94 Smart Investing & Trading Score: 90 | |
| Day Percent Change: -1.22111% Day Change: 2.19 | |
| Week Change: 4.595% Year-to-date Change: -7.1% | |
| FLXS Links: Profile News Message Board | |
| Charts:- Daily , Weekly | |
| Add FLXS to Watchlist: View: Get Complete FLXS Trend Analysis ➞ | |
 | TXRH Texas Roadhouse Inc |
| Sector: Services & Goods | |
| SubSector: Restaurants | |
| MarketCap: 11220.2 Millions | |
| Recent Price: 166.69 Smart Investing & Trading Score: 10 | |
| Day Percent Change: -0.281168% Day Change: -0.16 | |
| Week Change: -1.58233% Year-to-date Change: -7.3% | |
| TXRH Links: Profile News Message Board | |
| Charts:- Daily , Weekly | |
| Add TXRH to Watchlist: View: Get Complete TXRH Trend Analysis ➞ | |
 | HZO Marinemax, Inc |
| Sector: Services & Goods | |
| SubSector: Specialty Retail | |
| MarketCap: 567.93 Millions | |
| Recent Price: 25.92 Smart Investing & Trading Score: 50 | |
| Day Percent Change: -2.88498% Day Change: -0.35 | |
| Week Change: -0.727691% Year-to-date Change: -7.5% | |
| HZO Links: Profile News Message Board | |
| Charts:- Daily , Weekly | |
| Add HZO to Watchlist: View: Get Complete HZO Trend Analysis ➞ | |
 | H Hyatt Hotels Corporation |
| Sector: Services & Goods | |
| SubSector: Lodging | |
| MarketCap: 13893.4 Millions | |
| Recent Price: 143.44 Smart Investing & Trading Score: 50 | |
| Day Percent Change: -1.63215% Day Change: -1.93 | |
| Week Change: -1.26652% Year-to-date Change: -8.0% | |
| H Links: Profile News Message Board | |
| Charts:- Daily , Weekly | |
| Add H to Watchlist: View: Get Complete H Trend Analysis ➞ | |
 | ARCO Arcos Dorados Holdings Inc |
| Sector: Services & Goods | |
| SubSector: Restaurants | |
| MarketCap: 1474.64 Millions | |
| Recent Price: 6.79 Smart Investing & Trading Score: 20 | |
| Day Percent Change: -3.68794% Day Change: -0.08 | |
| Week Change: -1.87861% Year-to-date Change: -8.1% | |
| ARCO Links: Profile News Message Board | |
| Charts:- Daily , Weekly | |
| Add ARCO to Watchlist: View: Get Complete ARCO Trend Analysis ➞ | |
 | AVY Avery Dennison Corp |
| Sector: Services & Goods | |
| SubSector: Packaging & Containers | |
| MarketCap: 13105.6 Millions | |
| Recent Price: 165.65 Smart Investing & Trading Score: 40 | |
| Day Percent Change: -1.72056% Day Change: -1.79 | |
| Week Change: -0.826199% Year-to-date Change: -8.7% | |
| AVY Links: Profile News Message Board | |
| Charts:- Daily , Weekly | |
| Add AVY to Watchlist: View: Get Complete AVY Trend Analysis ➞ | |
 | WING Wingstop Inc |
| Sector: Services & Goods | |
| SubSector: Restaurants | |
| MarketCap: 8650.5 Millions | |
| Recent Price: 266.02 Smart Investing & Trading Score: 0 | |
| Day Percent Change: -3.15981% Day Change: -9.7 | |
| Week Change: -13.8592% Year-to-date Change: -8.7% | |
| WING Links: Profile News Message Board | |
| Charts:- Daily , Weekly | |
| Add WING to Watchlist: View: Get Complete WING Trend Analysis ➞ | |
 | RIVN Rivian Automotive Inc |
| Sector: Services & Goods | |
| SubSector: Auto Manufacturers | |
| MarketCap: 17242.9 Millions | |
| Recent Price: 13.46 Smart Investing & Trading Score: 10 | |
| Day Percent Change: 0.41% Day Change: 0.05 | |
| Week Change: 0.5% Year-to-date Change: -8.9% | |
| RIVN Links: Profile News Message Board | |
| Charts:- Daily , Weekly | |
| Add RIVN to Watchlist: View: Get Complete RIVN Trend Analysis ➞ | |
 | AMCR Amcor Plc |
| Sector: Services & Goods | |
| SubSector: Packaging & Containers | |
| MarketCap: 19134.5 Millions | |
| Recent Price: 8.28 Smart Investing & Trading Score: 40 | |
| Day Percent Change: -0.60024% Day Change: -0.01 | |
| Week Change: -0.838323% Year-to-date Change: -9.1% | |
| AMCR Links: Profile News Message Board | |
| Charts:- Daily , Weekly | |
| Add AMCR to Watchlist: View: Get Complete AMCR Trend Analysis ➞ | |
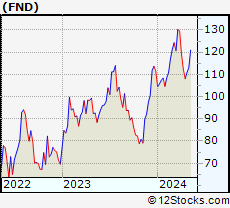 | FND Floor & Decor Holdings Inc |
| Sector: Services & Goods | |
| SubSector: Home Improvement Retail | |
| MarketCap: 9419.77 Millions | |
| Recent Price: 88.68 Smart Investing & Trading Score: 100 | |
| Day Percent Change: -1.92435% Day Change: -1.1 | |
| Week Change: 7.16616% Year-to-date Change: -9.1% | |
| FND Links: Profile News Message Board | |
| Charts:- Daily , Weekly | |
| Add FND to Watchlist: View: Get Complete FND Trend Analysis ➞ | |
| For tabular summary view of above stock list: Summary View ➞ 0 - 25 , 25 - 50 , 50 - 75 , 75 - 100 , 100 - 125 , 125 - 150 , 150 - 175 , 175 - 200 , 200 - 225 , 225 - 250 , 250 - 275 , 275 - 300 , 300 - 325 , 325 - 350 , 350 - 375 , 375 - 400 , 400 - 425 , 425 - 450 , 450 - 475 , 475 - 500 , 500 - 525 , 525 - 550 , 550 - 575 , 575 - 600 , 600 - 625 | ||
| Click To Change The Sort Order: By Market Cap or Company Size Performance: Year-to-date, Week and Day | |
| Select Chart Type: | ||
|
Best Stocks Today 12Stocks.com |
© 2025 12Stocks.com Terms & Conditions Privacy Contact Us
All Information Provided Only For Education And Not To Be Used For Investing or Trading. See Terms & Conditions


One More Thing ... Get Best Stocks Delivered Daily!
Never Ever Miss A Move With Our Top Ten Stocks Lists
Find Best Stocks In Any Market - Bull or Bear Market
Take A Peek At Our Top Ten Stocks Lists: Daily, Weekly, Year-to-Date & Top Trends
Find Best Stocks In Any Market - Bull or Bear Market
Take A Peek At Our Top Ten Stocks Lists: Daily, Weekly, Year-to-Date & Top Trends
Consumer Services Stocks With Best Up Trends [0-bearish to 100-bullish]: QuantumScape Corp[100], Whole Foods[100], Net 1[100], Tesla [100], Baozun [100], Resources Connection[100], KapStone Paper[100], China Yuchai[100], Marine Products[100], Express [100], Madison Square[100]
Best Consumer Services Stocks Year-to-Date:
WW [2086.01%], Nova Lifestyle[681.129%], ThredUp [637.943%], Lucid [536.139%], Vroom [455.146%], China Yuchai[295.103%], Luxottica [210.802%], Cooper-Standard [181.832%], Jumia Technologies[154.103%], Viomi Technology[138.127%], Niu Technologies[132.759%] Best Consumer Services Stocks This Week:
Party City[37593.9%], Companhia Brasileira[18587.4%], Conn s[16420.1%], Rite Aid[10214.6%], Arctic Cat[2387.5%], Chico s[2120.53%], Multi-Color [2063.68%], Reis [1734.59%], Quotient Technology[954.386%], Express [946.725%], Volt Information[705.085%] Best Consumer Services Stocks Daily:
Container Store[22.6852%], SUPERVALU [20.4138%], World Wrestling[14.734%], Global Sources[13.1016%], QuantumScape Corp[12.4294%], Whole Foods[11.8363%], iClick Interactive[10%], Net 1[9.46197%], Six Flags[7.76654%], SES AI[7.75862%], Tesla [7.37507%]