
 Login Sign Up


| |||||
 |  | ||||

| 12Stocks.com Market Intelligence |
Best Consumer Services Stocks
| In a hurry? Services & Goods Stocks: Performance Trends Table, Stock Charts
Sort Consumer Services: Daily, Weekly, Year-to-Date, Market Cap & Trends. Filter Services & Goods stocks list by size: All Large Mid-Range Small |
| 12Stocks.com Consumer Services Stocks Performances & Trends Daily | |||||||||
|
|  The overall Smart Investing & Trading Score is 100 (0-bearish to 100-bullish) which puts Consumer Services sector in short term bullish trend. The Smart Investing & Trading Score from previous trading session is 100 and an improvement of trend continues.
| ||||||||
Here are the Smart Investing & Trading Scores of the most requested Consumer Services stocks at 12Stocks.com (click stock name for detailed review):
|


| Consider signing up for our daily 12Stocks.com "Best Stocks Newsletter". You will never ever miss a big stock move again! |
| 12Stocks.com: Investing in Consumer Services sector with Stocks | |
|
The following table helps investors and traders sort through current performance and trends (as measured by Smart Investing & Trading Score) of various
stocks in the Consumer Services sector. Quick View: Move mouse or cursor over stock symbol (ticker) to view short-term Technical chart and over stock name to view long term chart. Click on  to add stock symbol to your watchlist and to add stock symbol to your watchlist and  to view watchlist. Click on any ticker or stock name for detailed market intelligence report for that stock. to view watchlist. Click on any ticker or stock name for detailed market intelligence report for that stock. |
12Stocks.com Performance of Stocks in Consumer Services Sector
| Ticker | Stock Name | Watchlist | Category | Recent Price | Smart Investing & Trading Score | Change % | YTD Change% |
| ASPS | Altisource Portfolio |   | Services | 10.49 | 40 | -3.61 | 97.94% |
| AAP | Advance Auto | | Auto Parts | 56.84 | 40 | -3.88 | 33.00% |
| FUN | Cedar Fair | | Entertainment | 25.54 | 20 | -4.12 | -45.30% |
| PDD | Pinduoduo | | Retail | 118.95 | 90 | -4.89 | 20.25% |
| NCLH | Norwegian Cruise | | Casinos | 24.30 | 70 | -4.99 | -3.77% |
| MBLY | Mobileye Global | | Auto Parts | 14.01 | 60 | -5.01 | -28.46% |
| CCO | Clear Channel | | Marketing | 1.18 | 80 | -5.13 | -14.60% |
| GDEV | GDEV | | Electronic Gaming & Multimedia | 14.71 | 31 | -5.30 | -6.22% |
| MSC | Studio City | | Casinos | 4.61 | 40 | -6.16 | -17.70% |
| YSG | Yatsen Holding | | Specialty Retail | 9.43 | 50 | -7.46 | 133.67% |
| RERE | ATRenew | | Internet Retail | 4.21 | 100 | -8.80 | 57.64% |
| VMAR | Vision Marine | | Leisure | 1.94 | 20 | -12.56 | -79.06% |
| ARMK | Aramark | | Restaurants | 39.63 | 30 | -12.80 | 10.08% |
| FVRR | Fiverr | | Services | 22.37 | 40 | -14.44 | -30.10% |
| ARCO | Arcos Dorados | | Restaurants | 7.36 | 60 | -15.08 | 6.43% |
| RUSHA | Rush Enterprises | | Automobile | 56.37 | 60 | -16.32 | 8.71% |
| HGV | Hilton Grand | | Casinos | 44.39 | 30 | -17.38 | 18.07% |
| TGNA | TEGNA | | Broadcasting | 20.52 | 100 | -17.91 | 15.54% |
| MSM | MSC Industrial | | Equipment | 86.86 | 50 | -18.22 | 22.80% |
| WEN | Wendy s | | Restaurants | 10.57 | 60 | -22.23 | -34.28% |
| GDEN | Golden Entertainment | | Casinos | 24.88 | 0 | -23.65 | -17.09% |
| WYNN | Wynn Resorts | | Casinos | 109.45 | 50 | -24.93 | 30.47% |
| SGA | Saga | | Broadcasting | 13.45 | 80 | -28.72 | 22.18% |
| RH | RH | | Retail | 233.76 | 90 | -29.13 | -37.58% |
| CCRN | Cross Country | | Staffing | 13.37 | 80 | -32.48 | -27.81% |
| For chart view version of above stock list: Chart View ➞ 0 - 25 , 25 - 50 , 50 - 75 , 75 - 100 , 100 - 125 , 125 - 150 , 150 - 175 , 175 - 200 , 200 - 225 , 225 - 250 , 250 - 275 , 275 - 300 , 300 - 325 , 325 - 350 , 350 - 375 , 375 - 400 , 400 - 425 | ||
 | Click To Change The Sort Order: By Market Cap or Company Size Performance: Year-to-date, Week and Day |  |
|
Get the most comprehensive stock market coverage daily at 12Stocks.com ➞ Best Stocks Today ➞ Best Stocks Weekly ➞ Best Stocks Year-to-Date ➞ Best Stocks Trends ➞  Best Stocks Today 12Stocks.com Best Nasdaq Stocks ➞ Best S&P 500 Stocks ➞ Best Tech Stocks ➞ Best Biotech Stocks ➞ |
| Detailed Overview of Consumer Services Stocks |
| Consumer Services Technical Overview, Leaders & Laggards, Top Consumer Services ETF Funds & Detailed Consumer Services Stocks List, Charts, Trends & More |
| Consumer Services Sector: Technical Analysis, Trends & YTD Performance | |
| Consumer Services sector is composed of stocks
from retail, entertainment, media/publishing, consumer goods
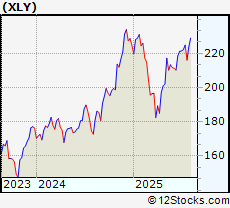
and services subsectors. Consumer Services sector, as represented by XLY, an exchange-traded fund [ETF] that holds basket of Consumer Services stocks (e.g, Walmart, Alibaba) is up by 2.95% and is currently underperforming the overall market by -7.38% year-to-date. Below is a quick view of Technical charts and trends: |
|
 XLY Weekly Chart |
|
| Long Term Trend: Very Good | |
| Medium Term Trend: Very Good | |
 XLY Daily Chart |
|
| Short Term Trend: Very Good | |
| Overall Trend Score: 100 | |
| YTD Performance: 2.95% | |
| **Trend Scores & Views Are Only For Educational Purposes And Not For Investing | |
| 12Stocks.com: Top Performing Consumer Services Sector Stocks | ||||||||||||||||||||||||||||||||||||||||||||||
 The top performing Consumer Services sector stocks year to date are
Now, more recently, over last week, the top performing Consumer Services sector stocks on the move are


|
||||||||||||||||||||||||||||||||||||||||||||||
| 12Stocks.com: Investing in Consumer Services Sector using Exchange Traded Funds | |
|
The following table shows list of key exchange traded funds (ETF) that
help investors track Consumer Services Index. For detailed view, check out our ETF Funds section of our website. Quick View: Move mouse or cursor over ETF symbol (ticker) to view short-term Technical chart and over ETF name to view long term chart. Click on ticker or stock name for detailed view. Click on to add stock symbol to your watchlist and to view watchlist. |
12Stocks.com List of ETFs that track Consumer Services Index
| Ticker | ETF Name | Watchlist | Recent Price | Smart Investing & Trading Score | Change % | Week % | Year-to-date % |
| XLY | Consumer Discret Sel | | 229.04 | 100 | 2.01 | 2.86 | 2.95% |
| RTH | Retail | | 247.72 | 100 | 0.63 | 0.8 | 10.46% |
| IYC | Consumer Services | | 102.72 | 100 | 1.68 | 2.04 | 7.35% |
| XRT | Retail | | 83.59 | 100 | 2.54 | 4.47 | 7.4% |
| IYK | Consumer Goods | | 70.21 | 40 | 0.37 | 1.49 | 8.38% |
| UCC | Consumer Services | | 49.53 | 100 | 2.96 | 5.78 | -2.73% |
| RETL | Retail Bull 3X | | 9.42 | 100 | 26.94 | 13.16 | 0.86% |
| RXI | Globl Consumer Discretionary | | 196.05 | 100 | 0.53 | 3.13 | 7.68% |
| SCC | Short Consumer Services | | 16.04 | 0 | -19.86 | -5.49 | -12.44% |
| UGE | Consumer Goods | | 18.79 | 20 | 1.05 | 2.4 | 7.27% |
| 12Stocks.com: Charts, Trends, Fundamental Data and Performances of Consumer Services Stocks | |
|
We now take in-depth look at all Consumer Services stocks including charts, multi-period performances and overall trends (as measured by Smart Investing & Trading Score). One can sort Consumer Services stocks (click link to choose) by Daily, Weekly and by Year-to-Date performances. Also, one can sort by size of the company or by market capitalization. |
| Select Your Default Chart Type: | |||||
| |||||
| Click on stock symbol or name for detailed view. Click on to add stock symbol to your watchlist and to view watchlist. Quick View: Move mouse or cursor over "Daily" to quickly view daily Technical stock chart and over "Weekly" to view weekly Technical stock chart. | |||||

 | ASPS Altisource Portfolio Solutions S.A. |
| Sector: Services & Goods | |
| SubSector: Business Services | |
| MarketCap: 120.382 Millions | |
| Recent Price: 10.49 Smart Investing & Trading Score: 40 | |
| Day Percent Change: -3.61% Day Change: -0.05 | |
| Week Change: -6.89% Year-to-date Change: 97.9% | |
| ASPS Links: Profile News Message Board | |
| Charts:- Daily , Weekly | |
| Add ASPS to Watchlist: View: Get Complete ASPS Trend Analysis ➞ | |
 | AAP Advance Auto Parts, Inc. |
| Sector: Services & Goods | |
| SubSector: Auto Parts Stores | |
| MarketCap: 5977.7 Millions | |
| Recent Price: 56.84 Smart Investing & Trading Score: 40 | |
| Day Percent Change: -3.88% Day Change: -1.98 | |
| Week Change: 2.28% Year-to-date Change: 33.0% | |
| AAP Links: Profile News Message Board | |
| Charts:- Daily , Weekly | |
| Add AAP to Watchlist: View: Get Complete AAP Trend Analysis ➞ | |
 | FUN Cedar Fair, L.P. |
| Sector: Services & Goods | |
| SubSector: General Entertainment | |
| MarketCap: 1440.49 Millions | |
| Recent Price: 25.54 Smart Investing & Trading Score: 20 | |
| Day Percent Change: -4.12% Day Change: -2.24 | |
| Week Change: 8.39% Year-to-date Change: -45.3% | |
| FUN Links: Profile News Message Board | |
| Charts:- Daily , Weekly | |
| Add FUN to Watchlist: View: Get Complete FUN Trend Analysis ➞ | |
 | PDD Pinduoduo Inc. |
| Sector: Services & Goods | |
| SubSector: Specialty Retail, Other | |
| MarketCap: 41696.2 Millions | |
| Recent Price: 118.95 Smart Investing & Trading Score: 90 | |
| Day Percent Change: -4.89% Day Change: -7.19 | |
| Week Change: 2.36% Year-to-date Change: 20.3% | |
| PDD Links: Profile News Message Board | |
| Charts:- Daily , Weekly | |
| Add PDD to Watchlist: View: Get Complete PDD Trend Analysis ➞ | |
 | NCLH Norwegian Cruise Line Holdings Ltd. |
| Sector: Services & Goods | |
| SubSector: Resorts & Casinos | |
| MarketCap: 2895.54 Millions | |
| Recent Price: 24.30 Smart Investing & Trading Score: 70 | |
| Day Percent Change: -4.99% Day Change: -0.92 | |
| Week Change: -0.2% Year-to-date Change: -3.8% | |
| NCLH Links: Profile News Message Board | |
| Charts:- Daily , Weekly | |
| Add NCLH to Watchlist: View: Get Complete NCLH Trend Analysis ➞ | |
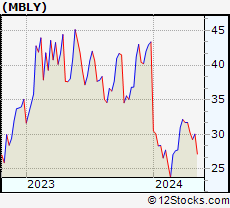 | MBLY Mobileye Global Inc. |
| Sector: Services & Goods | |
| SubSector: Auto Parts | |
| MarketCap: 31280 Millions | |
| Recent Price: 14.01 Smart Investing & Trading Score: 60 | |
| Day Percent Change: -5.01% Day Change: -0.76 | |
| Week Change: 2.44% Year-to-date Change: -28.5% | |
| MBLY Links: Profile News Message Board | |
| Charts:- Daily , Weekly | |
| Add MBLY to Watchlist: View: Get Complete MBLY Trend Analysis ➞ | |
 | CCO Clear Channel Outdoor Holdings, Inc. |
| Sector: Services & Goods | |
| SubSector: Marketing Services | |
| MarketCap: 312.715 Millions | |
| Recent Price: 1.18 Smart Investing & Trading Score: 80 | |
| Day Percent Change: -5.13% Day Change: -0.08 | |
| Week Change: 6.36% Year-to-date Change: -14.6% | |
| CCO Links: Profile News Message Board | |
| Charts:- Daily , Weekly | |
| Add CCO to Watchlist: View: Get Complete CCO Trend Analysis ➞ | |
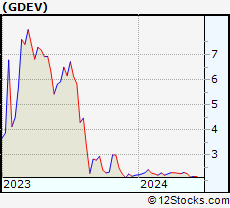 | GDEV GDEV Inc. |
| Sector: Services & Goods | |
| SubSector: Electronic Gaming & Multimedia | |
| MarketCap: 1300 Millions | |
| Recent Price: 14.71 Smart Investing & Trading Score: 31 | |
| Day Percent Change: -5.3% Day Change: -0.15 | |
| Week Change: 8.38% Year-to-date Change: -6.2% | |
| GDEV Links: Profile News Message Board | |
| Charts:- Daily , Weekly | |
| Add GDEV to Watchlist: View: Get Complete GDEV Trend Analysis ➞ | |
 | MSC Studio City International Holdings Limited |
| Sector: Services & Goods | |
| SubSector: Resorts & Casinos | |
| MarketCap: 1420.54 Millions | |
| Recent Price: 4.61 Smart Investing & Trading Score: 40 | |
| Day Percent Change: -6.16% Day Change: -0.4 | |
| Week Change: 7.14% Year-to-date Change: -17.7% | |
| MSC Links: Profile News Message Board | |
| Charts:- Daily , Weekly | |
| Add MSC to Watchlist: View: Get Complete MSC Trend Analysis ➞ | |
 | YSG Yatsen Holding Limited |
| Sector: Services & Goods | |
| SubSector: Specialty Retail | |
| MarketCap: 11827 Millions | |
| Recent Price: 9.43 Smart Investing & Trading Score: 50 | |
| Day Percent Change: -7.46% Day Change: -0.27 | |
| Week Change: 2.09% Year-to-date Change: 133.7% | |
| YSG Links: Profile News Message Board | |
| Charts:- Daily , Weekly | |
| Add YSG to Watchlist: View: Get Complete YSG Trend Analysis ➞ | |
 | RERE ATRenew Inc. |
| Sector: Services & Goods | |
| SubSector: Internet Retail | |
| MarketCap: 672 Millions | |
| Recent Price: 4.21 Smart Investing & Trading Score: 100 | |
| Day Percent Change: -8.8% Day Change: -0.22 | |
| Week Change: 33.14% Year-to-date Change: 57.6% | |
| RERE Links: Profile News Message Board | |
| Charts:- Daily , Weekly | |
| Add RERE to Watchlist: View: Get Complete RERE Trend Analysis ➞ | |
 | VMAR Vision Marine Technologies Inc. |
| Sector: Services & Goods | |
| SubSector: Leisure | |
| MarketCap: 99027 Millions | |
| Recent Price: 1.94 Smart Investing & Trading Score: 20 | |
| Day Percent Change: -12.56% Day Change: -0.51 | |
| Week Change: -34.06% Year-to-date Change: -79.1% | |
| VMAR Links: Profile News Message Board | |
| Charts:- Daily , Weekly | |
| Add VMAR to Watchlist: View: Get Complete VMAR Trend Analysis ➞ | |
 | ARMK Aramark |
| Sector: Services & Goods | |
| SubSector: Specialty Eateries | |
| MarketCap: 5242.27 Millions | |
| Recent Price: 39.63 Smart Investing & Trading Score: 30 | |
| Day Percent Change: -12.8% Day Change: -5.22 | |
| Week Change: 3.48% Year-to-date Change: 10.1% | |
| ARMK Links: Profile News Message Board | |
| Charts:- Daily , Weekly | |
| Add ARMK to Watchlist: View: Get Complete ARMK Trend Analysis ➞ | |
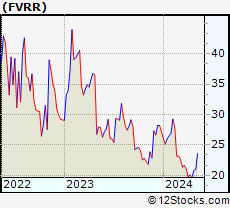 | FVRR Fiverr International Ltd. |
| Sector: Services & Goods | |
| SubSector: Business Services | |
| MarketCap: 766.582 Millions | |
| Recent Price: 22.37 Smart Investing & Trading Score: 40 | |
| Day Percent Change: -14.44% Day Change: -4.49 | |
| Week Change: 0.54% Year-to-date Change: -30.1% | |
| FVRR Links: Profile News Message Board | |
| Charts:- Daily , Weekly | |
| Add FVRR to Watchlist: View: Get Complete FVRR Trend Analysis ➞ | |
 | ARCO Arcos Dorados Holdings Inc. |
| Sector: Services & Goods | |
| SubSector: Restaurants | |
| MarketCap: 778.87 Millions | |
| Recent Price: 7.36 Smart Investing & Trading Score: 60 | |
| Day Percent Change: -15.08% Day Change: -1.63 | |
| Week Change: 11.71% Year-to-date Change: 6.4% | |
| ARCO Links: Profile News Message Board | |
| Charts:- Daily , Weekly | |
| Add ARCO to Watchlist: View: Get Complete ARCO Trend Analysis ➞ | |
 | RUSHA Rush Enterprises, Inc. |
| Sector: Services & Goods | |
| SubSector: Auto Dealerships | |
| MarketCap: 1183.21 Millions | |
| Recent Price: 56.37 Smart Investing & Trading Score: 60 | |
| Day Percent Change: -16.32% Day Change: -10.46 | |
| Week Change: 6.15% Year-to-date Change: 8.7% | |
| RUSHA Links: Profile News Message Board | |
| Charts:- Daily , Weekly | |
| Add RUSHA to Watchlist: View: Get Complete RUSHA Trend Analysis ➞ | |
 | HGV Hilton Grand Vacations Inc. |
| Sector: Services & Goods | |
| SubSector: Resorts & Casinos | |
| MarketCap: 1333.04 Millions | |
| Recent Price: 44.39 Smart Investing & Trading Score: 30 | |
| Day Percent Change: -17.38% Day Change: -8.06 | |
| Week Change: 3.65% Year-to-date Change: 18.1% | |
| HGV Links: Profile News Message Board | |
| Charts:- Daily , Weekly | |
| Add HGV to Watchlist: View: Get Complete HGV Trend Analysis ➞ | |
 | TGNA TEGNA Inc. |
| Sector: Services & Goods | |
| SubSector: Broadcasting - TV | |
| MarketCap: 2791.83 Millions | |
| Recent Price: 20.52 Smart Investing & Trading Score: 100 | |
| Day Percent Change: -17.91% Day Change: -3.06 | |
| Week Change: 27.26% Year-to-date Change: 15.5% | |
| TGNA Links: Profile News Message Board | |
| Charts:- Daily , Weekly | |
| Add TGNA to Watchlist: View: Get Complete TGNA Trend Analysis ➞ | |
 | MSM MSC Industrial Direct Co., Inc. |
| Sector: Services & Goods | |
| SubSector: Industrial Equipment Wholesale | |
| MarketCap: 2701.88 Millions | |
| Recent Price: 86.86 Smart Investing & Trading Score: 50 | |
| Day Percent Change: -18.22% Day Change: -18.54 | |
| Week Change: 3.75% Year-to-date Change: 22.8% | |
| MSM Links: Profile News Message Board | |
| Charts:- Daily , Weekly | |
| Add MSM to Watchlist: View: Get Complete MSM Trend Analysis ➞ | |
 | WEN The Wendy s Company |
| Sector: Services & Goods | |
| SubSector: Restaurants | |
| MarketCap: 2814.9 Millions | |
| Recent Price: 10.57 Smart Investing & Trading Score: 60 | |
| Day Percent Change: -22.23% Day Change: -4.83 | |
| Week Change: 3.69% Year-to-date Change: -34.3% | |
| WEN Links: Profile News Message Board | |
| Charts:- Daily , Weekly | |
| Add WEN to Watchlist: View: Get Complete WEN Trend Analysis ➞ | |
 | GDEN Golden Entertainment, Inc. |
| Sector: Services & Goods | |
| SubSector: Resorts & Casinos | |
| MarketCap: 130.794 Millions | |
| Recent Price: 24.88 Smart Investing & Trading Score: 0 | |
| Day Percent Change: -23.65% Day Change: -9.8 | |
| Week Change: -4.28% Year-to-date Change: -17.1% | |
| GDEN Links: Profile News Message Board | |
| Charts:- Daily , Weekly | |
| Add GDEN to Watchlist: View: Get Complete GDEN Trend Analysis ➞ | |
 | WYNN Wynn Resorts, Limited |
| Sector: Services & Goods | |
| SubSector: Resorts & Casinos | |
| MarketCap: 6643.34 Millions | |
| Recent Price: 109.45 Smart Investing & Trading Score: 50 | |
| Day Percent Change: -24.93% Day Change: -25.7 | |
| Week Change: 4.3% Year-to-date Change: 30.5% | |
| WYNN Links: Profile News Message Board | |
| Charts:- Daily , Weekly | |
| Add WYNN to Watchlist: View: Get Complete WYNN Trend Analysis ➞ | |
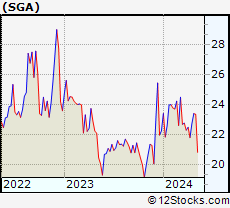 | SGA Saga Communications, Inc. |
| Sector: Services & Goods | |
| SubSector: Broadcasting - Radio | |
| MarketCap: 158.295 Millions | |
| Recent Price: 13.45 Smart Investing & Trading Score: 80 | |
| Day Percent Change: -28.72% Day Change: -6.06 | |
| Week Change: 7.11% Year-to-date Change: 22.2% | |
| SGA Links: Profile News Message Board | |
| Charts:- Daily , Weekly | |
| Add SGA to Watchlist: View: Get Complete SGA Trend Analysis ➞ | |
 | RH RH |
| Sector: Services & Goods | |
| SubSector: Home Furnishing Stores | |
| MarketCap: 1828.25 Millions | |
| Recent Price: 233.76 Smart Investing & Trading Score: 90 | |
| Day Percent Change: -29.13% Day Change: -116.41 | |
| Week Change: 15.33% Year-to-date Change: -37.6% | |
| RH Links: Profile News Message Board | |
| Charts:- Daily , Weekly | |
| Add RH to Watchlist: View: Get Complete RH Trend Analysis ➞ | |
 | CCRN Cross Country Healthcare, Inc. |
| Sector: Services & Goods | |
| SubSector: Staffing & Outsourcing Services | |
| MarketCap: 348.328 Millions | |
| Recent Price: 13.37 Smart Investing & Trading Score: 80 | |
| Day Percent Change: -32.48% Day Change: -7.38 | |
| Week Change: 0.08% Year-to-date Change: -27.8% | |
| CCRN Links: Profile News Message Board | |
| Charts:- Daily , Weekly | |
| Add CCRN to Watchlist: View: Get Complete CCRN Trend Analysis ➞ | |
| For tabular summary view of above stock list: Summary View ➞ 0 - 25 , 25 - 50 , 50 - 75 , 75 - 100 , 100 - 125 , 125 - 150 , 150 - 175 , 175 - 200 , 200 - 225 , 225 - 250 , 250 - 275 , 275 - 300 , 300 - 325 , 325 - 350 , 350 - 375 , 375 - 400 , 400 - 425 | ||
| Click To Change The Sort Order: By Market Cap or Company Size Performance: Year-to-date, Week and Day | |
| Select Chart Type: | ||
|
Best Stocks Today 12Stocks.com |
© 2025 12Stocks.com Terms & Conditions Privacy Contact Us
All Information Provided Only For Education And Not To Be Used For Investing or Trading. See Terms & Conditions


One More Thing ... Get Best Stocks Delivered Daily!
Never Ever Miss A Move With Our Top Ten Stocks Lists
Find Best Stocks In Any Market - Bull or Bear Market
Take A Peek At Our Top Ten Stocks Lists: Daily, Weekly, Year-to-Date & Top Trends
Find Best Stocks In Any Market - Bull or Bear Market
Take A Peek At Our Top Ten Stocks Lists: Daily, Weekly, Year-to-Date & Top Trends
Consumer Services Stocks With Best Up Trends [0-bearish to 100-bullish]: Louisiana-Pacific [100], eBay [100], Graham [100], Fastenal [100], Wayfair [100], Gaia [100], Gray Television[100], Haverty Furniture[100], RealReal [100], Resideo Technologies[100], Holley [100]
Best Consumer Services Stocks Year-to-Date:
MedEquities Realty[294856%], WW [2516.54%], ThredUp [656.12%], Willdan [210.66%], Kratos Defense[160.61%], IHS Holding[134.93%], Yatsen Holding[133.67%], National Vision[122.84%], Roblox [119.12%], Altisource Portfolio[97.94%], Jumia Technologies[95.29%] Best Consumer Services Stocks This Week:
MedEquities Realty[411381%], Jumia Technologies[62.88%], Money[56.67%], Brilliant Earth[44.93%], Holley [35.82%], RealReal [35.65%], Willdan [34.44%], ATRenew [33.14%], Gray Television[33.03%], Arhaus [28.98%], Park-Ohio [27.27%] Best Consumer Services Stocks Daily:
CareDx [185.69%], Wingstop [150.46%], Spotify Technology[147.52%], National CineMedia[112.46%], VSE [69.41%], Burlington Stores[66.03%], Myriad Genetics[64.88%], Costco Wholesale[58.1%], Daily Journal[57.5%], Texas Roadhouse[55.27%], Royal Caribbean[53.63%]