
 Login Sign Up


| |||||
 |  | ||||

| 12Stocks.com Market Intelligence |
Best Consumer Services Stocks
| In a hurry? Services & Goods Stocks: Performance Trends Table, Stock Charts
Sort Consumer Services: Daily, Weekly, Year-to-Date, Market Cap & Trends. Filter Services & Goods stocks list by size: All Large Mid-Range Small |
| 12Stocks.com Consumer Services Stocks Performances & Trends Daily | |||||||||
|
|  The overall Smart Investing & Trading Score is 58 (0-bearish to 100-bullish) which puts Consumer Services sector in short term neutral trend. The Smart Investing & Trading Score from previous trading session is 23 and hence an improvement of trend.
| ||||||||
Here are the Smart Investing & Trading Scores of the most requested Consumer Services stocks at 12Stocks.com (click stock name for detailed review):
|


| Consider signing up for our daily 12Stocks.com "Best Stocks Newsletter". You will never ever miss a big stock move again! |
| 12Stocks.com: Investing in Consumer Services sector with Stocks | |
|
The following table helps investors and traders sort through current performance and trends (as measured by Smart Investing & Trading Score) of various
stocks in the Consumer Services sector. Quick View: Move mouse or cursor over stock symbol (ticker) to view short-term Technical chart and over stock name to view long term chart. Click on  to add stock symbol to your watchlist and to add stock symbol to your watchlist and  to view watchlist. Click on any ticker or stock name for detailed market intelligence report for that stock. to view watchlist. Click on any ticker or stock name for detailed market intelligence report for that stock. |
12Stocks.com Performance of Stocks in Consumer Services Sector
| Ticker | Stock Name | Watchlist | Category | Recent Price | Smart Investing & Trading Score | Change % | YTD Change% |
| H | Hyatt Hotels |   | Lodging | 149.81 | 63 | 2.20 | 14.88% |
| AMBP | Ardagh Metal | | Packaging | 3.71 | 74 | 2.20 | -3.01% |
| TSQ | Townsquare Media | | Broadcasting | 12.60 | 93 | 2.19 | 19.32% |
| EYE | National Vision | | Retail | 18.84 | 35 | 2.17 | -9.99% |
| CASS | Cass Information | | Services | 43.00 | 30 | 2.14 | -4.55% |
| GPN | Global Payments | | Services | 126.87 | 64 | 2.13 | -0.10% |
| PAG | Penske Automotive | | Automobile | 152.20 | 75 | 2.13 | -5.18% |
| MATW | Matthews | | Services | 27.28 | 49 | 2.10 | -25.57% |
| DPZ | Domino s | | Restaurants | 481.16 | 61 | 2.10 | 16.72% |
| DIN | Dine Brands | | Restaurants | 45.15 | 74 | 2.10 | -9.06% |
| CBRL | Cracker Barrel | | Restaurants | 60.84 | 52 | 2.08 | -21.07% |
| URBN | Urban Outfitters | | Apparel | 39.36 | 75 | 2.07 | 10.28% |
| GETY | Getty Images | | Internet Content & Information | 3.95 | 59 | 2.07 | -24.62% |
| SCI | Service | | Services | 70.98 | 75 | 2.06 | 3.70% |
| BAH | Booz Allen | | Services | 145.96 | 73 | 2.06 | 14.11% |
| OLLI | Ollie s | | Retail | 75.22 | 90 | 2.06 | -0.89% |
| BKNG | Booking | | Services | 3533.99 | 55 | 2.05 | -0.37% |
| OUT | Outfront Media | | Marketing | 15.42 | 68 | 2.05 | 10.46% |
| CCO | Clear Channel | | Marketing | 1.50 | 42 | 2.04 | -17.58% |
| PTVE | Pactiv Evergreen | | Packaging | 15.00 | 93 | 2.04 | 9.33% |
| WCC | WESCO | | Equipment | 159.16 | 32 | 2.03 | -8.47% |
| FWRG | First Watch | | Restaurants | 22.73 | 66 | 2.02 | 14.05% |
| TAL | TAL Education | | Education | 12.19 | 90 | 2.01 | -3.48% |
| FWONA | Formula One | | Broadcasting | 62.35 | 100 | 2.00 | 7.54% |
| BEDU | Bright Scholar | | Education | 2.06 | 78 | 1.98 | 64.80% |
| For chart view version of above stock list: Chart View ➞ 0 - 25 , 25 - 50 , 50 - 75 , 75 - 100 , 100 - 125 , 125 - 150 , 150 - 175 , 175 - 200 , 200 - 225 , 225 - 250 , 250 - 275 , 275 - 300 , 300 - 325 , 325 - 350 , 350 - 375 , 375 - 400 , 400 - 425 , 425 - 450 , 450 - 475 | ||
 | Click To Change The Sort Order: By Market Cap or Company Size Performance: Year-to-date, Week and Day |  |
|
Get the most comprehensive stock market coverage daily at 12Stocks.com ➞ Best Stocks Today ➞ Best Stocks Weekly ➞ Best Stocks Year-to-Date ➞ Best Stocks Trends ➞  Best Stocks Today 12Stocks.com Best Nasdaq Stocks ➞ Best S&P 500 Stocks ➞ Best Tech Stocks ➞ Best Biotech Stocks ➞ |
| Detailed Overview of Consumer Services Stocks |
| Consumer Services Technical Overview, Leaders & Laggards, Top Consumer Services ETF Funds & Detailed Consumer Services Stocks List, Charts, Trends & More |
| Consumer Services Sector: Technical Analysis, Trends & YTD Performance | |
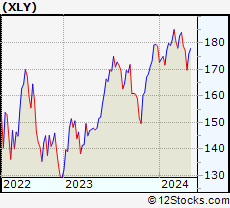
| Consumer Services sector is composed of stocks
from retail, entertainment, media/publishing, consumer goods
and services subsectors. Consumer Services sector, as represented by XLY, an exchange-traded fund [ETF] that holds basket of Consumer Services stocks (e.g, Walmart, Alibaba) is down by -3.51% and is currently underperforming the overall market by -9.15% year-to-date. Below is a quick view of Technical charts and trends: |
|
 XLY Weekly Chart |
|
| Long Term Trend: Good | |
| Medium Term Trend: Not Good | |
 XLY Daily Chart |
|
| Short Term Trend: Very Good | |
| Overall Trend Score: 58 | |
| YTD Performance: -3.51% | |
| **Trend Scores & Views Are Only For Educational Purposes And Not For Investing | |
| 12Stocks.com: Top Performing Consumer Services Sector Stocks | ||||||||||||||||||||||||||||||||||||||||||||||||
 The top performing Consumer Services sector stocks year to date are
Now, more recently, over last week, the top performing Consumer Services sector stocks on the move are


|
||||||||||||||||||||||||||||||||||||||||||||||||
| 12Stocks.com: Investing in Consumer Services Sector using Exchange Traded Funds | |
|
The following table shows list of key exchange traded funds (ETF) that
help investors track Consumer Services Index. For detailed view, check out our ETF Funds section of our website. Quick View: Move mouse or cursor over ETF symbol (ticker) to view short-term Technical chart and over ETF name to view long term chart. Click on ticker or stock name for detailed view. Click on to add stock symbol to your watchlist and to view watchlist. |
12Stocks.com List of ETFs that track Consumer Services Index
| Ticker | ETF Name | Watchlist | Recent Price | Smart Investing & Trading Score | Change % | Week % | Year-to-date % |
| XLY | Consumer Discret Sel | | 172.54 | 58 | 1.19 | 1.64 | -3.51% |
| RTH | Retail | | 200.49 | 58 | 0.15 | 0.94 | 6.51% |
| IYC | Consumer Services | | 77.59 | 51 | 1.27 | 1.73 | 2.4% |
| XRT | Retail | | 73.04 | 70 | 2.20 | 2.63 | 1% |
| IYK | Consumer Goods | | 66.54 | 100 | 0.18 | 1.11 | 4.13% |
| UCC | Consumer Services | | 32.68 | 45 | 1.64 | 3.49 | -8.99% |
| RETL | Retail Bull 3X | | 8.73 | 70 | 5.95 | 7.51 | -4.28% |
| RXI | Globl Consumer Discretionary | | 159.29 | 58 | 1.23 | 1.36 | 0.14% |
| SCC | Short Consumer Services | | 16.43 | 42 | -2.23 | -3.12 | 7.19% |
| UGE | Consumer Goods | | 17.03 | 80 | 0.29 | 2.42 | 8.19% |
| 12Stocks.com: Charts, Trends, Fundamental Data and Performances of Consumer Services Stocks | |
|
We now take in-depth look at all Consumer Services stocks including charts, multi-period performances and overall trends (as measured by Smart Investing & Trading Score). One can sort Consumer Services stocks (click link to choose) by Daily, Weekly and by Year-to-Date performances. Also, one can sort by size of the company or by market capitalization. |
| Select Your Default Chart Type: | |||||
| |||||
| Click on stock symbol or name for detailed view. Click on to add stock symbol to your watchlist and to view watchlist. Quick View: Move mouse or cursor over "Daily" to quickly view daily Technical stock chart and over "Weekly" to view weekly Technical stock chart. | |||||

 | H Hyatt Hotels Corporation |
| Sector: Services & Goods | |
| SubSector: Lodging | |
| MarketCap: 5525.56 Millions | |
| Recent Price: 149.81 Smart Investing & Trading Score: 63 | |
| Day Percent Change: 2.20% Day Change: 3.23 | |
| Week Change: 2.35% Year-to-date Change: 14.9% | |
| H Links: Profile News Message Board | |
| Charts:- Daily , Weekly | |
| Add H to Watchlist: View: Get Complete H Trend Analysis ➞ | |
 | AMBP Ardagh Metal Packaging S.A. |
| Sector: Services & Goods | |
| SubSector: Packaging & Containers | |
| MarketCap: 2170 Millions | |
| Recent Price: 3.71 Smart Investing & Trading Score: 74 | |
| Day Percent Change: 2.20% Day Change: 0.08 | |
| Week Change: 6.3% Year-to-date Change: -3.0% | |
| AMBP Links: Profile News Message Board | |
| Charts:- Daily , Weekly | |
| Add AMBP to Watchlist: View: Get Complete AMBP Trend Analysis ➞ | |
 | TSQ Townsquare Media, Inc. |
| Sector: Services & Goods | |
| SubSector: Broadcasting - Radio | |
| MarketCap: 101.795 Millions | |
| Recent Price: 12.60 Smart Investing & Trading Score: 93 | |
| Day Percent Change: 2.19% Day Change: 0.27 | |
| Week Change: 5.79% Year-to-date Change: 19.3% | |
| TSQ Links: Profile News Message Board | |
| Charts:- Daily , Weekly | |
| Add TSQ to Watchlist: View: Get Complete TSQ Trend Analysis ➞ | |
 | EYE National Vision Holdings, Inc. |
| Sector: Services & Goods | |
| SubSector: Specialty Retail, Other | |
| MarketCap: 1290.84 Millions | |
| Recent Price: 18.84 Smart Investing & Trading Score: 35 | |
| Day Percent Change: 2.17% Day Change: 0.40 | |
| Week Change: 0.21% Year-to-date Change: -10.0% | |
| EYE Links: Profile News Message Board | |
| Charts:- Daily , Weekly | |
| Add EYE to Watchlist: View: Get Complete EYE Trend Analysis ➞ | |
 | CASS Cass Information Systems, Inc. |
| Sector: Services & Goods | |
| SubSector: Business Services | |
| MarketCap: 477.382 Millions | |
| Recent Price: 43.00 Smart Investing & Trading Score: 30 | |
| Day Percent Change: 2.14% Day Change: 0.90 | |
| Week Change: 3.24% Year-to-date Change: -4.6% | |
| CASS Links: Profile News Message Board | |
| Charts:- Daily , Weekly | |
| Add CASS to Watchlist: View: Get Complete CASS Trend Analysis ➞ | |
 | GPN Global Payments Inc. |
| Sector: Services & Goods | |
| SubSector: Business Services | |
| MarketCap: 39068.8 Millions | |
| Recent Price: 126.87 Smart Investing & Trading Score: 64 | |
| Day Percent Change: 2.13% Day Change: 2.64 | |
| Week Change: 3.91% Year-to-date Change: -0.1% | |
| GPN Links: Profile News Message Board | |
| Charts:- Daily , Weekly | |
| Add GPN to Watchlist: View: Get Complete GPN Trend Analysis ➞ | |
 | PAG Penske Automotive Group, Inc. |
| Sector: Services & Goods | |
| SubSector: Auto Dealerships | |
| MarketCap: 2088.81 Millions | |
| Recent Price: 152.20 Smart Investing & Trading Score: 75 | |
| Day Percent Change: 2.13% Day Change: 3.18 | |
| Week Change: 2.88% Year-to-date Change: -5.2% | |
| PAG Links: Profile News Message Board | |
| Charts:- Daily , Weekly | |
| Add PAG to Watchlist: View: Get Complete PAG Trend Analysis ➞ | |
 | MATW Matthews International Corporation |
| Sector: Services & Goods | |
| SubSector: Personal Services | |
| MarketCap: 803.325 Millions | |
| Recent Price: 27.28 Smart Investing & Trading Score: 49 | |
| Day Percent Change: 2.10% Day Change: 0.56 | |
| Week Change: 3.22% Year-to-date Change: -25.6% | |
| MATW Links: Profile News Message Board | |
| Charts:- Daily , Weekly | |
| Add MATW to Watchlist: View: Get Complete MATW Trend Analysis ➞ | |
 | DPZ Domino s Pizza, Inc. |
| Sector: Services & Goods | |
| SubSector: Restaurants | |
| MarketCap: 12166 Millions | |
| Recent Price: 481.16 Smart Investing & Trading Score: 61 | |
| Day Percent Change: 2.10% Day Change: 9.88 | |
| Week Change: 1.61% Year-to-date Change: 16.7% | |
| DPZ Links: Profile News Message Board | |
| Charts:- Daily , Weekly | |
| Add DPZ to Watchlist: View: Get Complete DPZ Trend Analysis ➞ | |
 | DIN Dine Brands Global, Inc. |
| Sector: Services & Goods | |
| SubSector: Restaurants | |
| MarketCap: 421.17 Millions | |
| Recent Price: 45.15 Smart Investing & Trading Score: 74 | |
| Day Percent Change: 2.10% Day Change: 0.93 | |
| Week Change: 4.15% Year-to-date Change: -9.1% | |
| DIN Links: Profile News Message Board | |
| Charts:- Daily , Weekly | |
| Add DIN to Watchlist: View: Get Complete DIN Trend Analysis ➞ | |
 | CBRL Cracker Barrel Old Country Store, Inc. |
| Sector: Services & Goods | |
| SubSector: Restaurants | |
| MarketCap: 1839.6 Millions | |
| Recent Price: 60.84 Smart Investing & Trading Score: 52 | |
| Day Percent Change: 2.08% Day Change: 1.24 | |
| Week Change: 3.65% Year-to-date Change: -21.1% | |
| CBRL Links: Profile News Message Board | |
| Charts:- Daily , Weekly | |
| Add CBRL to Watchlist: View: Get Complete CBRL Trend Analysis ➞ | |
 | URBN Urban Outfitters, Inc. |
| Sector: Services & Goods | |
| SubSector: Apparel Stores | |
| MarketCap: 1638.08 Millions | |
| Recent Price: 39.36 Smart Investing & Trading Score: 75 | |
| Day Percent Change: 2.07% Day Change: 0.80 | |
| Week Change: 6.44% Year-to-date Change: 10.3% | |
| URBN Links: Profile News Message Board | |
| Charts:- Daily , Weekly | |
| Add URBN to Watchlist: View: Get Complete URBN Trend Analysis ➞ | |
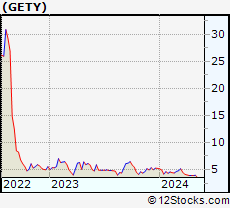 | GETY Getty Images Holdings, Inc. |
| Sector: Services & Goods | |
| SubSector: Internet Content & Information | |
| MarketCap: 1940 Millions | |
| Recent Price: 3.95 Smart Investing & Trading Score: 59 | |
| Day Percent Change: 2.07% Day Change: 0.08 | |
| Week Change: 0.25% Year-to-date Change: -24.6% | |
| GETY Links: Profile News Message Board | |
| Charts:- Daily , Weekly | |
| Add GETY to Watchlist: View: Get Complete GETY Trend Analysis ➞ | |
 | SCI Service Corporation International |
| Sector: Services & Goods | |
| SubSector: Personal Services | |
| MarketCap: 7216.05 Millions | |
| Recent Price: 70.98 Smart Investing & Trading Score: 75 | |
| Day Percent Change: 2.06% Day Change: 1.43 | |
| Week Change: 3.18% Year-to-date Change: 3.7% | |
| SCI Links: Profile News Message Board | |
| Charts:- Daily , Weekly | |
| Add SCI to Watchlist: View: Get Complete SCI Trend Analysis ➞ | |
 | BAH Booz Allen Hamilton Holding Corporation |
| Sector: Services & Goods | |
| SubSector: Management Services | |
| MarketCap: 9037.35 Millions | |
| Recent Price: 145.96 Smart Investing & Trading Score: 73 | |
| Day Percent Change: 2.06% Day Change: 2.95 | |
| Week Change: 2.69% Year-to-date Change: 14.1% | |
| BAH Links: Profile News Message Board | |
| Charts:- Daily , Weekly | |
| Add BAH to Watchlist: View: Get Complete BAH Trend Analysis ➞ | |
 | OLLI Ollie s Bargain Outlet Holdings, Inc. |
| Sector: Services & Goods | |
| SubSector: Discount, Variety Stores | |
| MarketCap: 2904.62 Millions | |
| Recent Price: 75.22 Smart Investing & Trading Score: 90 | |
| Day Percent Change: 2.06% Day Change: 1.52 | |
| Week Change: 2.74% Year-to-date Change: -0.9% | |
| OLLI Links: Profile News Message Board | |
| Charts:- Daily , Weekly | |
| Add OLLI to Watchlist: View: Get Complete OLLI Trend Analysis ➞ | |
 | BKNG Booking Holdings Inc. |
| Sector: Services & Goods | |
| SubSector: Business Services | |
| MarketCap: 54467.9 Millions | |
| Recent Price: 3533.99 Smart Investing & Trading Score: 55 | |
| Day Percent Change: 2.05% Day Change: 70.99 | |
| Week Change: 3.49% Year-to-date Change: -0.4% | |
| BKNG Links: Profile News Message Board | |
| Charts:- Daily , Weekly | |
| Add BKNG to Watchlist: View: Get Complete BKNG Trend Analysis ➞ | |
 | OUT Outfront Media Inc. |
| Sector: Services & Goods | |
| SubSector: Marketing Services | |
| MarketCap: 1388.15 Millions | |
| Recent Price: 15.42 Smart Investing & Trading Score: 68 | |
| Day Percent Change: 2.05% Day Change: 0.31 | |
| Week Change: 3.98% Year-to-date Change: 10.5% | |
| OUT Links: Profile News Message Board | |
| Charts:- Daily , Weekly | |
| Add OUT to Watchlist: View: Get Complete OUT Trend Analysis ➞ | |
 | CCO Clear Channel Outdoor Holdings, Inc. |
| Sector: Services & Goods | |
| SubSector: Marketing Services | |
| MarketCap: 312.715 Millions | |
| Recent Price: 1.50 Smart Investing & Trading Score: 42 | |
| Day Percent Change: 2.04% Day Change: 0.03 | |
| Week Change: 0.67% Year-to-date Change: -17.6% | |
| CCO Links: Profile News Message Board | |
| Charts:- Daily , Weekly | |
| Add CCO to Watchlist: View: Get Complete CCO Trend Analysis ➞ | |
 | PTVE Pactiv Evergreen Inc. |
| Sector: Services & Goods | |
| SubSector: Packaging & Containers | |
| MarketCap: 33427 Millions | |
| Recent Price: 15.00 Smart Investing & Trading Score: 93 | |
| Day Percent Change: 2.04% Day Change: 0.30 | |
| Week Change: 4.09% Year-to-date Change: 9.3% | |
| PTVE Links: Profile News Message Board | |
| Charts:- Daily , Weekly | |
| Add PTVE to Watchlist: View: Get Complete PTVE Trend Analysis ➞ | |
 | WCC WESCO International, Inc. |
| Sector: Services & Goods | |
| SubSector: Industrial Equipment Wholesale | |
| MarketCap: 824.358 Millions | |
| Recent Price: 159.16 Smart Investing & Trading Score: 32 | |
| Day Percent Change: 2.03% Day Change: 3.17 | |
| Week Change: 3.34% Year-to-date Change: -8.5% | |
| WCC Links: Profile News Message Board | |
| Charts:- Daily , Weekly | |
| Add WCC to Watchlist: View: Get Complete WCC Trend Analysis ➞ | |
 | FWRG First Watch Restaurant Group, Inc. |
| Sector: Services & Goods | |
| SubSector: Restaurants | |
| MarketCap: 1000 Millions | |
| Recent Price: 22.73 Smart Investing & Trading Score: 66 | |
| Day Percent Change: 2.02% Day Change: 0.45 | |
| Week Change: 1.93% Year-to-date Change: 14.1% | |
| FWRG Links: Profile News Message Board | |
| Charts:- Daily , Weekly | |
| Add FWRG to Watchlist: View: Get Complete FWRG Trend Analysis ➞ | |
 | TAL TAL Education Group |
| Sector: Services & Goods | |
| SubSector: Education & Training Services | |
| MarketCap: 30103.1 Millions | |
| Recent Price: 12.19 Smart Investing & Trading Score: 90 | |
| Day Percent Change: 2.01% Day Change: 0.24 | |
| Week Change: 6.65% Year-to-date Change: -3.5% | |
| TAL Links: Profile News Message Board | |
| Charts:- Daily , Weekly | |
| Add TAL to Watchlist: View: Get Complete TAL Trend Analysis ➞ | |
 | FWONA Formula One Group |
| Sector: Services & Goods | |
| SubSector: Broadcasting - TV | |
| MarketCap: 17485.6 Millions | |
| Recent Price: 62.35 Smart Investing & Trading Score: 100 | |
| Day Percent Change: 2.00% Day Change: 1.22 | |
| Week Change: 3.01% Year-to-date Change: 7.5% | |
| FWONA Links: Profile News Message Board | |
| Charts:- Daily , Weekly | |
| Add FWONA to Watchlist: View: Get Complete FWONA Trend Analysis ➞ | |
 | BEDU Bright Scholar Education Holdings Limited |
| Sector: Services & Goods | |
| SubSector: Education & Training Services | |
| MarketCap: 792.406 Millions | |
| Recent Price: 2.06 Smart Investing & Trading Score: 78 | |
| Day Percent Change: 1.98% Day Change: 0.04 | |
| Week Change: 2.49% Year-to-date Change: 64.8% | |
| BEDU Links: Profile News Message Board | |
| Charts:- Daily , Weekly | |
| Add BEDU to Watchlist: View: Get Complete BEDU Trend Analysis ➞ | |
| For tabular summary view of above stock list: Summary View ➞ 0 - 25 , 25 - 50 , 50 - 75 , 75 - 100 , 100 - 125 , 125 - 150 , 150 - 175 , 175 - 200 , 200 - 225 , 225 - 250 , 250 - 275 , 275 - 300 , 300 - 325 , 325 - 350 , 350 - 375 , 375 - 400 , 400 - 425 , 425 - 450 , 450 - 475 | ||
| Click To Change The Sort Order: By Market Cap or Company Size Performance: Year-to-date, Week and Day | |
| Select Chart Type: | ||
|
Best Stocks Today 12Stocks.com |
© 2024 12Stocks.com Terms & Conditions Privacy Contact Us
All Information Provided Only For Education And Not To Be Used For Investing or Trading. See Terms & Conditions


One More Thing ... Get Best Stocks Delivered Daily!
Never Ever Miss A Move With Our Top Ten Stocks Lists
Find Best Stocks In Any Market - Bull or Bear Market
Take A Peek At Our Top Ten Stocks Lists: Daily, Weekly, Year-to-Date & Top Trends
Find Best Stocks In Any Market - Bull or Bear Market
Take A Peek At Our Top Ten Stocks Lists: Daily, Weekly, Year-to-Date & Top Trends
Consumer Services Stocks With Best Up Trends [0-bearish to 100-bullish]: Hibbett Sports[100], Gannett Co[100], MYT Netherlands[100], Dillard s[100], Napco Security[100], Lands [100], MINISO [100], Brinker [100], Boot Barn[100], Cheesecake Factory[100], Deluxe [100]
Best Consumer Services Stocks Year-to-Date:
U Power[2801.79%], Vroom [1827.73%], Yatsen Holding[437.18%], Fluent [289.55%], Codere Online[134.25%], Research[101.58%], Sweetgreen [96.9%], RealReal [71.64%], Bright Scholar[64.8%], Spotify Technology[61.41%], PaySign [59.64%] Best Consumer Services Stocks This Week:
Hibbett Sports[21.1%], Noodles & [17.65%], Jumia Technologies[17.51%], Allbirds [15.68%], DoubleDown Interactive[15.06%], Pinduoduo [12.8%], MYT Netherlands[12.01%], China Online[11.9%], iHeartMedia [11.58%], Zumiez [11.4%], Ameresco [11.12%] Best Consumer Services Stocks Daily:
Hibbett Sports[18.84%], SES AI[12.17%], Golden Heaven[11.75%], Spotify Technology[11.41%], Jumia Technologies[11.30%], Sweetgreen [9.50%], Designer Brands[9.49%], Ameresco [9.43%], China Online[9.37%], iHeartMedia [9.00%], Noodles & [8.95%]