
 Login Sign Up


| |||||
 |  | ||||

| 12Stocks.com Market Intelligence |
Best Consumer Services Stocks
| In a hurry? Services & Goods Stocks: Performance Trends Table, Stock Charts
Sort Consumer Services: Daily, Weekly, Year-to-Date, Market Cap & Trends. Filter Services & Goods stocks list by size: All Large Mid-Range Small |
| 12Stocks.com Consumer Services Stocks Performances & Trends Daily | |||||||||
|
|  The overall Smart Investing & Trading Score is 13 (0-bearish to 100-bullish) which puts Consumer Services sector in short term bearish trend. The Smart Investing & Trading Score from previous trading session is 26 and a deterioration of trend continues.
| ||||||||
Here are the Smart Investing & Trading Scores of the most requested Consumer Services stocks at 12Stocks.com (click stock name for detailed review):
|


| Consider signing up for our daily 12Stocks.com "Best Stocks Newsletter". You will never ever miss a big stock move again! |
| 12Stocks.com: Investing in Consumer Services sector with Stocks | |
|
The following table helps investors and traders sort through current performance and trends (as measured by Smart Investing & Trading Score) of various
stocks in the Consumer Services sector. Quick View: Move mouse or cursor over stock symbol (ticker) to view short-term Technical chart and over stock name to view long term chart. Click on  to add stock symbol to your watchlist and to add stock symbol to your watchlist and  to view watchlist. Click on any ticker or stock name for detailed market intelligence report for that stock. to view watchlist. Click on any ticker or stock name for detailed market intelligence report for that stock. |
12Stocks.com Performance of Stocks in Consumer Services Sector
| Ticker | Stock Name | Watchlist | Category | Recent Price | Smart Investing & Trading Score | Change % | YTD Change% |
| PAYX | Paychex |   | Staffing | 119.52 | 17 | 1.47 | 0.34% |
| PLYA | Playa Hotels | | Casinos | 9.00 | 41 | 1.47 | 4.05% |
| FWONA | Formula One | | Broadcasting | 60.53 | 57 | 1.46 | 4.40% |
| NSP | Insperity | | Services | 108.35 | 52 | 1.45 | -7.57% |
| CONN | Conn s | | Retail | 3.74 | 49 | 1.36 | -15.77% |
| DENN | Denny s | | Restaurants | 8.17 | 27 | 1.36 | -24.91% |
| GPC | Genuine Parts | | Auto Parts | 162.39 | 100 | 1.35 | 17.25% |
| EXPO | Exponent | | Services | 79.17 | 52 | 1.34 | -10.07% |
| QGEN | QIAGEN N.V | | Research | 40.00 | 32 | 1.34 | -7.90% |
| WEN | Wendy s | | Restaurants | 19.25 | 100 | 1.32 | -1.18% |
| ARCO | Arcos Dorados | | Restaurants | 10.90 | 42 | 1.30 | -14.11% |
| TDUP | ThredUp | | Internet Retail | 1.56 | 25 | 1.30 | -30.97% |
| AMRC | Ameresco | | Services | 18.80 | 20 | 1.29 | -40.64% |
| FWONK | Formula One | | Broadcasting | 68.08 | 76 | 1.29 | 7.84% |
| GAMB | Gambling.com | | Gambling | 8.70 | 50 | 1.28 | -10.86% |
| HSIC | Henry Schein | | Medical | 70.86 | 25 | 1.27 | -6.41% |
| OLLI | Ollie s | | Retail | 73.21 | 58 | 1.27 | -3.53% |
| GLP | Global Partners | | Basic Materials Wholesale | 46.10 | 47 | 1.25 | 8.96% |
| AOUT | American Outdoor | | Leisure | 8.54 | 65 | 1.24 | 1.18% |
| RCL | Royal Caribbean | | Casinos | 129.21 | 58 | 1.23 | -0.22% |
| OMC | Omnicom | | Advertising | 92.62 | 61 | 1.22 | 7.06% |
| BKR | Baker Hughes | | Services | 32.59 | 68 | 1.21 | -4.65% |
| EEFT | Euronet Worldwide | | Services | 103.04 | 63 | 1.21 | 1.53% |
| DIN | Dine Brands | | Restaurants | 43.35 | 35 | 1.21 | -12.69% |
| MCRI | Monarch Casino | | Casinos | 67.34 | 7 | 1.20 | -2.62% |
| For chart view version of above stock list: Chart View ➞ 0 - 25 , 25 - 50 , 50 - 75 , 75 - 100 , 100 - 125 , 125 - 150 , 150 - 175 , 175 - 200 , 200 - 225 , 225 - 250 , 250 - 275 , 275 - 300 , 300 - 325 , 325 - 350 , 350 - 375 , 375 - 400 , 400 - 425 , 425 - 450 , 450 - 475 | ||
 | Click To Change The Sort Order: By Market Cap or Company Size Performance: Year-to-date, Week and Day |  |
|
Get the most comprehensive stock market coverage daily at 12Stocks.com ➞ Best Stocks Today ➞ Best Stocks Weekly ➞ Best Stocks Year-to-Date ➞ Best Stocks Trends ➞  Best Stocks Today 12Stocks.com Best Nasdaq Stocks ➞ Best S&P 500 Stocks ➞ Best Tech Stocks ➞ Best Biotech Stocks ➞ |
| Detailed Overview of Consumer Services Stocks |
| Consumer Services Technical Overview, Leaders & Laggards, Top Consumer Services ETF Funds & Detailed Consumer Services Stocks List, Charts, Trends & More |
| Consumer Services Sector: Technical Analysis, Trends & YTD Performance | |
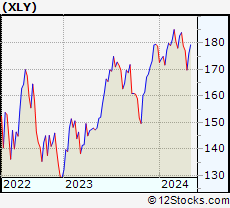
| Consumer Services sector is composed of stocks
from retail, entertainment, media/publishing, consumer goods
and services subsectors. Consumer Services sector, as represented by XLY, an exchange-traded fund [ETF] that holds basket of Consumer Services stocks (e.g, Walmart, Alibaba) is down by -5.06% and is currently underperforming the overall market by -8.44% year-to-date. Below is a quick view of Technical charts and trends: |
|
 XLY Weekly Chart |
|
| Long Term Trend: Not Good | |
| Medium Term Trend: Not Good | |
 XLY Daily Chart |
|
| Short Term Trend: Not Good | |
| Overall Trend Score: 13 | |
| YTD Performance: -5.06% | |
| **Trend Scores & Views Are Only For Educational Purposes And Not For Investing | |
| 12Stocks.com: Top Performing Consumer Services Sector Stocks | ||||||||||||||||||||||||||||||||||||||||||||||||
 The top performing Consumer Services sector stocks year to date are
Now, more recently, over last week, the top performing Consumer Services sector stocks on the move are


|
||||||||||||||||||||||||||||||||||||||||||||||||
| 12Stocks.com: Investing in Consumer Services Sector using Exchange Traded Funds | |
|
The following table shows list of key exchange traded funds (ETF) that
help investors track Consumer Services Index. For detailed view, check out our ETF Funds section of our website. Quick View: Move mouse or cursor over ETF symbol (ticker) to view short-term Technical chart and over ETF name to view long term chart. Click on ticker or stock name for detailed view. Click on to add stock symbol to your watchlist and to view watchlist. |
12Stocks.com List of ETFs that track Consumer Services Index
| Ticker | ETF Name | Watchlist | Recent Price | Smart Investing & Trading Score | Change % | Week % | Year-to-date % |
| XLY | Consumer Discret Sel | | 169.76 | 13 | -0.88 | -4.15 | -5.06% |
| RTH | Retail | | 198.63 | 44 | 0.00 | -1.52 | 5.53% |
| IYC | Consumer Services | | 76.27 | 36 | -1.03 | -3.69 | 0.66% |
| XRT | Retail | | 71.17 | 51 | 0.68 | -0.99 | -1.59% |
| IYK | Consumer Goods | | 65.81 | 60 | 1.29 | 2.57 | 2.98% |
| UCC | Consumer Services | | 31.58 | 20 | -3.26 | -8.28 | -12.06% |
| RETL | Retail Bull 3X | | 8.12 | 41 | 2.14 | -3.45 | -10.96% |
| RXI | Globl Consumer Discretionary | | 157.15 | 44 | -0.19 | -2.26 | -1.2% |
| SCC | Short Consumer Services | | 16.95 | 100 | 2.13 | 8.91 | 10.64% |
| UGE | Consumer Goods | | 16.63 | 73 | 2.26 | 2.71 | 5.63% |
| 12Stocks.com: Charts, Trends, Fundamental Data and Performances of Consumer Services Stocks | |
|
We now take in-depth look at all Consumer Services stocks including charts, multi-period performances and overall trends (as measured by Smart Investing & Trading Score). One can sort Consumer Services stocks (click link to choose) by Daily, Weekly and by Year-to-Date performances. Also, one can sort by size of the company or by market capitalization. |
| Select Your Default Chart Type: | |||||
| |||||
| Click on stock symbol or name for detailed view. Click on to add stock symbol to your watchlist and to view watchlist. Quick View: Move mouse or cursor over "Daily" to quickly view daily Technical stock chart and over "Weekly" to view weekly Technical stock chart. | |||||

 | PAYX Paychex, Inc. |
| Sector: Services & Goods | |
| SubSector: Staffing & Outsourcing Services | |
| MarketCap: 20928.8 Millions | |
| Recent Price: 119.52 Smart Investing & Trading Score: 17 | |
| Day Percent Change: 1.47% Day Change: 1.73 | |
| Week Change: -2.83% Year-to-date Change: 0.3% | |
| PAYX Links: Profile News Message Board | |
| Charts:- Daily , Weekly | |
| Add PAYX to Watchlist: View: Get Complete PAYX Trend Analysis ➞ | |
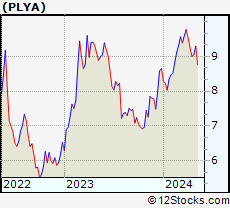 | PLYA Playa Hotels & Resorts N.V. |
| Sector: Services & Goods | |
| SubSector: Resorts & Casinos | |
| MarketCap: 360.194 Millions | |
| Recent Price: 9.00 Smart Investing & Trading Score: 41 | |
| Day Percent Change: 1.47% Day Change: 0.13 | |
| Week Change: -2.81% Year-to-date Change: 4.1% | |
| PLYA Links: Profile News Message Board | |
| Charts:- Daily , Weekly | |
| Add PLYA to Watchlist: View: Get Complete PLYA Trend Analysis ➞ | |
 | FWONA Formula One Group |
| Sector: Services & Goods | |
| SubSector: Broadcasting - TV | |
| MarketCap: 17485.6 Millions | |
| Recent Price: 60.53 Smart Investing & Trading Score: 57 | |
| Day Percent Change: 1.46% Day Change: 0.87 | |
| Week Change: -1.14% Year-to-date Change: 4.4% | |
| FWONA Links: Profile News Message Board | |
| Charts:- Daily , Weekly | |
| Add FWONA to Watchlist: View: Get Complete FWONA Trend Analysis ➞ | |
 | NSP Insperity, Inc. |
| Sector: Services & Goods | |
| SubSector: Business Services | |
| MarketCap: 1385.32 Millions | |
| Recent Price: 108.35 Smart Investing & Trading Score: 52 | |
| Day Percent Change: 1.45% Day Change: 1.55 | |
| Week Change: 2.29% Year-to-date Change: -7.6% | |
| NSP Links: Profile News Message Board | |
| Charts:- Daily , Weekly | |
| Add NSP to Watchlist: View: Get Complete NSP Trend Analysis ➞ | |
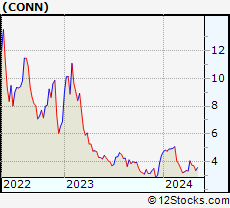 | CONN Conn s, Inc. |
| Sector: Services & Goods | |
| SubSector: Electronics Stores | |
| MarketCap: 153.2 Millions | |
| Recent Price: 3.74 Smart Investing & Trading Score: 49 | |
| Day Percent Change: 1.36% Day Change: 0.05 | |
| Week Change: -7.65% Year-to-date Change: -15.8% | |
| CONN Links: Profile News Message Board | |
| Charts:- Daily , Weekly | |
| Add CONN to Watchlist: View: Get Complete CONN Trend Analysis ➞ | |
 | DENN Denny s Corporation |
| Sector: Services & Goods | |
| SubSector: Restaurants | |
| MarketCap: 367.47 Millions | |
| Recent Price: 8.17 Smart Investing & Trading Score: 27 | |
| Day Percent Change: 1.36% Day Change: 0.11 | |
| Week Change: -2.85% Year-to-date Change: -24.9% | |
| DENN Links: Profile News Message Board | |
| Charts:- Daily , Weekly | |
| Add DENN to Watchlist: View: Get Complete DENN Trend Analysis ➞ | |
 | GPC Genuine Parts Company |
| Sector: Services & Goods | |
| SubSector: Auto Parts Stores | |
| MarketCap: 8605.9 Millions | |
| Recent Price: 162.39 Smart Investing & Trading Score: 100 | |
| Day Percent Change: 1.35% Day Change: 2.16 | |
| Week Change: 11.7% Year-to-date Change: 17.3% | |
| GPC Links: Profile News Message Board | |
| Charts:- Daily , Weekly | |
| Add GPC to Watchlist: View: Get Complete GPC Trend Analysis ➞ | |
 | EXPO Exponent, Inc. |
| Sector: Services & Goods | |
| SubSector: Management Services | |
| MarketCap: 3605.95 Millions | |
| Recent Price: 79.17 Smart Investing & Trading Score: 52 | |
| Day Percent Change: 1.34% Day Change: 1.05 | |
| Week Change: -0.88% Year-to-date Change: -10.1% | |
| EXPO Links: Profile News Message Board | |
| Charts:- Daily , Weekly | |
| Add EXPO to Watchlist: View: Get Complete EXPO Trend Analysis ➞ | |
 | QGEN QIAGEN N.V. |
| Sector: Services & Goods | |
| SubSector: Research Services | |
| MarketCap: 8698.94 Millions | |
| Recent Price: 40.00 Smart Investing & Trading Score: 32 | |
| Day Percent Change: 1.34% Day Change: 0.53 | |
| Week Change: -0.45% Year-to-date Change: -7.9% | |
| QGEN Links: Profile News Message Board | |
| Charts:- Daily , Weekly | |
| Add QGEN to Watchlist: View: Get Complete QGEN Trend Analysis ➞ | |
 | WEN The Wendy s Company |
| Sector: Services & Goods | |
| SubSector: Restaurants | |
| MarketCap: 2814.9 Millions | |
| Recent Price: 19.25 Smart Investing & Trading Score: 100 | |
| Day Percent Change: 1.32% Day Change: 0.25 | |
| Week Change: 3.49% Year-to-date Change: -1.2% | |
| WEN Links: Profile News Message Board | |
| Charts:- Daily , Weekly | |
| Add WEN to Watchlist: View: Get Complete WEN Trend Analysis ➞ | |
 | ARCO Arcos Dorados Holdings Inc. |
| Sector: Services & Goods | |
| SubSector: Restaurants | |
| MarketCap: 778.87 Millions | |
| Recent Price: 10.90 Smart Investing & Trading Score: 42 | |
| Day Percent Change: 1.30% Day Change: 0.14 | |
| Week Change: -0.91% Year-to-date Change: -14.1% | |
| ARCO Links: Profile News Message Board | |
| Charts:- Daily , Weekly | |
| Add ARCO to Watchlist: View: Get Complete ARCO Trend Analysis ➞ | |
 | TDUP ThredUp Inc. |
| Sector: Services & Goods | |
| SubSector: Internet Retail | |
| MarketCap: 258 Millions | |
| Recent Price: 1.56 Smart Investing & Trading Score: 25 | |
| Day Percent Change: 1.30% Day Change: 0.02 | |
| Week Change: -6.59% Year-to-date Change: -31.0% | |
| TDUP Links: Profile News Message Board | |
| Charts:- Daily , Weekly | |
| Add TDUP to Watchlist: View: Get Complete TDUP Trend Analysis ➞ | |
 | AMRC Ameresco, Inc. |
| Sector: Services & Goods | |
| SubSector: Technical Services | |
| MarketCap: 898.91 Millions | |
| Recent Price: 18.80 Smart Investing & Trading Score: 20 | |
| Day Percent Change: 1.29% Day Change: 0.24 | |
| Week Change: -10.13% Year-to-date Change: -40.6% | |
| AMRC Links: Profile News Message Board | |
| Charts:- Daily , Weekly | |
| Add AMRC to Watchlist: View: Get Complete AMRC Trend Analysis ➞ | |
 | FWONK Formula One Group |
| Sector: Services & Goods | |
| SubSector: Broadcasting - TV | |
| MarketCap: 4677.53 Millions | |
| Recent Price: 68.08 Smart Investing & Trading Score: 76 | |
| Day Percent Change: 1.29% Day Change: 0.87 | |
| Week Change: -0.95% Year-to-date Change: 7.8% | |
| FWONK Links: Profile News Message Board | |
| Charts:- Daily , Weekly | |
| Add FWONK to Watchlist: View: Get Complete FWONK Trend Analysis ➞ | |
 | GAMB Gambling.com Group Limited |
| Sector: Services & Goods | |
| SubSector: Gambling | |
| MarketCap: 376 Millions | |
| Recent Price: 8.70 Smart Investing & Trading Score: 50 | |
| Day Percent Change: 1.28% Day Change: 0.11 | |
| Week Change: -4.4% Year-to-date Change: -10.9% | |
| GAMB Links: Profile News Message Board | |
| Charts:- Daily , Weekly | |
| Add GAMB to Watchlist: View: Get Complete GAMB Trend Analysis ➞ | |
 | HSIC Henry Schein, Inc. |
| Sector: Services & Goods | |
| SubSector: Medical Equipment Wholesale | |
| MarketCap: 6760.9 Millions | |
| Recent Price: 70.86 Smart Investing & Trading Score: 25 | |
| Day Percent Change: 1.27% Day Change: 0.89 | |
| Week Change: -0.21% Year-to-date Change: -6.4% | |
| HSIC Links: Profile News Message Board | |
| Charts:- Daily , Weekly | |
| Add HSIC to Watchlist: View: Get Complete HSIC Trend Analysis ➞ | |
 | OLLI Ollie s Bargain Outlet Holdings, Inc. |
| Sector: Services & Goods | |
| SubSector: Discount, Variety Stores | |
| MarketCap: 2904.62 Millions | |
| Recent Price: 73.21 Smart Investing & Trading Score: 58 | |
| Day Percent Change: 1.27% Day Change: 0.92 | |
| Week Change: 2.36% Year-to-date Change: -3.5% | |
| OLLI Links: Profile News Message Board | |
| Charts:- Daily , Weekly | |
| Add OLLI to Watchlist: View: Get Complete OLLI Trend Analysis ➞ | |
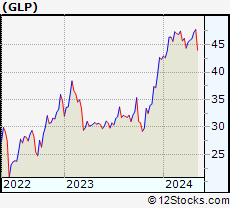 | GLP Global Partners LP |
| Sector: Services & Goods | |
| SubSector: Basic Materials Wholesale | |
| MarketCap: 416.73 Millions | |
| Recent Price: 46.10 Smart Investing & Trading Score: 47 | |
| Day Percent Change: 1.25% Day Change: 0.57 | |
| Week Change: 0.63% Year-to-date Change: 9.0% | |
| GLP Links: Profile News Message Board | |
| Charts:- Daily , Weekly | |
| Add GLP to Watchlist: View: Get Complete GLP Trend Analysis ➞ | |
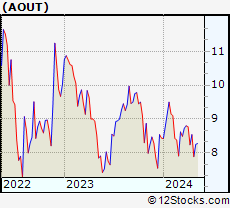 | AOUT American Outdoor Brands, Inc. |
| Sector: Services & Goods | |
| SubSector: Leisure | |
| MarketCap: 19027 Millions | |
| Recent Price: 8.54 Smart Investing & Trading Score: 65 | |
| Day Percent Change: 1.24% Day Change: 0.10 | |
| Week Change: 3.64% Year-to-date Change: 1.2% | |
| AOUT Links: Profile News Message Board | |
| Charts:- Daily , Weekly | |
| Add AOUT to Watchlist: View: Get Complete AOUT Trend Analysis ➞ | |
 | RCL Royal Caribbean Cruises Ltd. |
| Sector: Services & Goods | |
| SubSector: Resorts & Casinos | |
| MarketCap: 7294.14 Millions | |
| Recent Price: 129.21 Smart Investing & Trading Score: 58 | |
| Day Percent Change: 1.23% Day Change: 1.57 | |
| Week Change: 1.21% Year-to-date Change: -0.2% | |
| RCL Links: Profile News Message Board | |
| Charts:- Daily , Weekly | |
| Add RCL to Watchlist: View: Get Complete RCL Trend Analysis ➞ | |
 | OMC Omnicom Group Inc. |
| Sector: Services & Goods | |
| SubSector: Advertising Agencies | |
| MarketCap: 11813.5 Millions | |
| Recent Price: 92.62 Smart Investing & Trading Score: 61 | |
| Day Percent Change: 1.22% Day Change: 1.12 | |
| Week Change: 2.24% Year-to-date Change: 7.1% | |
| OMC Links: Profile News Message Board | |
| Charts:- Daily , Weekly | |
| Add OMC to Watchlist: View: Get Complete OMC Trend Analysis ➞ | |
 | BKR Baker Hughes Company |
| Sector: Services & Goods | |
| SubSector: Technical Services | |
| MarketCap: 1330 Millions | |
| Recent Price: 32.59 Smart Investing & Trading Score: 68 | |
| Day Percent Change: 1.21% Day Change: 0.39 | |
| Week Change: -1.39% Year-to-date Change: -4.7% | |
| BKR Links: Profile News Message Board | |
| Charts:- Daily , Weekly | |
| Add BKR to Watchlist: View: Get Complete BKR Trend Analysis ➞ | |
 | EEFT Euronet Worldwide, Inc. |
| Sector: Services & Goods | |
| SubSector: Business Services | |
| MarketCap: 4809.62 Millions | |
| Recent Price: 103.04 Smart Investing & Trading Score: 63 | |
| Day Percent Change: 1.21% Day Change: 1.23 | |
| Week Change: -1.08% Year-to-date Change: 1.5% | |
| EEFT Links: Profile News Message Board | |
| Charts:- Daily , Weekly | |
| Add EEFT to Watchlist: View: Get Complete EEFT Trend Analysis ➞ | |
 | DIN Dine Brands Global, Inc. |
| Sector: Services & Goods | |
| SubSector: Restaurants | |
| MarketCap: 421.17 Millions | |
| Recent Price: 43.35 Smart Investing & Trading Score: 35 | |
| Day Percent Change: 1.21% Day Change: 0.52 | |
| Week Change: 1.24% Year-to-date Change: -12.7% | |
| DIN Links: Profile News Message Board | |
| Charts:- Daily , Weekly | |
| Add DIN to Watchlist: View: Get Complete DIN Trend Analysis ➞ | |
 | MCRI Monarch Casino & Resort, Inc. |
| Sector: Services & Goods | |
| SubSector: Resorts & Casinos | |
| MarketCap: 352.894 Millions | |
| Recent Price: 67.34 Smart Investing & Trading Score: 7 | |
| Day Percent Change: 1.20% Day Change: 0.80 | |
| Week Change: -4.56% Year-to-date Change: -2.6% | |
| MCRI Links: Profile News Message Board | |
| Charts:- Daily , Weekly | |
| Add MCRI to Watchlist: View: Get Complete MCRI Trend Analysis ➞ | |
| For tabular summary view of above stock list: Summary View ➞ 0 - 25 , 25 - 50 , 50 - 75 , 75 - 100 , 100 - 125 , 125 - 150 , 150 - 175 , 175 - 200 , 200 - 225 , 225 - 250 , 250 - 275 , 275 - 300 , 300 - 325 , 325 - 350 , 350 - 375 , 375 - 400 , 400 - 425 , 425 - 450 , 450 - 475 | ||
| Click To Change The Sort Order: By Market Cap or Company Size Performance: Year-to-date, Week and Day | |
| Select Chart Type: | ||
|
Best Stocks Today 12Stocks.com |
© 2024 12Stocks.com Terms & Conditions Privacy Contact Us
All Information Provided Only For Education And Not To Be Used For Investing or Trading. See Terms & Conditions


One More Thing ... Get Best Stocks Delivered Daily!
Never Ever Miss A Move With Our Top Ten Stocks Lists
Find Best Stocks In Any Market - Bull or Bear Market
Take A Peek At Our Top Ten Stocks Lists: Daily, Weekly, Year-to-Date & Top Trends
Find Best Stocks In Any Market - Bull or Bear Market
Take A Peek At Our Top Ten Stocks Lists: Daily, Weekly, Year-to-Date & Top Trends
Consumer Services Stocks With Best Up Trends [0-bearish to 100-bullish]: Gannett Co[100], Gaia [100], Genuine Parts[100], Wendy s[100], Biglari [95], ContextLogic [95], Envestnet [93], MYT Netherlands[93], PaySign [93], Weis Markets[93], FTI Consulting[93]
Best Consumer Services Stocks Year-to-Date:
U Power[2768.3%], Vroom [1713.36%], Yatsen Holding[394.12%], Fluent [294.03%], Codere Online[136.64%], Research[96.15%], Sweetgreen [82.74%], Bright Scholar[60.8%], PaySign [55.71%], RealReal [54.73%], DXP Enterprises[49.76%] Best Consumer Services Stocks This Week:
Yatsen Holding[20.1%], AMC Entertainment[19.25%], Secoo Holding[17.14%], ContextLogic [16.8%], E.W. Scripps[12.19%], TH [11.82%], Genuine Parts[11.7%], Winmark [11.67%], Advance Auto[11.62%], Altisource Portfolio[11.49%], Envestnet [10.52%] Best Consumer Services Stocks Daily:
Lanvin [11.19%], Allego N.V[8.91%], AMC Entertainment[8.22%], Vision Marine[7.40%], Cumulus Media[7.17%], Altisource Portfolio[7.14%], Urban One[6.92%], Bright Scholar[6.91%], Red Robin[6.67%], Entravision [6.06%], MOGU [5.85%]