
 Login Sign Up


| |||||
 |  | ||||

| 12Stocks.com Market Intelligence |
Best Consumer Services Stocks
| In a hurry? Services & Goods Stocks: Performance Trends Table, Stock Charts
Sort Consumer Services: Daily, Weekly, Year-to-Date, Market Cap & Trends. Filter Services & Goods stocks list by size: All Large Mid-Range Small |
| 12Stocks.com Consumer Services Stocks Performances & Trends Daily | |||||||||
|
|  The overall Smart Investing & Trading Score is 100 (0-bearish to 100-bullish) which puts Consumer Services sector in short term bullish trend. The Smart Investing & Trading Score from previous trading session is 100 and an improvement of trend continues.
| ||||||||
Here are the Smart Investing & Trading Scores of the most requested Consumer Services stocks at 12Stocks.com (click stock name for detailed review):
|


| Consider signing up for our daily 12Stocks.com "Best Stocks Newsletter". You will never ever miss a big stock move again! |
| 12Stocks.com: Investing in Consumer Services sector with Stocks | |
|
The following table helps investors and traders sort through current performance and trends (as measured by Smart Investing & Trading Score) of various
stocks in the Consumer Services sector. Quick View: Move mouse or cursor over stock symbol (ticker) to view short-term Technical chart and over stock name to view long term chart. Click on  to add stock symbol to your watchlist and to add stock symbol to your watchlist and  to view watchlist. Click on any ticker or stock name for detailed market intelligence report for that stock. to view watchlist. Click on any ticker or stock name for detailed market intelligence report for that stock. |
12Stocks.com Performance of Stocks in Consumer Services Sector
| Ticker | Stock Name | Watchlist | Category | Recent Price | Smart Investing & Trading Score | Change % | YTD Change% |
| IMKTA | Ingles Markets |   | Grocery | 64.17 | 70 | 1.98 | 1.32% |
| CMPR | Cimpress | | Services | 59.06 | 80 | 1.97 | -15.50% |
| LRN | K12 | | Education | 160.19 | 90 | 1.96 | 52.36% |
| ODP | Office Depot | | Retail | 21.08 | 100 | 1.94 | -10.69% |
| JACK | Jack in | | Restaurants | 20.47 | 70 | 1.93 | -54.53% |
| GAMB | Gambling.com | | Gambling | 8.61 | 0 | 1.91 | -23.22% |
| LAUR | Laureate Education | | Education | 25.91 | 70 | 1.90 | 41.88% |
| PZZA | Papa John | | Restaurants | 47.57 | 90 | 1.89 | 18.52% |
| MCS | Marcus | | Entertainment | 14.94 | 20 | 1.81 | -27.72% |
| BKNG | Booking | | Services | 5454.29 | 30 | 1.80 | 10.07% |
| IPG | Interpublic | | Advertising | 26.09 | 90 | 1.80 | -4.03% |
| VRRM | Verra Mobility | | Security | 24.29 | 30 | 1.79 | 1.74% |
| BKR | Baker Hughes | | Services | 42.80 | 60 | 1.78 | 6.19% |
| PK | Park Hotels | | Lodging | 10.91 | 70 | 1.78 | -16.70% |
| SBH | Sally Beauty | | Retail | 13.38 | 100 | 1.77 | 29.67% |
| BJ | BJ s | | Retail | 103.24 | 0 | 1.75 | 15.76% |
| SIRI | Sirius XM | | Broadcasting | 23.03 | 80 | 1.75 | 1.87% |
| ABM | ABM Industries | | Services | 48.14 | 40 | 1.75 | -1.65% |
| DIN | Dine Brands | | Restaurants | 21.38 | 50 | 1.73 | -26.89% |
| SHAK | Shake Shack | | Restaurants | 106.95 | 0 | 1.72 | -16.71% |
| SBUX | Starbucks | | Restaurants | 90.60 | 20 | 1.70 | 4.50% |
| WSO | Watsco | | Retail | 415.12 | 0 | 1.70 | -7.09% |
| ROST | Ross Stores | | Apparel | 146.94 | 60 | 1.68 | -0.05% |
| CHWY | Chewy | | Retail | 40.49 | 80 | 1.68 | 17.68% |
| ALLE | Allegion | | Security | 167.17 | 70 | 1.66 | 30.81% |
| For chart view version of above stock list: Chart View ➞ 0 - 25 , 25 - 50 , 50 - 75 , 75 - 100 , 100 - 125 , 125 - 150 , 150 - 175 , 175 - 200 , 200 - 225 , 225 - 250 , 250 - 275 , 275 - 300 , 300 - 325 , 325 - 350 , 350 - 375 , 375 - 400 , 400 - 425 | ||
 | Click To Change The Sort Order: By Market Cap or Company Size Performance: Year-to-date, Week and Day |  |
|
Get the most comprehensive stock market coverage daily at 12Stocks.com ➞ Best Stocks Today ➞ Best Stocks Weekly ➞ Best Stocks Year-to-Date ➞ Best Stocks Trends ➞  Best Stocks Today 12Stocks.com Best Nasdaq Stocks ➞ Best S&P 500 Stocks ➞ Best Tech Stocks ➞ Best Biotech Stocks ➞ |
| Detailed Overview of Consumer Services Stocks |
| Consumer Services Technical Overview, Leaders & Laggards, Top Consumer Services ETF Funds & Detailed Consumer Services Stocks List, Charts, Trends & More |
| Consumer Services Sector: Technical Analysis, Trends & YTD Performance | |
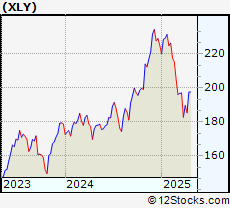
| Consumer Services sector is composed of stocks
from retail, entertainment, media/publishing, consumer goods
and services subsectors. Consumer Services sector, as represented by XLY, an exchange-traded fund [ETF] that holds basket of Consumer Services stocks (e.g, Walmart, Alibaba) is up by 2.95% and is currently underperforming the overall market by -7.38% year-to-date. Below is a quick view of Technical charts and trends: |
|
 XLY Weekly Chart |
|
| Long Term Trend: Very Good | |
| Medium Term Trend: Very Good | |
 XLY Daily Chart |
|
| Short Term Trend: Very Good | |
| Overall Trend Score: 100 | |
| YTD Performance: 2.95% | |
| **Trend Scores & Views Are Only For Educational Purposes And Not For Investing | |
| 12Stocks.com: Top Performing Consumer Services Sector Stocks | ||||||||||||||||||||||||||||||||||||||||||||||
 The top performing Consumer Services sector stocks year to date are
Now, more recently, over last week, the top performing Consumer Services sector stocks on the move are


|
||||||||||||||||||||||||||||||||||||||||||||||
| 12Stocks.com: Investing in Consumer Services Sector using Exchange Traded Funds | |
|
The following table shows list of key exchange traded funds (ETF) that
help investors track Consumer Services Index. For detailed view, check out our ETF Funds section of our website. Quick View: Move mouse or cursor over ETF symbol (ticker) to view short-term Technical chart and over ETF name to view long term chart. Click on ticker or stock name for detailed view. Click on to add stock symbol to your watchlist and to view watchlist. |
12Stocks.com List of ETFs that track Consumer Services Index
| Ticker | ETF Name | Watchlist | Recent Price | Smart Investing & Trading Score | Change % | Week % | Year-to-date % |
| XLY | Consumer Discret Sel | | 229.04 | 100 | 2.01 | 2.86 | 2.95% |
| RTH | Retail | | 247.72 | 100 | 0.63 | 0.8 | 10.46% |
| IYC | Consumer Services | | 102.72 | 100 | 1.68 | 2.04 | 7.35% |
| XRT | Retail | | 83.59 | 100 | 2.54 | 4.47 | 7.4% |
| IYK | Consumer Goods | | 70.21 | 40 | 0.37 | 1.49 | 8.38% |
| UCC | Consumer Services | | 49.53 | 100 | 2.96 | 5.78 | -2.73% |
| RETL | Retail Bull 3X | | 9.42 | 100 | 26.94 | 13.16 | 0.86% |
| RXI | Globl Consumer Discretionary | | 196.05 | 100 | 0.53 | 3.13 | 7.68% |
| SCC | Short Consumer Services | | 16.04 | 0 | -19.86 | -5.49 | -12.44% |
| UGE | Consumer Goods | | 18.79 | 20 | 1.05 | 2.4 | 7.27% |
| 12Stocks.com: Charts, Trends, Fundamental Data and Performances of Consumer Services Stocks | |
|
We now take in-depth look at all Consumer Services stocks including charts, multi-period performances and overall trends (as measured by Smart Investing & Trading Score). One can sort Consumer Services stocks (click link to choose) by Daily, Weekly and by Year-to-Date performances. Also, one can sort by size of the company or by market capitalization. |
| Select Your Default Chart Type: | |||||
| |||||
| Click on stock symbol or name for detailed view. Click on to add stock symbol to your watchlist and to view watchlist. Quick View: Move mouse or cursor over "Daily" to quickly view daily Technical stock chart and over "Weekly" to view weekly Technical stock chart. | |||||

 | IMKTA Ingles Markets, Incorporated |
| Sector: Services & Goods | |
| SubSector: Grocery Stores | |
| MarketCap: 827.075 Millions | |
| Recent Price: 64.17 Smart Investing & Trading Score: 70 | |
| Day Percent Change: 1.98% Day Change: 1.4 | |
| Week Change: 2.27% Year-to-date Change: 1.3% | |
| IMKTA Links: Profile News Message Board | |
| Charts:- Daily , Weekly | |
| Add IMKTA to Watchlist: View: Get Complete IMKTA Trend Analysis ➞ | |
 | CMPR Cimpress plc |
| Sector: Services & Goods | |
| SubSector: Business Services | |
| MarketCap: 1675.02 Millions | |
| Recent Price: 59.06 Smart Investing & Trading Score: 80 | |
| Day Percent Change: 1.97% Day Change: 1.78 | |
| Week Change: 11.32% Year-to-date Change: -15.5% | |
| CMPR Links: Profile News Message Board | |
| Charts:- Daily , Weekly | |
| Add CMPR to Watchlist: View: Get Complete CMPR Trend Analysis ➞ | |
 | LRN K12 Inc. |
| Sector: Services & Goods | |
| SubSector: Education & Training Services | |
| MarketCap: 549.606 Millions | |
| Recent Price: 160.19 Smart Investing & Trading Score: 90 | |
| Day Percent Change: 1.96% Day Change: 1.57 | |
| Week Change: 6.76% Year-to-date Change: 52.4% | |
| LRN Links: Profile News Message Board | |
| Charts:- Daily , Weekly | |
| Add LRN to Watchlist: View: Get Complete LRN Trend Analysis ➞ | |
 | ODP Office Depot, Inc. |
| Sector: Services & Goods | |
| SubSector: Specialty Retail, Other | |
| MarketCap: 1024.44 Millions | |
| Recent Price: 21.08 Smart Investing & Trading Score: 100 | |
| Day Percent Change: 1.94% Day Change: 0.56 | |
| Week Change: 5.73% Year-to-date Change: -10.7% | |
| ODP Links: Profile News Message Board | |
| Charts:- Daily , Weekly | |
| Add ODP to Watchlist: View: Get Complete ODP Trend Analysis ➞ | |
 | JACK Jack in the Box Inc. |
| Sector: Services & Goods | |
| SubSector: Restaurants | |
| MarketCap: 633.87 Millions | |
| Recent Price: 20.47 Smart Investing & Trading Score: 70 | |
| Day Percent Change: 1.93% Day Change: 0.98 | |
| Week Change: -1.43% Year-to-date Change: -54.5% | |
| JACK Links: Profile News Message Board | |
| Charts:- Daily , Weekly | |
| Add JACK to Watchlist: View: Get Complete JACK Trend Analysis ➞ | |
 | GAMB Gambling.com Group Limited |
| Sector: Services & Goods | |
| SubSector: Gambling | |
| MarketCap: 376 Millions | |
| Recent Price: 8.61 Smart Investing & Trading Score: 0 | |
| Day Percent Change: 1.91% Day Change: 0.19 | |
| Week Change: 6.4% Year-to-date Change: -23.2% | |
| GAMB Links: Profile News Message Board | |
| Charts:- Daily , Weekly | |
| Add GAMB to Watchlist: View: Get Complete GAMB Trend Analysis ➞ | |
 | LAUR Laureate Education, Inc. |
| Sector: Services & Goods | |
| SubSector: Education & Training Services | |
| MarketCap: 2258.56 Millions | |
| Recent Price: 25.91 Smart Investing & Trading Score: 70 | |
| Day Percent Change: 1.9% Day Change: 0.29 | |
| Week Change: 6.05% Year-to-date Change: 41.9% | |
| LAUR Links: Profile News Message Board | |
| Charts:- Daily , Weekly | |
| Add LAUR to Watchlist: View: Get Complete LAUR Trend Analysis ➞ | |
 | PZZA Papa John s International, Inc. |
| Sector: Services & Goods | |
| SubSector: Specialty Eateries | |
| MarketCap: 1925.27 Millions | |
| Recent Price: 47.57 Smart Investing & Trading Score: 90 | |
| Day Percent Change: 1.89% Day Change: 0.85 | |
| Week Change: 17.32% Year-to-date Change: 18.5% | |
| PZZA Links: Profile News Message Board | |
| Charts:- Daily , Weekly | |
| Add PZZA to Watchlist: View: Get Complete PZZA Trend Analysis ➞ | |
 | MCS The Marcus Corporation |
| Sector: Services & Goods | |
| SubSector: Entertainment - Diversified | |
| MarketCap: 441.437 Millions | |
| Recent Price: 14.94 Smart Investing & Trading Score: 20 | |
| Day Percent Change: 1.81% Day Change: 0.25 | |
| Week Change: 4.75% Year-to-date Change: -27.7% | |
| MCS Links: Profile News Message Board | |
| Charts:- Daily , Weekly | |
| Add MCS to Watchlist: View: Get Complete MCS Trend Analysis ➞ | |
 | BKNG Booking Holdings Inc. |
| Sector: Services & Goods | |
| SubSector: Business Services | |
| MarketCap: 54467.9 Millions | |
| Recent Price: 5454.29 Smart Investing & Trading Score: 30 | |
| Day Percent Change: 1.8% Day Change: 67.91 | |
| Week Change: -1.6% Year-to-date Change: 10.1% | |
| BKNG Links: Profile News Message Board | |
| Charts:- Daily , Weekly | |
| Add BKNG to Watchlist: View: Get Complete BKNG Trend Analysis ➞ | |
 | IPG The Interpublic Group of Companies, Inc. |
| Sector: Services & Goods | |
| SubSector: Advertising Agencies | |
| MarketCap: 5730.55 Millions | |
| Recent Price: 26.09 Smart Investing & Trading Score: 90 | |
| Day Percent Change: 1.8% Day Change: 0.57 | |
| Week Change: 5.14% Year-to-date Change: -4.0% | |
| IPG Links: Profile News Message Board | |
| Charts:- Daily , Weekly | |
| Add IPG to Watchlist: View: Get Complete IPG Trend Analysis ➞ | |
 | VRRM Verra Mobility Corporation |
| Sector: Services & Goods | |
| SubSector: Security & Protection Services | |
| MarketCap: 1265.03 Millions | |
| Recent Price: 24.29 Smart Investing & Trading Score: 30 | |
| Day Percent Change: 1.79% Day Change: 0.49 | |
| Week Change: -1.44% Year-to-date Change: 1.7% | |
| VRRM Links: Profile News Message Board | |
| Charts:- Daily , Weekly | |
| Add VRRM to Watchlist: View: Get Complete VRRM Trend Analysis ➞ | |
 | BKR Baker Hughes Company |
| Sector: Services & Goods | |
| SubSector: Technical Services | |
| MarketCap: 1330 Millions | |
| Recent Price: 42.80 Smart Investing & Trading Score: 60 | |
| Day Percent Change: 1.78% Day Change: 0.62 | |
| Week Change: -1.34% Year-to-date Change: 6.2% | |
| BKR Links: Profile News Message Board | |
| Charts:- Daily , Weekly | |
| Add BKR to Watchlist: View: Get Complete BKR Trend Analysis ➞ | |
 | PK Park Hotels & Resorts Inc. |
| Sector: Services & Goods | |
| SubSector: Lodging | |
| MarketCap: 2221.06 Millions | |
| Recent Price: 10.91 Smart Investing & Trading Score: 70 | |
| Day Percent Change: 1.78% Day Change: 0.27 | |
| Week Change: 7.92% Year-to-date Change: -16.7% | |
| PK Links: Profile News Message Board | |
| Charts:- Daily , Weekly | |
| Add PK to Watchlist: View: Get Complete PK Trend Analysis ➞ | |
 | SBH Sally Beauty Holdings, Inc. |
| Sector: Services & Goods | |
| SubSector: Specialty Retail, Other | |
| MarketCap: 1229.44 Millions | |
| Recent Price: 13.38 Smart Investing & Trading Score: 100 | |
| Day Percent Change: 1.77% Day Change: 0.23 | |
| Week Change: 12.54% Year-to-date Change: 29.7% | |
| SBH Links: Profile News Message Board | |
| Charts:- Daily , Weekly | |
| Add SBH to Watchlist: View: Get Complete SBH Trend Analysis ➞ | |
 | BJ BJ s Wholesale Club Holdings, Inc. |
| Sector: Services & Goods | |
| SubSector: Discount, Variety Stores | |
| MarketCap: 3346.02 Millions | |
| Recent Price: 103.24 Smart Investing & Trading Score: 0 | |
| Day Percent Change: 1.75% Day Change: 1.42 | |
| Week Change: -4.82% Year-to-date Change: 15.8% | |
| BJ Links: Profile News Message Board | |
| Charts:- Daily , Weekly | |
| Add BJ to Watchlist: View: Get Complete BJ Trend Analysis ➞ | |
 | SIRI Sirius XM Holdings Inc. |
| Sector: Services & Goods | |
| SubSector: Broadcasting - Radio | |
| MarketCap: 21325.5 Millions | |
| Recent Price: 23.03 Smart Investing & Trading Score: 80 | |
| Day Percent Change: 1.75% Day Change: 0.06 | |
| Week Change: 8.24% Year-to-date Change: 1.9% | |
| SIRI Links: Profile News Message Board | |
| Charts:- Daily , Weekly | |
| Add SIRI to Watchlist: View: Get Complete SIRI Trend Analysis ➞ | |
 | ABM ABM Industries Incorporated |
| Sector: Services & Goods | |
| SubSector: Business Services | |
| MarketCap: 1706.72 Millions | |
| Recent Price: 48.14 Smart Investing & Trading Score: 40 | |
| Day Percent Change: 1.75% Day Change: 0.95 | |
| Week Change: 4.52% Year-to-date Change: -1.7% | |
| ABM Links: Profile News Message Board | |
| Charts:- Daily , Weekly | |
| Add ABM to Watchlist: View: Get Complete ABM Trend Analysis ➞ | |
 | DIN Dine Brands Global, Inc. |
| Sector: Services & Goods | |
| SubSector: Restaurants | |
| MarketCap: 421.17 Millions | |
| Recent Price: 21.38 Smart Investing & Trading Score: 50 | |
| Day Percent Change: 1.73% Day Change: 0.56 | |
| Week Change: 3.63% Year-to-date Change: -26.9% | |
| DIN Links: Profile News Message Board | |
| Charts:- Daily , Weekly | |
| Add DIN to Watchlist: View: Get Complete DIN Trend Analysis ➞ | |
 | SHAK Shake Shack Inc. |
| Sector: Services & Goods | |
| SubSector: Specialty Eateries | |
| MarketCap: 1497.67 Millions | |
| Recent Price: 106.95 Smart Investing & Trading Score: 0 | |
| Day Percent Change: 1.72% Day Change: 1.84 | |
| Week Change: -4.3% Year-to-date Change: -16.7% | |
| SHAK Links: Profile News Message Board | |
| Charts:- Daily , Weekly | |
| Add SHAK to Watchlist: View: Get Complete SHAK Trend Analysis ➞ | |
 | SBUX Starbucks Corporation |
| Sector: Services & Goods | |
| SubSector: Specialty Eateries | |
| MarketCap: 74909.7 Millions | |
| Recent Price: 90.60 Smart Investing & Trading Score: 20 | |
| Day Percent Change: 1.7% Day Change: 1.57 | |
| Week Change: 5.83% Year-to-date Change: 4.5% | |
| SBUX Links: Profile News Message Board | |
| Charts:- Daily , Weekly | |
| Add SBUX to Watchlist: View: Get Complete SBUX Trend Analysis ➞ | |
 | WSO Watsco, Inc. |
| Sector: Services & Goods | |
| SubSector: Electronics Wholesale | |
| MarketCap: 6000.33 Millions | |
| Recent Price: 415.12 Smart Investing & Trading Score: 0 | |
| Day Percent Change: 1.7% Day Change: 8.14 | |
| Week Change: 3.48% Year-to-date Change: -7.1% | |
| WSO Links: Profile News Message Board | |
| Charts:- Daily , Weekly | |
| Add WSO to Watchlist: View: Get Complete WSO Trend Analysis ➞ | |
 | ROST Ross Stores, Inc. |
| Sector: Services & Goods | |
| SubSector: Apparel Stores | |
| MarketCap: 24938.8 Millions | |
| Recent Price: 146.94 Smart Investing & Trading Score: 60 | |
| Day Percent Change: 1.68% Day Change: 2.56 | |
| Week Change: 2.55% Year-to-date Change: -0.1% | |
| ROST Links: Profile News Message Board | |
| Charts:- Daily , Weekly | |
| Add ROST to Watchlist: View: Get Complete ROST Trend Analysis ➞ | |
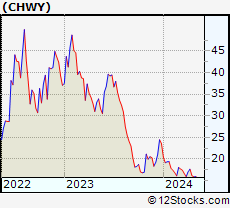 | CHWY Chewy, Inc. |
| Sector: Services & Goods | |
| SubSector: Specialty Retail, Other | |
| MarketCap: 14226.4 Millions | |
| Recent Price: 40.49 Smart Investing & Trading Score: 80 | |
| Day Percent Change: 1.68% Day Change: 0.44 | |
| Week Change: 13.44% Year-to-date Change: 17.7% | |
| CHWY Links: Profile News Message Board | |
| Charts:- Daily , Weekly | |
| Add CHWY to Watchlist: View: Get Complete CHWY Trend Analysis ➞ | |
 | ALLE Allegion plc |
| Sector: Services & Goods | |
| SubSector: Security & Protection Services | |
| MarketCap: 8515.93 Millions | |
| Recent Price: 167.17 Smart Investing & Trading Score: 70 | |
| Day Percent Change: 1.66% Day Change: 2.24 | |
| Week Change: 3.12% Year-to-date Change: 30.8% | |
| ALLE Links: Profile News Message Board | |
| Charts:- Daily , Weekly | |
| Add ALLE to Watchlist: View: Get Complete ALLE Trend Analysis ➞ | |
| For tabular summary view of above stock list: Summary View ➞ 0 - 25 , 25 - 50 , 50 - 75 , 75 - 100 , 100 - 125 , 125 - 150 , 150 - 175 , 175 - 200 , 200 - 225 , 225 - 250 , 250 - 275 , 275 - 300 , 300 - 325 , 325 - 350 , 350 - 375 , 375 - 400 , 400 - 425 | ||
| Click To Change The Sort Order: By Market Cap or Company Size Performance: Year-to-date, Week and Day | |
| Select Chart Type: | ||
|
Best Stocks Today 12Stocks.com |
© 2025 12Stocks.com Terms & Conditions Privacy Contact Us
All Information Provided Only For Education And Not To Be Used For Investing or Trading. See Terms & Conditions


One More Thing ... Get Best Stocks Delivered Daily!
Never Ever Miss A Move With Our Top Ten Stocks Lists
Find Best Stocks In Any Market - Bull or Bear Market
Take A Peek At Our Top Ten Stocks Lists: Daily, Weekly, Year-to-Date & Top Trends
Find Best Stocks In Any Market - Bull or Bear Market
Take A Peek At Our Top Ten Stocks Lists: Daily, Weekly, Year-to-Date & Top Trends
Consumer Services Stocks With Best Up Trends [0-bearish to 100-bullish]: Louisiana-Pacific [100], eBay [100], Graham [100], Fastenal [100], Wayfair [100], Gaia [100], Gray Television[100], Haverty Furniture[100], RealReal [100], Resideo Technologies[100], Holley [100]
Best Consumer Services Stocks Year-to-Date:
MedEquities Realty[294856%], WW [2516.54%], ThredUp [656.12%], Willdan [210.66%], Kratos Defense[160.61%], IHS Holding[134.93%], Yatsen Holding[133.67%], National Vision[122.84%], Roblox [119.12%], Altisource Portfolio[97.94%], Jumia Technologies[95.29%] Best Consumer Services Stocks This Week:
MedEquities Realty[411381%], Jumia Technologies[62.88%], Money[56.67%], Brilliant Earth[44.93%], Holley [35.82%], RealReal [35.65%], Willdan [34.44%], ATRenew [33.14%], Gray Television[33.03%], Arhaus [28.98%], Park-Ohio [27.27%] Best Consumer Services Stocks Daily:
CareDx [185.69%], Wingstop [150.46%], Spotify Technology[147.52%], National CineMedia[112.46%], VSE [69.41%], Burlington Stores[66.03%], Myriad Genetics[64.88%], Costco Wholesale[58.1%], Daily Journal[57.5%], Texas Roadhouse[55.27%], Royal Caribbean[53.63%]