
 Login Sign Up


| |||||
 |  | ||||

| 12Stocks.com Market Intelligence |
Best Consumer Services Stocks
| In a hurry? Services & Goods Stocks: Performance Trends Table, Stock Charts
Sort Consumer Services: Daily, Weekly, Year-to-Date, Market Cap & Trends. Filter Services & Goods stocks list by size: All Large Mid-Range Small |
| 12Stocks.com Consumer Services Stocks Performances & Trends Daily | |||||||||
|
|  The overall Smart Investing & Trading Score is 90 (0-bearish to 100-bullish) which puts Consumer Services sector in short term bullish trend. The Smart Investing & Trading Score from previous trading session is 50 and hence an improvement of trend.
| ||||||||
Here are the Smart Investing & Trading Scores of the most requested Consumer Services stocks at 12Stocks.com (click stock name for detailed review):
|


| Consider signing up for our daily 12Stocks.com "Best Stocks Newsletter". You will never ever miss a big stock move again! |
| 12Stocks.com: Investing in Consumer Services sector with Stocks | |
|
The following table helps investors and traders sort through current performance and trends (as measured by Smart Investing & Trading Score) of various
stocks in the Consumer Services sector. Quick View: Move mouse or cursor over stock symbol (ticker) to view short-term Technical chart and over stock name to view long term chart. Click on  to add stock symbol to your watchlist and to add stock symbol to your watchlist and  to view watchlist. Click on any ticker or stock name for detailed market intelligence report for that stock. to view watchlist. Click on any ticker or stock name for detailed market intelligence report for that stock. |
12Stocks.com Performance of Stocks in Consumer Services Sector
| Ticker | Stock Name | Watchlist | Category | Recent Price | Smart Investing & Trading Score | Change % | Weekly Change% |
| NCMI | National CineMedia |   | Marketing | 4.65 | 50 | 112.46% | 2.42% |
| LQDT | Liquidity Services | | Retail | 24.99 | 70 | 22.37% | 2.38% |
| PAG | Penske Automotive | | Automobile | 180.96 | 90 | 2.34% | 2.28% |
| VIPS | Vipshop | | Retail | 15.70 | 80 | 1.32% | 2.28% |
| TNET | TriNet | | Services | 64.47 | 40 | 4.08% | 2.28% |
| ANF | Abercrombie & Fitch Co | | Apparel | 101.64 | 40 | 2.60% | 2.27% |
| FOXA | Fox | | Entertainment | 56.13 | 60 | 0.60% | 2.26% |
| REYN | Reynolds Consumer | | Packaging | 22.67 | 50 | 10.47% | 2.26% |
| TAL | TAL Education | | Education | 11.38 | 50 | 0.35% | 2.25% |
| ASO | Academy Sports | | Specialty Retail | 52.02 | 70 | -1.65% | 2.24% |
| TIME | Time | | Publishing | 26.02 | 70 | 0.00% | 2.22% |
| CARS | Cars.com | | Automobile | 12.91 | 50 | 5.98% | 2.22% |
| PSMT | PriceSmart | | Retail | 111.45 | 60 | 3.27% | 2.21% |
| WCC | WESCO | | Equipment | 211.27 | 70 | 3.10% | 2.19% |
| ABG | Asbury Automotive | | Automobile | 234.10 | 70 | 4.90% | 2.16% |
| FOX | Twenty-First Century | | Entertainment | 51.15 | 50 | 0.66% | 2.16% |
| IPG | Interpublic | | Advertising | 25.27 | 50 | 1.80% | 2.14% |
| MAR | Marriott | | Lodging | 265.01 | 50 | 0.74% | 2.04% |
| HGV | Hilton Grand | | Casinos | 44.97 | 50 | -17.38% | 2.00% |
| RUSHA | Rush Enterprises | | Automobile | 57.39 | 100 | -16.32% | 1.98% |
| PK | Park Hotels | | Lodging | 10.66 | 70 | 1.78% | 1.91% |
| RBLX | Roblox | | Electronic Gaming & Multimedia | 129.53 | 40 | 0.96% | 1.90% |
| CUK | Carnival | | Entertainment | 27.27 | 80 | 7.93% | 1.87% |
| YUM | Yum! Brands | | Restaurants | 142.09 | 0 | 1.03% | 1.86% |
| KFY | Korn Ferry | | Staffing | 71.75 | 50 | 3.15% | 1.83% |
| For chart view version of above stock list: Chart View ➞ 0 - 25 , 25 - 50 , 50 - 75 , 75 - 100 , 100 - 125 , 125 - 150 , 150 - 175 , 175 - 200 , 200 - 225 , 225 - 250 , 250 - 275 , 275 - 300 , 300 - 325 , 325 - 350 , 350 - 375 | ||
 | Click To Change The Sort Order: By Market Cap or Company Size Performance: Year-to-date, Week and Day |  |
|
Get the most comprehensive stock market coverage daily at 12Stocks.com ➞ Best Stocks Today ➞ Best Stocks Weekly ➞ Best Stocks Year-to-Date ➞ Best Stocks Trends ➞  Best Stocks Today 12Stocks.com Best Nasdaq Stocks ➞ Best S&P 500 Stocks ➞ Best Tech Stocks ➞ Best Biotech Stocks ➞ |
| Detailed Overview of Consumer Services Stocks |
| Consumer Services Technical Overview, Leaders & Laggards, Top Consumer Services ETF Funds & Detailed Consumer Services Stocks List, Charts, Trends & More |
| Consumer Services Sector: Technical Analysis, Trends & YTD Performance | |
| Consumer Services sector is composed of stocks
from retail, entertainment, media/publishing, consumer goods
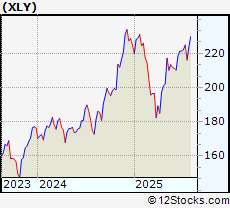
and services subsectors. Consumer Services sector, as represented by XLY, an exchange-traded fund [ETF] that holds basket of Consumer Services stocks (e.g, Walmart, Alibaba) is up by 1.56% and is currently underperforming the overall market by -8.24% year-to-date. Below is a quick view of Technical charts and trends: |
|
 XLY Weekly Chart |
|
| Long Term Trend: Very Good | |
| Medium Term Trend: Very Good | |
 XLY Daily Chart |
|
| Short Term Trend: Very Good | |
| Overall Trend Score: 90 | |
| YTD Performance: 1.56% | |
| **Trend Scores & Views Are Only For Educational Purposes And Not For Investing | |
| 12Stocks.com: Top Performing Consumer Services Sector Stocks | ||||||||||||||||||||||||||||||||||||||||||||||||
 The top performing Consumer Services sector stocks year to date are
Now, more recently, over last week, the top performing Consumer Services sector stocks on the move are


|
||||||||||||||||||||||||||||||||||||||||||||||||
| 12Stocks.com: Investing in Consumer Services Sector using Exchange Traded Funds | |
|
The following table shows list of key exchange traded funds (ETF) that
help investors track Consumer Services Index. For detailed view, check out our ETF Funds section of our website. Quick View: Move mouse or cursor over ETF symbol (ticker) to view short-term Technical chart and over ETF name to view long term chart. Click on ticker or stock name for detailed view. Click on to add stock symbol to your watchlist and to view watchlist. |
12Stocks.com List of ETFs that track Consumer Services Index
| Ticker | ETF Name | Watchlist | Recent Price | Smart Investing & Trading Score | Change % | Week % | Year-to-date % |
| XLY | Consumer Discret Sel | | 226.74 | 90 | 2.01 | 3.58 | 1.56% |
| RTH | Retail | | 245.88 | 90 | 0.63 | 2.04 | 9.67% |
| IYC | Consumer Services | | 101.87 | 90 | 1.68 | 2.71 | 6.29% |
| XRT | Retail | | 83.23 | 90 | 2.54 | 4.59 | 5.13% |
| IYK | Consumer Goods | | 70.15 | 40 | 0.37 | 1.9 | 8.01% |
| UCC | Consumer Services | | 48.63 | 90 | 2.96 | 7 | -5.38% |
| RETL | Retail Bull 3X | | 9.28 | 90 | 26.94 | 13.31 | -5.36% |
| SCC | Short Consumer Services | | 16.35 | 0 | -19.86 | -6.67 | -9.94% |
| UGE | Consumer Goods | | 19.12 | 50 | 1.05 | 5.18 | 6.94% |
| 12Stocks.com: Charts, Trends, Fundamental Data and Performances of Consumer Services Stocks | |
|
We now take in-depth look at all Consumer Services stocks including charts, multi-period performances and overall trends (as measured by Smart Investing & Trading Score). One can sort Consumer Services stocks (click link to choose) by Daily, Weekly and by Year-to-Date performances. Also, one can sort by size of the company or by market capitalization. |
| Select Your Default Chart Type: | |||||
| |||||
| Click on stock symbol or name for detailed view. Click on to add stock symbol to your watchlist and to view watchlist. Quick View: Move mouse or cursor over "Daily" to quickly view daily Technical stock chart and over "Weekly" to view weekly Technical stock chart. | |||||

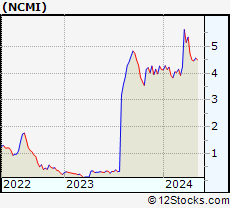 | NCMI National CineMedia, Inc. |
| Sector: Services & Goods | |
| SubSector: Marketing Services | |
| MarketCap: 298.015 Millions | |
| Recent Price: 4.65 Smart Investing & Trading Score: 50 | |
| Day Percent Change: 112.46% Day Change: 3.66 | |
| Week Change: 2.42% Year-to-date Change: -29.2% | |
| NCMI Links: Profile News Message Board | |
| Charts:- Daily , Weekly | |
| Add NCMI to Watchlist: View: Get Complete NCMI Trend Analysis ➞ | |
 | LQDT Liquidity Services, Inc. |
| Sector: Services & Goods | |
| SubSector: Catalog & Mail Order Houses | |
| MarketCap: 144.492 Millions | |
| Recent Price: 24.99 Smart Investing & Trading Score: 70 | |
| Day Percent Change: 22.37% Day Change: 4.1 | |
| Week Change: 2.38% Year-to-date Change: -22.6% | |
| LQDT Links: Profile News Message Board | |
| Charts:- Daily , Weekly | |
| Add LQDT to Watchlist: View: Get Complete LQDT Trend Analysis ➞ | |
 | PAG Penske Automotive Group, Inc. |
| Sector: Services & Goods | |
| SubSector: Auto Dealerships | |
| MarketCap: 2088.81 Millions | |
| Recent Price: 180.96 Smart Investing & Trading Score: 90 | |
| Day Percent Change: 2.34% Day Change: 3.88 | |
| Week Change: 2.28% Year-to-date Change: 20.5% | |
| PAG Links: Profile News Message Board | |
| Charts:- Daily , Weekly | |
| Add PAG to Watchlist: View: Get Complete PAG Trend Analysis ➞ | |
 | VIPS Vipshop Holdings Limited |
| Sector: Services & Goods | |
| SubSector: Catalog & Mail Order Houses | |
| MarketCap: 10496.2 Millions | |
| Recent Price: 15.70 Smart Investing & Trading Score: 80 | |
| Day Percent Change: 1.32% Day Change: 0.16 | |
| Week Change: 2.28% Year-to-date Change: 21.0% | |
| VIPS Links: Profile News Message Board | |
| Charts:- Daily , Weekly | |
| Add VIPS to Watchlist: View: Get Complete VIPS Trend Analysis ➞ | |
 | TNET TriNet Group, Inc. |
| Sector: Services & Goods | |
| SubSector: Business Services | |
| MarketCap: 2648.72 Millions | |
| Recent Price: 64.47 Smart Investing & Trading Score: 40 | |
| Day Percent Change: 4.08% Day Change: 4.02 | |
| Week Change: 2.28% Year-to-date Change: -28.3% | |
| TNET Links: Profile News Message Board | |
| Charts:- Daily , Weekly | |
| Add TNET to Watchlist: View: Get Complete TNET Trend Analysis ➞ | |
 | ANF Abercrombie & Fitch Co. |
| Sector: Services & Goods | |
| SubSector: Apparel Stores | |
| MarketCap: 589.108 Millions | |
| Recent Price: 101.64 Smart Investing & Trading Score: 40 | |
| Day Percent Change: 2.6% Day Change: 4.3 | |
| Week Change: 2.27% Year-to-date Change: -32.0% | |
| ANF Links: Profile News Message Board | |
| Charts:- Daily , Weekly | |
| Add ANF to Watchlist: View: Get Complete ANF Trend Analysis ➞ | |
 | FOXA Fox Corporation |
| Sector: Services & Goods | |
| SubSector: Entertainment - Diversified | |
| MarketCap: 13440.7 Millions | |
| Recent Price: 56.13 Smart Investing & Trading Score: 60 | |
| Day Percent Change: 0.6% Day Change: 0.24 | |
| Week Change: 2.26% Year-to-date Change: 16.1% | |
| FOXA Links: Profile News Message Board | |
| Charts:- Daily , Weekly | |
| Add FOXA to Watchlist: View: Get Complete FOXA Trend Analysis ➞ | |
 | REYN Reynolds Consumer Products Inc. |
| Sector: Services & Goods | |
| SubSector: Packaging & Containers | |
| MarketCap: 62927 Millions | |
| Recent Price: 22.67 Smart Investing & Trading Score: 50 | |
| Day Percent Change: 10.47% Day Change: 2.91 | |
| Week Change: 2.26% Year-to-date Change: -15.2% | |
| REYN Links: Profile News Message Board | |
| Charts:- Daily , Weekly | |
| Add REYN to Watchlist: View: Get Complete REYN Trend Analysis ➞ | |
 | TAL TAL Education Group |
| Sector: Services & Goods | |
| SubSector: Education & Training Services | |
| MarketCap: 30103.1 Millions | |
| Recent Price: 11.38 Smart Investing & Trading Score: 50 | |
| Day Percent Change: 0.35% Day Change: 0.03 | |
| Week Change: 2.25% Year-to-date Change: 13.6% | |
| TAL Links: Profile News Message Board | |
| Charts:- Daily , Weekly | |
| Add TAL to Watchlist: View: Get Complete TAL Trend Analysis ➞ | |
 | ASO Academy Sports and Outdoors, Inc. |
| Sector: Services & Goods | |
| SubSector: Specialty Retail | |
| MarketCap: 16027 Millions | |
| Recent Price: 52.02 Smart Investing & Trading Score: 70 | |
| Day Percent Change: -1.65% Day Change: -0.91 | |
| Week Change: 2.24% Year-to-date Change: -9.3% | |
| ASO Links: Profile News Message Board | |
| Charts:- Daily , Weekly | |
| Add ASO to Watchlist: View: Get Complete ASO Trend Analysis ➞ | |
 | TIME Time Inc. |
| Sector: Services & Goods | |
| SubSector: Publishing - Periodicals | |
| MarketCap: 1884.61 Millions | |
| Recent Price: 26.02 Smart Investing & Trading Score: 70 | |
| Day Percent Change: 0% Day Change: 0 | |
| Week Change: 2.22% Year-to-date Change: 4.8% | |
| TIME Links: Profile News Message Board | |
| Charts:- Daily , Weekly | |
| Add TIME to Watchlist: View: Get Complete TIME Trend Analysis ➞ | |
 | CARS Cars.com Inc. |
| Sector: Services & Goods | |
| SubSector: Auto Dealerships | |
| MarketCap: 290.321 Millions | |
| Recent Price: 12.91 Smart Investing & Trading Score: 50 | |
| Day Percent Change: 5.98% Day Change: 1.03 | |
| Week Change: 2.22% Year-to-date Change: -25.5% | |
| CARS Links: Profile News Message Board | |
| Charts:- Daily , Weekly | |
| Add CARS to Watchlist: View: Get Complete CARS Trend Analysis ➞ | |
 | PSMT PriceSmart, Inc. |
| Sector: Services & Goods | |
| SubSector: Discount, Variety Stores | |
| MarketCap: 1655.72 Millions | |
| Recent Price: 111.45 Smart Investing & Trading Score: 60 | |
| Day Percent Change: 3.27% Day Change: 2.83 | |
| Week Change: 2.21% Year-to-date Change: 21.8% | |
| PSMT Links: Profile News Message Board | |
| Charts:- Daily , Weekly | |
| Add PSMT to Watchlist: View: Get Complete PSMT Trend Analysis ➞ | |
 | WCC WESCO International, Inc. |
| Sector: Services & Goods | |
| SubSector: Industrial Equipment Wholesale | |
| MarketCap: 824.358 Millions | |
| Recent Price: 211.27 Smart Investing & Trading Score: 70 | |
| Day Percent Change: 3.1% Day Change: 4.96 | |
| Week Change: 2.19% Year-to-date Change: 17.4% | |
| WCC Links: Profile News Message Board | |
| Charts:- Daily , Weekly | |
| Add WCC to Watchlist: View: Get Complete WCC Trend Analysis ➞ | |
 | ABG Asbury Automotive Group, Inc. |
| Sector: Services & Goods | |
| SubSector: Auto Dealerships | |
| MarketCap: 1203.21 Millions | |
| Recent Price: 234.10 Smart Investing & Trading Score: 70 | |
| Day Percent Change: 4.9% Day Change: 11.28 | |
| Week Change: 2.16% Year-to-date Change: -3.7% | |
| ABG Links: Profile News Message Board | |
| Charts:- Daily , Weekly | |
| Add ABG to Watchlist: View: Get Complete ABG Trend Analysis ➞ | |
 | FOX Twenty-First Century Fox, Inc. |
| Sector: Services & Goods | |
| SubSector: Entertainment - Diversified | |
| MarketCap: 24211.2 Millions | |
| Recent Price: 51.15 Smart Investing & Trading Score: 50 | |
| Day Percent Change: 0.66% Day Change: 0.25 | |
| Week Change: 2.16% Year-to-date Change: 12.4% | |
| FOX Links: Profile News Message Board | |
| Charts:- Daily , Weekly | |
| Add FOX to Watchlist: View: Get Complete FOX Trend Analysis ➞ | |
 | IPG The Interpublic Group of Companies, Inc. |
| Sector: Services & Goods | |
| SubSector: Advertising Agencies | |
| MarketCap: 5730.55 Millions | |
| Recent Price: 25.27 Smart Investing & Trading Score: 50 | |
| Day Percent Change: 1.8% Day Change: 0.57 | |
| Week Change: 2.14% Year-to-date Change: -7.4% | |
| IPG Links: Profile News Message Board | |
| Charts:- Daily , Weekly | |
| Add IPG to Watchlist: View: Get Complete IPG Trend Analysis ➞ | |
 | MAR Marriott International, Inc. |
| Sector: Services & Goods | |
| SubSector: Lodging | |
| MarketCap: 25831.6 Millions | |
| Recent Price: 265.01 Smart Investing & Trading Score: 50 | |
| Day Percent Change: 0.74% Day Change: 1.65 | |
| Week Change: 2.04% Year-to-date Change: -4.5% | |
| MAR Links: Profile News Message Board | |
| Charts:- Daily , Weekly | |
| Add MAR to Watchlist: View: Get Complete MAR Trend Analysis ➞ | |
 | HGV Hilton Grand Vacations Inc. |
| Sector: Services & Goods | |
| SubSector: Resorts & Casinos | |
| MarketCap: 1333.04 Millions | |
| Recent Price: 44.97 Smart Investing & Trading Score: 50 | |
| Day Percent Change: -17.38% Day Change: -8.06 | |
| Week Change: 2% Year-to-date Change: 15.5% | |
| HGV Links: Profile News Message Board | |
| Charts:- Daily , Weekly | |
| Add HGV to Watchlist: View: Get Complete HGV Trend Analysis ➞ | |
 | RUSHA Rush Enterprises, Inc. |
| Sector: Services & Goods | |
| SubSector: Auto Dealerships | |
| MarketCap: 1183.21 Millions | |
| Recent Price: 57.39 Smart Investing & Trading Score: 100 | |
| Day Percent Change: -16.32% Day Change: -10.46 | |
| Week Change: 1.98% Year-to-date Change: 5.8% | |
| RUSHA Links: Profile News Message Board | |
| Charts:- Daily , Weekly | |
| Add RUSHA to Watchlist: View: Get Complete RUSHA Trend Analysis ➞ | |
 | PK Park Hotels & Resorts Inc. |
| Sector: Services & Goods | |
| SubSector: Lodging | |
| MarketCap: 2221.06 Millions | |
| Recent Price: 10.66 Smart Investing & Trading Score: 70 | |
| Day Percent Change: 1.78% Day Change: 0.27 | |
| Week Change: 1.91% Year-to-date Change: -22.5% | |
| PK Links: Profile News Message Board | |
| Charts:- Daily , Weekly | |
| Add PK to Watchlist: View: Get Complete PK Trend Analysis ➞ | |
 | RBLX Roblox Corporation |
| Sector: Services & Goods | |
| SubSector: Electronic Gaming & Multimedia | |
| MarketCap: 25420 Millions | |
| Recent Price: 129.53 Smart Investing & Trading Score: 40 | |
| Day Percent Change: 0.96% Day Change: 0.42 | |
| Week Change: 1.9% Year-to-date Change: 123.9% | |
| RBLX Links: Profile News Message Board | |
| Charts:- Daily , Weekly | |
| Add RBLX to Watchlist: View: Get Complete RBLX Trend Analysis ➞ | |
 | CUK Carnival Corporation & Plc |
| Sector: Services & Goods | |
| SubSector: General Entertainment | |
| MarketCap: 10703.9 Millions | |
| Recent Price: 27.27 Smart Investing & Trading Score: 80 | |
| Day Percent Change: 7.93% Day Change: 1.11 | |
| Week Change: 1.87% Year-to-date Change: 21.2% | |
| CUK Links: Profile News Message Board | |
| Charts:- Daily , Weekly | |
| Add CUK to Watchlist: View: Get Complete CUK Trend Analysis ➞ | |
 | YUM Yum! Brands, Inc. |
| Sector: Services & Goods | |
| SubSector: Restaurants | |
| MarketCap: 18033.3 Millions | |
| Recent Price: 142.09 Smart Investing & Trading Score: 0 | |
| Day Percent Change: 1.03% Day Change: 1.38 | |
| Week Change: 1.86% Year-to-date Change: 6.9% | |
| YUM Links: Profile News Message Board | |
| Charts:- Daily , Weekly | |
| Add YUM to Watchlist: View: Get Complete YUM Trend Analysis ➞ | |
 | KFY Korn Ferry |
| Sector: Services & Goods | |
| SubSector: Staffing & Outsourcing Services | |
| MarketCap: 1534.28 Millions | |
| Recent Price: 71.75 Smart Investing & Trading Score: 50 | |
| Day Percent Change: 3.15% Day Change: 2.2 | |
| Week Change: 1.83% Year-to-date Change: 7.8% | |
| KFY Links: Profile News Message Board | |
| Charts:- Daily , Weekly | |
| Add KFY to Watchlist: View: Get Complete KFY Trend Analysis ➞ | |
| For tabular summary view of above stock list: Summary View ➞ 0 - 25 , 25 - 50 , 50 - 75 , 75 - 100 , 100 - 125 , 125 - 150 , 150 - 175 , 175 - 200 , 200 - 225 , 225 - 250 , 250 - 275 , 275 - 300 , 300 - 325 , 325 - 350 , 350 - 375 | ||
| Click To Change The Sort Order: By Market Cap or Company Size Performance: Year-to-date, Week and Day | |
| Select Chart Type: | ||
|
Best Stocks Today 12Stocks.com |
© 2025 12Stocks.com Terms & Conditions Privacy Contact Us
All Information Provided Only For Education And Not To Be Used For Investing or Trading. See Terms & Conditions


One More Thing ... Get Best Stocks Delivered Daily!
Never Ever Miss A Move With Our Top Ten Stocks Lists
Find Best Stocks In Any Market - Bull or Bear Market
Take A Peek At Our Top Ten Stocks Lists: Daily, Weekly, Year-to-Date & Top Trends
Find Best Stocks In Any Market - Bull or Bear Market
Take A Peek At Our Top Ten Stocks Lists: Daily, Weekly, Year-to-Date & Top Trends
Consumer Services Stocks With Best Up Trends [0-bearish to 100-bullish]: VSE [100], eBay [100], Kratos Defense[100], Graham [100], CompX [100], Fastenal [100], Jacobs Engineering[100], Willdan [100], Gray Television[100], Williams-Sonoma [100], Rush Enterprises[100]
Best Consumer Services Stocks Year-to-Date:
ThredUp [640.29%], Vivid Seats[278.19%], Willdan [211.45%], Kratos Defense[162.09%], Roblox [123.87%], National Vision[120.92%], Altisource Portfolio[99.84%], Noodles & [90.05%], Gray Television[89.96%], QuantumScape [80.15%], PaySign [80.13%] Best Consumer Services Stocks This Week:
Vivid Seats[1616.67%], Holley [66.18%], Money[64.55%], Myriad Genetics[55.81%], Grocery Outlet[42.09%], RealReal [33.98%], CompX [30.87%], Willdan [30.08%], comScore [29.36%], Arhaus [27.48%], Gray Television[26.37%] Best Consumer Services Stocks Daily:
CareDx [185.69%], Wingstop [150.46%], National CineMedia[112.46%], VSE [69.41%], Burlington Stores[66.03%], Myriad Genetics[64.88%], Costco Wholesale[58.1%], Daily Journal[57.5%], Texas Roadhouse[55.27%], Royal Caribbean[53.63%], CRA [53.26%]