
 Login Sign Up


| |||||
 |  | ||||

| 12Stocks.com Market Intelligence |
Best Consumer Services Stocks
| In a hurry? Services & Goods Stocks: Performance Trends Table, Stock Charts
Sort Consumer Services: Daily, Weekly, Year-to-Date, Market Cap & Trends. Filter Services & Goods stocks list by size: All Large Mid-Range Small |
| 12Stocks.com Consumer Services Stocks Performances & Trends Daily | |||||||||
|
|  The overall Smart Investing & Trading Score is 100 (0-bearish to 100-bullish) which puts Consumer Services sector in short term bullish trend. The Smart Investing & Trading Score from previous trading session is 100 and an improvement of trend continues.
| ||||||||
Here are the Smart Investing & Trading Scores of the most requested Consumer Services stocks at 12Stocks.com (click stock name for detailed review):
|


| Consider signing up for our daily 12Stocks.com "Best Stocks Newsletter". You will never ever miss a big stock move again! |
| 12Stocks.com: Investing in Consumer Services sector with Stocks | |
|
The following table helps investors and traders sort through current performance and trends (as measured by Smart Investing & Trading Score) of various
stocks in the Consumer Services sector. Quick View: Move mouse or cursor over stock symbol (ticker) to view short-term Technical chart and over stock name to view long term chart. Click on  to add stock symbol to your watchlist and to add stock symbol to your watchlist and  to view watchlist. Click on any ticker or stock name for detailed market intelligence report for that stock. to view watchlist. Click on any ticker or stock name for detailed market intelligence report for that stock. |
12Stocks.com Performance of Stocks in Consumer Services Sector
| Ticker | Stock Name | Watchlist | Category | Recent Price | Smart Investing & Trading Score | Change % | YTD Change% |
| VLGEA | Village Super |   | Grocery | 35.24 | 40 | 3.83 | 16.31% |
| DXPE | DXP Enterprises | | Equipment | 116.96 | 60 | 3.67 | 44.98% |
| ONEW | OneWater Marine | | Recreational | 17.12 | 100 | 3.67 | -0.17% |
| HCSG | Healthcare Services | | Services | 15.02 | 90 | 3.66 | 31.47% |
| EAT | Brinker | | Restaurants | 158.16 | 50 | 3.60 | 18.97% |
| SCVL | Shoe Carnival | | Apparel | 20.72 | 60 | 3.54 | -33.91% |
| CHGG | Chegg | | Education | 1.23 | 70 | 3.50 | -20.50% |
| FC | Franklin Covey | | Education | 19.35 | 30 | 3.48 | -47.63% |
| INCR | Research | | Research | 1.63 | 70 | 3.43 | 3.14% |
| ETSY | Etsy | | Retail | 66.43 | 70 | 3.33 | 32.52% |
| SIG | Signet Jewelers | | Retail | 81.98 | 80 | 3.32 | 4.64% |
| PSMT | PriceSmart | | Retail | 108.95 | 40 | 3.27 | 23.85% |
| SVV | Savers Value | | Specialty Retail | 11.30 | 73 | 3.22 | 12.78% |
| KFY | Korn Ferry | | Staffing | 72.46 | 60 | 3.15 | 11.98% |
| BABA | Alibaba | | Retail | 121.26 | 60 | 3.13 | 50.81% |
| WCC | WESCO | | Equipment | 206.22 | 40 | 3.10 | 19.69% |
| FYBR | Frontier | | Telecom Services | 37.11 | 90 | 3.10 | 6.86% |
| ONON | On Holding | | Footwear & Accessories | 45.34 | 43 | 3.10 | -12.01% |
| BJRI | BJ s | | Restaurants | 35.11 | 50 | 3.08 | 2.63% |
| NEWT | Newtek Business | | Services | 12.03 | 80 | 3.05 | -0.29% |
| TBLA | Taboola.com | | Internet Content & Information | 3.32 | 50 | 3.05 | -9.32% |
| URBN | Urban Outfitters | | Apparel | 77.53 | 50 | 3.02 | 44.84% |
| LBRDK | Liberty Broadband | | Broadcasting | 61.58 | 50 | 3.02 | -12.34% |
| BOOT | Boot Barn | | Apparel | 162.00 | 20 | 3.00 | 10.99% |
| HD | Home Depot | | Retail | 399.38 | 100 | 2.94 | 6.00% |
| For chart view version of above stock list: Chart View ➞ 0 - 25 , 25 - 50 , 50 - 75 , 75 - 100 , 100 - 125 , 125 - 150 , 150 - 175 , 175 - 200 , 200 - 225 , 225 - 250 , 250 - 275 , 275 - 300 , 300 - 325 , 325 - 350 , 350 - 375 , 375 - 400 , 400 - 425 | ||
 | Click To Change The Sort Order: By Market Cap or Company Size Performance: Year-to-date, Week and Day |  |
|
Get the most comprehensive stock market coverage daily at 12Stocks.com ➞ Best Stocks Today ➞ Best Stocks Weekly ➞ Best Stocks Year-to-Date ➞ Best Stocks Trends ➞  Best Stocks Today 12Stocks.com Best Nasdaq Stocks ➞ Best S&P 500 Stocks ➞ Best Tech Stocks ➞ Best Biotech Stocks ➞ |
| Detailed Overview of Consumer Services Stocks |
| Consumer Services Technical Overview, Leaders & Laggards, Top Consumer Services ETF Funds & Detailed Consumer Services Stocks List, Charts, Trends & More |
| Consumer Services Sector: Technical Analysis, Trends & YTD Performance | |
| Consumer Services sector is composed of stocks
from retail, entertainment, media/publishing, consumer goods
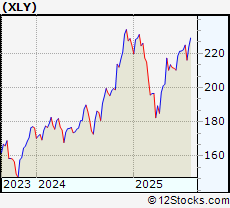
and services subsectors. Consumer Services sector, as represented by XLY, an exchange-traded fund [ETF] that holds basket of Consumer Services stocks (e.g, Walmart, Alibaba) is up by 2.95% and is currently underperforming the overall market by -7.38% year-to-date. Below is a quick view of Technical charts and trends: |
|
 XLY Weekly Chart |
|
| Long Term Trend: Very Good | |
| Medium Term Trend: Very Good | |
 XLY Daily Chart |
|
| Short Term Trend: Very Good | |
| Overall Trend Score: 100 | |
| YTD Performance: 2.95% | |
| **Trend Scores & Views Are Only For Educational Purposes And Not For Investing | |
| 12Stocks.com: Top Performing Consumer Services Sector Stocks | ||||||||||||||||||||||||||||||||||||||||||||||
 The top performing Consumer Services sector stocks year to date are
Now, more recently, over last week, the top performing Consumer Services sector stocks on the move are


|
||||||||||||||||||||||||||||||||||||||||||||||
| 12Stocks.com: Investing in Consumer Services Sector using Exchange Traded Funds | |
|
The following table shows list of key exchange traded funds (ETF) that
help investors track Consumer Services Index. For detailed view, check out our ETF Funds section of our website. Quick View: Move mouse or cursor over ETF symbol (ticker) to view short-term Technical chart and over ETF name to view long term chart. Click on ticker or stock name for detailed view. Click on to add stock symbol to your watchlist and to view watchlist. |
12Stocks.com List of ETFs that track Consumer Services Index
| Ticker | ETF Name | Watchlist | Recent Price | Smart Investing & Trading Score | Change % | Week % | Year-to-date % |
| XLY | Consumer Discret Sel | | 229.04 | 100 | 2.01 | 2.86 | 2.95% |
| RTH | Retail | | 247.72 | 100 | 0.63 | 0.8 | 10.46% |
| IYC | Consumer Services | | 102.72 | 100 | 1.68 | 2.04 | 7.35% |
| XRT | Retail | | 83.59 | 100 | 2.54 | 4.47 | 7.4% |
| IYK | Consumer Goods | | 70.21 | 40 | 0.37 | 1.49 | 8.38% |
| UCC | Consumer Services | | 49.53 | 100 | 2.96 | 5.78 | -2.73% |
| RETL | Retail Bull 3X | | 9.42 | 100 | 26.94 | 13.16 | 0.86% |
| RXI | Globl Consumer Discretionary | | 196.05 | 100 | 0.53 | 3.13 | 7.68% |
| SCC | Short Consumer Services | | 16.04 | 0 | -19.86 | -5.49 | -12.44% |
| UGE | Consumer Goods | | 18.79 | 20 | 1.05 | 2.4 | 7.27% |
| 12Stocks.com: Charts, Trends, Fundamental Data and Performances of Consumer Services Stocks | |
|
We now take in-depth look at all Consumer Services stocks including charts, multi-period performances and overall trends (as measured by Smart Investing & Trading Score). One can sort Consumer Services stocks (click link to choose) by Daily, Weekly and by Year-to-Date performances. Also, one can sort by size of the company or by market capitalization. |
| Select Your Default Chart Type: | |||||
| |||||
| Click on stock symbol or name for detailed view. Click on to add stock symbol to your watchlist and to view watchlist. Quick View: Move mouse or cursor over "Daily" to quickly view daily Technical stock chart and over "Weekly" to view weekly Technical stock chart. | |||||

 | VLGEA Village Super Market, Inc. |
| Sector: Services & Goods | |
| SubSector: Grocery Stores | |
| MarketCap: 222.375 Millions | |
| Recent Price: 35.24 Smart Investing & Trading Score: 40 | |
| Day Percent Change: 3.83% Day Change: 1.16 | |
| Week Change: 3.89% Year-to-date Change: 16.3% | |
| VLGEA Links: Profile News Message Board | |
| Charts:- Daily , Weekly | |
| Add VLGEA to Watchlist: View: Get Complete VLGEA Trend Analysis ➞ | |
 | DXPE DXP Enterprises, Inc. |
| Sector: Services & Goods | |
| SubSector: Industrial Equipment Wholesale | |
| MarketCap: 243.758 Millions | |
| Recent Price: 116.96 Smart Investing & Trading Score: 60 | |
| Day Percent Change: 3.67% Day Change: 1.84 | |
| Week Change: 6.58% Year-to-date Change: 45.0% | |
| DXPE Links: Profile News Message Board | |
| Charts:- Daily , Weekly | |
| Add DXPE to Watchlist: View: Get Complete DXPE Trend Analysis ➞ | |
 | ONEW OneWater Marine Inc. |
| Sector: Services & Goods | |
| SubSector: Recreational Vehicles | |
| MarketCap: 42027 Millions | |
| Recent Price: 17.12 Smart Investing & Trading Score: 100 | |
| Day Percent Change: 3.67% Day Change: 0.87 | |
| Week Change: 6.77% Year-to-date Change: -0.2% | |
| ONEW Links: Profile News Message Board | |
| Charts:- Daily , Weekly | |
| Add ONEW to Watchlist: View: Get Complete ONEW Trend Analysis ➞ | |
 | HCSG Healthcare Services Group, Inc. |
| Sector: Services & Goods | |
| SubSector: Business Services | |
| MarketCap: 1758.32 Millions | |
| Recent Price: 15.02 Smart Investing & Trading Score: 90 | |
| Day Percent Change: 3.66% Day Change: 0.38 | |
| Week Change: 9.15% Year-to-date Change: 31.5% | |
| HCSG Links: Profile News Message Board | |
| Charts:- Daily , Weekly | |
| Add HCSG to Watchlist: View: Get Complete HCSG Trend Analysis ➞ | |
 | EAT Brinker International, Inc. |
| Sector: Services & Goods | |
| SubSector: Restaurants | |
| MarketCap: 435.97 Millions | |
| Recent Price: 158.16 Smart Investing & Trading Score: 50 | |
| Day Percent Change: 3.6% Day Change: 2.47 | |
| Week Change: -1.07% Year-to-date Change: 19.0% | |
| EAT Links: Profile News Message Board | |
| Charts:- Daily , Weekly | |
| Add EAT to Watchlist: View: Get Complete EAT Trend Analysis ➞ | |
 | SCVL Shoe Carnival, Inc. |
| Sector: Services & Goods | |
| SubSector: Apparel Stores | |
| MarketCap: 252.508 Millions | |
| Recent Price: 20.72 Smart Investing & Trading Score: 60 | |
| Day Percent Change: 3.54% Day Change: 1.5 | |
| Week Change: 2.05% Year-to-date Change: -33.9% | |
| SCVL Links: Profile News Message Board | |
| Charts:- Daily , Weekly | |
| Add SCVL to Watchlist: View: Get Complete SCVL Trend Analysis ➞ | |
 | CHGG Chegg, Inc. |
| Sector: Services & Goods | |
| SubSector: Education & Training Services | |
| MarketCap: 3606.86 Millions | |
| Recent Price: 1.23 Smart Investing & Trading Score: 70 | |
| Day Percent Change: 3.5% Day Change: 0.08 | |
| Week Change: 15.32% Year-to-date Change: -20.5% | |
| CHGG Links: Profile News Message Board | |
| Charts:- Daily , Weekly | |
| Add CHGG to Watchlist: View: Get Complete CHGG Trend Analysis ➞ | |
 | FC Franklin Covey Co. |
| Sector: Services & Goods | |
| SubSector: Education & Training Services | |
| MarketCap: 243.306 Millions | |
| Recent Price: 19.35 Smart Investing & Trading Score: 30 | |
| Day Percent Change: 3.48% Day Change: 1.34 | |
| Week Change: 1.29% Year-to-date Change: -47.6% | |
| FC Links: Profile News Message Board | |
| Charts:- Daily , Weekly | |
| Add FC to Watchlist: View: Get Complete FC Trend Analysis ➞ | |
 | INCR INC Research Holdings, Inc. |
| Sector: Services & Goods | |
| SubSector: Research Services | |
| MarketCap: 2486.94 Millions | |
| Recent Price: 1.63 Smart Investing & Trading Score: 70 | |
| Day Percent Change: 3.43% Day Change: 0.07 | |
| Week Change: 12.71% Year-to-date Change: 3.1% | |
| INCR Links: Profile News Message Board | |
| Charts:- Daily , Weekly | |
| Add INCR to Watchlist: View: Get Complete INCR Trend Analysis ➞ | |
 | ETSY Etsy, Inc. |
| Sector: Services & Goods | |
| SubSector: Specialty Retail, Other | |
| MarketCap: 4263.24 Millions | |
| Recent Price: 66.43 Smart Investing & Trading Score: 70 | |
| Day Percent Change: 3.33% Day Change: 1.78 | |
| Week Change: 24.72% Year-to-date Change: 32.5% | |
| ETSY Links: Profile News Message Board | |
| Charts:- Daily , Weekly | |
| Add ETSY to Watchlist: View: Get Complete ETSY Trend Analysis ➞ | |
 | SIG Signet Jewelers Limited |
| Sector: Services & Goods | |
| SubSector: Jewelry Stores | |
| MarketCap: 518.1 Millions | |
| Recent Price: 81.98 Smart Investing & Trading Score: 80 | |
| Day Percent Change: 3.32% Day Change: 2.58 | |
| Week Change: 10.85% Year-to-date Change: 4.6% | |
| SIG Links: Profile News Message Board | |
| Charts:- Daily , Weekly | |
| Add SIG to Watchlist: View: Get Complete SIG Trend Analysis ➞ | |
 | PSMT PriceSmart, Inc. |
| Sector: Services & Goods | |
| SubSector: Discount, Variety Stores | |
| MarketCap: 1655.72 Millions | |
| Recent Price: 108.95 Smart Investing & Trading Score: 40 | |
| Day Percent Change: 3.27% Day Change: 2.83 | |
| Week Change: 2.36% Year-to-date Change: 23.9% | |
| PSMT Links: Profile News Message Board | |
| Charts:- Daily , Weekly | |
| Add PSMT to Watchlist: View: Get Complete PSMT Trend Analysis ➞ | |
 | SVV Savers Value Village, Inc. |
| Sector: Services & Goods | |
| SubSector: Specialty Retail | |
| MarketCap: 3800 Millions | |
| Recent Price: 11.30 Smart Investing & Trading Score: 73 | |
| Day Percent Change: 3.22% Day Change: 0.31 | |
| Week Change: 0% Year-to-date Change: 12.8% | |
| SVV Links: Profile News Message Board | |
| Charts:- Daily , Weekly | |
| Add SVV to Watchlist: View: Get Complete SVV Trend Analysis ➞ | |
 | KFY Korn Ferry |
| Sector: Services & Goods | |
| SubSector: Staffing & Outsourcing Services | |
| MarketCap: 1534.28 Millions | |
| Recent Price: 72.46 Smart Investing & Trading Score: 60 | |
| Day Percent Change: 3.15% Day Change: 2.2 | |
| Week Change: 5.76% Year-to-date Change: 12.0% | |
| KFY Links: Profile News Message Board | |
| Charts:- Daily , Weekly | |
| Add KFY to Watchlist: View: Get Complete KFY Trend Analysis ➞ | |
 | BABA Alibaba Group Holding Limited |
| Sector: Services & Goods | |
| SubSector: Specialty Retail, Other | |
| MarketCap: 522666 Millions | |
| Recent Price: 121.26 Smart Investing & Trading Score: 60 | |
| Day Percent Change: 3.13% Day Change: 2.59 | |
| Week Change: 4.96% Year-to-date Change: 50.8% | |
| BABA Links: Profile News Message Board | |
| Charts:- Daily , Weekly | |
| Add BABA to Watchlist: View: Get Complete BABA Trend Analysis ➞ | |
 | WCC WESCO International, Inc. |
| Sector: Services & Goods | |
| SubSector: Industrial Equipment Wholesale | |
| MarketCap: 824.358 Millions | |
| Recent Price: 206.22 Smart Investing & Trading Score: 40 | |
| Day Percent Change: 3.1% Day Change: 4.96 | |
| Week Change: 4.44% Year-to-date Change: 19.7% | |
| WCC Links: Profile News Message Board | |
| Charts:- Daily , Weekly | |
| Add WCC to Watchlist: View: Get Complete WCC Trend Analysis ➞ | |
 | FYBR Frontier Communications Parent, Inc. |
| Sector: Services & Goods | |
| SubSector: Telecom Services | |
| MarketCap: 4460 Millions | |
| Recent Price: 37.11 Smart Investing & Trading Score: 90 | |
| Day Percent Change: 3.1% Day Change: 0.86 | |
| Week Change: 1.06% Year-to-date Change: 6.9% | |
| FYBR Links: Profile News Message Board | |
| Charts:- Daily , Weekly | |
| Add FYBR to Watchlist: View: Get Complete FYBR Trend Analysis ➞ | |
 | ONON On Holding AG |
| Sector: Services & Goods | |
| SubSector: Footwear & Accessories | |
| MarketCap: 10600 Millions | |
| Recent Price: 45.34 Smart Investing & Trading Score: 43 | |
| Day Percent Change: 3.1% Day Change: 1.34 | |
| Week Change: 2.95% Year-to-date Change: -12.0% | |
| ONON Links: Profile News Message Board | |
| Charts:- Daily , Weekly | |
| Add ONON to Watchlist: View: Get Complete ONON Trend Analysis ➞ | |
 | BJRI BJ s Restaurants, Inc. |
| Sector: Services & Goods | |
| SubSector: Restaurants | |
| MarketCap: 183.67 Millions | |
| Recent Price: 35.11 Smart Investing & Trading Score: 50 | |
| Day Percent Change: 3.08% Day Change: 0.98 | |
| Week Change: 5.53% Year-to-date Change: 2.6% | |
| BJRI Links: Profile News Message Board | |
| Charts:- Daily , Weekly | |
| Add BJRI to Watchlist: View: Get Complete BJRI Trend Analysis ➞ | |
 | NEWT Newtek Business Services Corp. |
| Sector: Services & Goods | |
| SubSector: Business Services | |
| MarketCap: 243.982 Millions | |
| Recent Price: 12.03 Smart Investing & Trading Score: 80 | |
| Day Percent Change: 3.05% Day Change: 0.38 | |
| Week Change: 9.72% Year-to-date Change: -0.3% | |
| NEWT Links: Profile News Message Board | |
| Charts:- Daily , Weekly | |
| Add NEWT to Watchlist: View: Get Complete NEWT Trend Analysis ➞ | |
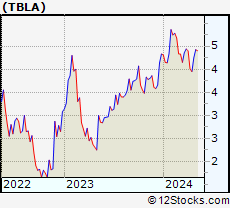 | TBLA Taboola.com Ltd. |
| Sector: Services & Goods | |
| SubSector: Internet Content & Information | |
| MarketCap: 927 Millions | |
| Recent Price: 3.32 Smart Investing & Trading Score: 50 | |
| Day Percent Change: 3.05% Day Change: 0.1 | |
| Week Change: -2.07% Year-to-date Change: -9.3% | |
| TBLA Links: Profile News Message Board | |
| Charts:- Daily , Weekly | |
| Add TBLA to Watchlist: View: Get Complete TBLA Trend Analysis ➞ | |
 | URBN Urban Outfitters, Inc. |
| Sector: Services & Goods | |
| SubSector: Apparel Stores | |
| MarketCap: 1638.08 Millions | |
| Recent Price: 77.53 Smart Investing & Trading Score: 50 | |
| Day Percent Change: 3.02% Day Change: 1.13 | |
| Week Change: -0.38% Year-to-date Change: 44.8% | |
| URBN Links: Profile News Message Board | |
| Charts:- Daily , Weekly | |
| Add URBN to Watchlist: View: Get Complete URBN Trend Analysis ➞ | |
 | LBRDK Liberty Broadband Corporation |
| Sector: Services & Goods | |
| SubSector: Broadcasting - TV | |
| MarketCap: 13847.3 Millions | |
| Recent Price: 61.58 Smart Investing & Trading Score: 50 | |
| Day Percent Change: 3.02% Day Change: 1.82 | |
| Week Change: 2.99% Year-to-date Change: -12.3% | |
| LBRDK Links: Profile News Message Board | |
| Charts:- Daily , Weekly | |
| Add LBRDK to Watchlist: View: Get Complete LBRDK Trend Analysis ➞ | |
 | BOOT Boot Barn Holdings, Inc. |
| Sector: Services & Goods | |
| SubSector: Apparel Stores | |
| MarketCap: 360.608 Millions | |
| Recent Price: 162.00 Smart Investing & Trading Score: 20 | |
| Day Percent Change: 3% Day Change: 4.15 | |
| Week Change: 0.55% Year-to-date Change: 11.0% | |
| BOOT Links: Profile News Message Board | |
| Charts:- Daily , Weekly | |
| Add BOOT to Watchlist: View: Get Complete BOOT Trend Analysis ➞ | |
 | HD The Home Depot, Inc. |
| Sector: Services & Goods | |
| SubSector: Home Improvement Stores | |
| MarketCap: 185389 Millions | |
| Recent Price: 399.38 Smart Investing & Trading Score: 100 | |
| Day Percent Change: 2.94% Day Change: 10.71 | |
| Week Change: 5.27% Year-to-date Change: 6.0% | |
| HD Links: Profile News Message Board | |
| Charts:- Daily , Weekly | |
| Add HD to Watchlist: View: Get Complete HD Trend Analysis ➞ | |
| For tabular summary view of above stock list: Summary View ➞ 0 - 25 , 25 - 50 , 50 - 75 , 75 - 100 , 100 - 125 , 125 - 150 , 150 - 175 , 175 - 200 , 200 - 225 , 225 - 250 , 250 - 275 , 275 - 300 , 300 - 325 , 325 - 350 , 350 - 375 , 375 - 400 , 400 - 425 | ||
| Click To Change The Sort Order: By Market Cap or Company Size Performance: Year-to-date, Week and Day | |
| Select Chart Type: | ||
|
Best Stocks Today 12Stocks.com |
© 2025 12Stocks.com Terms & Conditions Privacy Contact Us
All Information Provided Only For Education And Not To Be Used For Investing or Trading. See Terms & Conditions


One More Thing ... Get Best Stocks Delivered Daily!
Never Ever Miss A Move With Our Top Ten Stocks Lists
Find Best Stocks In Any Market - Bull or Bear Market
Take A Peek At Our Top Ten Stocks Lists: Daily, Weekly, Year-to-Date & Top Trends
Find Best Stocks In Any Market - Bull or Bear Market
Take A Peek At Our Top Ten Stocks Lists: Daily, Weekly, Year-to-Date & Top Trends
Consumer Services Stocks With Best Up Trends [0-bearish to 100-bullish]: Louisiana-Pacific [100], eBay [100], Graham [100], Fastenal [100], Wayfair [100], Gaia [100], Gray Television[100], Haverty Furniture[100], RealReal [100], Resideo Technologies[100], Holley [100]
Best Consumer Services Stocks Year-to-Date:
MedEquities Realty[294856%], WW [2516.54%], ThredUp [656.12%], Willdan [210.66%], Kratos Defense[160.61%], IHS Holding[134.93%], Yatsen Holding[133.67%], National Vision[122.84%], Roblox [119.12%], Altisource Portfolio[97.94%], Jumia Technologies[95.29%] Best Consumer Services Stocks This Week:
MedEquities Realty[411381%], Jumia Technologies[62.88%], Money[56.67%], Brilliant Earth[44.93%], Holley [35.82%], RealReal [35.65%], Willdan [34.44%], ATRenew [33.14%], Gray Television[33.03%], Arhaus [28.98%], Park-Ohio [27.27%] Best Consumer Services Stocks Daily:
CareDx [185.69%], Wingstop [150.46%], Spotify Technology[147.52%], National CineMedia[112.46%], VSE [69.41%], Burlington Stores[66.03%], Myriad Genetics[64.88%], Costco Wholesale[58.1%], Daily Journal[57.5%], Texas Roadhouse[55.27%], Royal Caribbean[53.63%]