
 Login Sign Up


| |||||
 |  | ||||

| 12Stocks.com Market Intelligence |
Best Consumer Services Stocks
| In a hurry? Services & Goods Stocks: Performance Trends Table, Stock Charts
Sort Consumer Services: Daily, Weekly, Year-to-Date, Market Cap & Trends. Filter Services & Goods stocks list by size: All Large Mid-Range Small |
| 12Stocks.com Consumer Services Stocks Performances & Trends Daily | |||||||||
|
|  The overall Smart Investing & Trading Score is 90 (0-bearish to 100-bullish) which puts Consumer Services sector in short term bullish trend. The Smart Investing & Trading Score from previous trading session is 50 and hence an improvement of trend.
| ||||||||
Here are the Smart Investing & Trading Scores of the most requested Consumer Services stocks at 12Stocks.com (click stock name for detailed review):
|


| Consider signing up for our daily 12Stocks.com "Best Stocks Newsletter". You will never ever miss a big stock move again! |
| 12Stocks.com: Investing in Consumer Services sector with Stocks | |
|
The following table helps investors and traders sort through current performance and trends (as measured by Smart Investing & Trading Score) of various
stocks in the Consumer Services sector. Quick View: Move mouse or cursor over stock symbol (ticker) to view short-term Technical chart and over stock name to view long term chart. Click on  to add stock symbol to your watchlist and to add stock symbol to your watchlist and  to view watchlist. Click on any ticker or stock name for detailed market intelligence report for that stock. to view watchlist. Click on any ticker or stock name for detailed market intelligence report for that stock. |
12Stocks.com Performance of Stocks in Consumer Services Sector
| Ticker | Stock Name | Watchlist | Category | Recent Price | Smart Investing & Trading Score | Change % | YTD Change% |
| DENN | Denny s |   | Restaurants | 3.82 | 70 | 2.46% | -36.86% |
| FIVE | Five Below | | Retail | 137.98 | 70 | 2.43% | 31.46% |
| NL | NL Industries | | Equipment | 6.56 | 70 | 2.41% | -13.36% |
| MATW | Matthews | | Services | 24.05 | 70 | 1.98% | -10.25% |
| PK | Park Hotels | | Lodging | 10.66 | 70 | 1.78% | -22.46% |
| ABM | ABM Industries | | Services | 48.76 | 70 | 1.75% | -3.18% |
| MMS | MAXIMUS | | Services | 82.86 | 70 | 1.63% | 11.94% |
| LOPE | Grand Canyon | | Education | 198.00 | 70 | 1.35% | 20.88% |
| WH | Wyndham Hotels | | Lodging | 87.61 | 70 | 0.99% | -12.68% |
| AMCX | AMC Networks | | Entertainment | 6.84 | 70 | 0.29% | -30.91% |
| WMT | Walmart | | Retail | 103.62 | 70 | 0.27% | 15.28% |
| TIME | Time | | Publishing | 26.02 | 70 | 0.00% | 4.75% |
| ASO | Academy Sports | | Specialty Retail | 52.02 | 70 | -1.65% | -9.34% |
| ARHS | Arhaus | | Home Improvement Retail | 12.13 | 69 | 6.85% | 29.04% |
| FWRG | First Watch | | Restaurants | 17.80 | 68 | -0.06% | -4.35% |
| CAVA | CAVA | | Restaurants | 84.50 | 64 | 18.12% | -25.09% |
| BURL | Burlington Stores | | Retail | 278.45 | 60 | 66.03% | -2.32% |
| FTDR | frontdoor | | Services | 57.01 | 60 | 36.37% | 4.28% |
| H | Hyatt Hotels | | Lodging | 140.69 | 60 | 28.81% | -10.18% |
| MCRI | Monarch Casino | | Casinos | 99.03 | 60 | 9.06% | 26.38% |
| SEAT | Vivid Seats | | Internet Content & Information | 17.51 | 60 | 6.09% | 278.19% |
| CRMT | America s | | Automobile | 45.66 | 60 | 5.93% | -10.91% |
| CAKE | Cheesecake Factory | | Restaurants | 62.36 | 60 | 5.78% | 33.41% |
| MED | Medifast | | Retail | 13.19 | 60 | 5.38% | -25.14% |
| QUAD | Quad/Graphics | | Services | 6.27 | 60 | 5.35% | -7.67% |
| For chart view version of above stock list: Chart View ➞ 0 - 25 , 25 - 50 , 50 - 75 , 75 - 100 , 100 - 125 , 125 - 150 , 150 - 175 , 175 - 200 , 200 - 225 , 225 - 250 , 250 - 275 , 275 - 300 , 300 - 325 , 325 - 350 , 350 - 375 | ||
 | Click To Change The Sort Order: By Market Cap or Company Size Performance: Year-to-date, Week and Day |  |
|
Get the most comprehensive stock market coverage daily at 12Stocks.com ➞ Best Stocks Today ➞ Best Stocks Weekly ➞ Best Stocks Year-to-Date ➞ Best Stocks Trends ➞  Best Stocks Today 12Stocks.com Best Nasdaq Stocks ➞ Best S&P 500 Stocks ➞ Best Tech Stocks ➞ Best Biotech Stocks ➞ |
| Detailed Overview of Consumer Services Stocks |
| Consumer Services Technical Overview, Leaders & Laggards, Top Consumer Services ETF Funds & Detailed Consumer Services Stocks List, Charts, Trends & More |
| Consumer Services Sector: Technical Analysis, Trends & YTD Performance | |
| Consumer Services sector is composed of stocks
from retail, entertainment, media/publishing, consumer goods
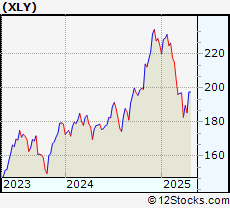
and services subsectors. Consumer Services sector, as represented by XLY, an exchange-traded fund [ETF] that holds basket of Consumer Services stocks (e.g, Walmart, Alibaba) is up by 1.56% and is currently underperforming the overall market by -8.24% year-to-date. Below is a quick view of Technical charts and trends: |
|
 XLY Weekly Chart |
|
| Long Term Trend: Very Good | |
| Medium Term Trend: Very Good | |
 XLY Daily Chart |
|
| Short Term Trend: Very Good | |
| Overall Trend Score: 90 | |
| YTD Performance: 1.56% | |
| **Trend Scores & Views Are Only For Educational Purposes And Not For Investing | |
| 12Stocks.com: Top Performing Consumer Services Sector Stocks | ||||||||||||||||||||||||||||||||||||||||||||||||
 The top performing Consumer Services sector stocks year to date are
Now, more recently, over last week, the top performing Consumer Services sector stocks on the move are


|
||||||||||||||||||||||||||||||||||||||||||||||||
| 12Stocks.com: Investing in Consumer Services Sector using Exchange Traded Funds | |
|
The following table shows list of key exchange traded funds (ETF) that
help investors track Consumer Services Index. For detailed view, check out our ETF Funds section of our website. Quick View: Move mouse or cursor over ETF symbol (ticker) to view short-term Technical chart and over ETF name to view long term chart. Click on ticker or stock name for detailed view. Click on to add stock symbol to your watchlist and to view watchlist. |
12Stocks.com List of ETFs that track Consumer Services Index
| Ticker | ETF Name | Watchlist | Recent Price | Smart Investing & Trading Score | Change % | Week % | Year-to-date % |
| XLY | Consumer Discret Sel | | 226.74 | 90 | 2.01 | 3.58 | 1.56% |
| RTH | Retail | | 245.88 | 90 | 0.63 | 2.04 | 9.67% |
| IYC | Consumer Services | | 101.87 | 90 | 1.68 | 2.71 | 6.29% |
| XRT | Retail | | 83.23 | 90 | 2.54 | 4.59 | 5.13% |
| IYK | Consumer Goods | | 70.15 | 40 | 0.37 | 1.9 | 8.01% |
| UCC | Consumer Services | | 48.63 | 90 | 2.96 | 7 | -5.38% |
| RETL | Retail Bull 3X | | 9.28 | 90 | 26.94 | 13.31 | -5.36% |
| SCC | Short Consumer Services | | 16.35 | 0 | -19.86 | -6.67 | -9.94% |
| UGE | Consumer Goods | | 19.12 | 50 | 1.05 | 5.18 | 6.94% |
| 12Stocks.com: Charts, Trends, Fundamental Data and Performances of Consumer Services Stocks | |
|
We now take in-depth look at all Consumer Services stocks including charts, multi-period performances and overall trends (as measured by Smart Investing & Trading Score). One can sort Consumer Services stocks (click link to choose) by Daily, Weekly and by Year-to-Date performances. Also, one can sort by size of the company or by market capitalization. |
| Select Your Default Chart Type: | |||||
| |||||
| Click on stock symbol or name for detailed view. Click on to add stock symbol to your watchlist and to view watchlist. Quick View: Move mouse or cursor over "Daily" to quickly view daily Technical stock chart and over "Weekly" to view weekly Technical stock chart. | |||||

 | DENN Denny s Corporation |
| Sector: Services & Goods | |
| SubSector: Restaurants | |
| MarketCap: 367.47 Millions | |
| Recent Price: 3.82 Smart Investing & Trading Score: 70 | |
| Day Percent Change: 2.46% Day Change: 0.15 | |
| Week Change: 7.91% Year-to-date Change: -36.9% | |
| DENN Links: Profile News Message Board | |
| Charts:- Daily , Weekly | |
| Add DENN to Watchlist: View: Get Complete DENN Trend Analysis ➞ | |
 | FIVE Five Below, Inc. |
| Sector: Services & Goods | |
| SubSector: Specialty Retail, Other | |
| MarketCap: 3693.74 Millions | |
| Recent Price: 137.98 Smart Investing & Trading Score: 70 | |
| Day Percent Change: 2.43% Day Change: 1.96 | |
| Week Change: 1.6% Year-to-date Change: 31.5% | |
| FIVE Links: Profile News Message Board | |
| Charts:- Daily , Weekly | |
| Add FIVE to Watchlist: View: Get Complete FIVE Trend Analysis ➞ | |
 | NL NL Industries, Inc. |
| Sector: Services & Goods | |
| SubSector: Industrial Equipment Wholesale | |
| MarketCap: 126.258 Millions | |
| Recent Price: 6.56 Smart Investing & Trading Score: 70 | |
| Day Percent Change: 2.41% Day Change: 0.16 | |
| Week Change: 10.07% Year-to-date Change: -13.4% | |
| NL Links: Profile News Message Board | |
| Charts:- Daily , Weekly | |
| Add NL to Watchlist: View: Get Complete NL Trend Analysis ➞ | |
 | MATW Matthews International Corporation |
| Sector: Services & Goods | |
| SubSector: Personal Services | |
| MarketCap: 803.325 Millions | |
| Recent Price: 24.05 Smart Investing & Trading Score: 70 | |
| Day Percent Change: 1.98% Day Change: 0.5 | |
| Week Change: 0.99% Year-to-date Change: -10.3% | |
| MATW Links: Profile News Message Board | |
| Charts:- Daily , Weekly | |
| Add MATW to Watchlist: View: Get Complete MATW Trend Analysis ➞ | |
 | PK Park Hotels & Resorts Inc. |
| Sector: Services & Goods | |
| SubSector: Lodging | |
| MarketCap: 2221.06 Millions | |
| Recent Price: 10.66 Smart Investing & Trading Score: 70 | |
| Day Percent Change: 1.78% Day Change: 0.27 | |
| Week Change: 1.91% Year-to-date Change: -22.5% | |
| PK Links: Profile News Message Board | |
| Charts:- Daily , Weekly | |
| Add PK to Watchlist: View: Get Complete PK Trend Analysis ➞ | |
 | ABM ABM Industries Incorporated |
| Sector: Services & Goods | |
| SubSector: Business Services | |
| MarketCap: 1706.72 Millions | |
| Recent Price: 48.76 Smart Investing & Trading Score: 70 | |
| Day Percent Change: 1.75% Day Change: 0.95 | |
| Week Change: 3.81% Year-to-date Change: -3.2% | |
| ABM Links: Profile News Message Board | |
| Charts:- Daily , Weekly | |
| Add ABM to Watchlist: View: Get Complete ABM Trend Analysis ➞ | |
 | MMS MAXIMUS, Inc. |
| Sector: Services & Goods | |
| SubSector: Business Services | |
| MarketCap: 3833.02 Millions | |
| Recent Price: 82.86 Smart Investing & Trading Score: 70 | |
| Day Percent Change: 1.63% Day Change: 1.47 | |
| Week Change: 8.94% Year-to-date Change: 11.9% | |
| MMS Links: Profile News Message Board | |
| Charts:- Daily , Weekly | |
| Add MMS to Watchlist: View: Get Complete MMS Trend Analysis ➞ | |
 | LOPE Grand Canyon Education, Inc. |
| Sector: Services & Goods | |
| SubSector: Education & Training Services | |
| MarketCap: 3073.56 Millions | |
| Recent Price: 198.00 Smart Investing & Trading Score: 70 | |
| Day Percent Change: 1.35% Day Change: 1.89 | |
| Week Change: 18.1% Year-to-date Change: 20.9% | |
| LOPE Links: Profile News Message Board | |
| Charts:- Daily , Weekly | |
| Add LOPE to Watchlist: View: Get Complete LOPE Trend Analysis ➞ | |
 | WH Wyndham Hotels & Resorts, Inc. |
| Sector: Services & Goods | |
| SubSector: Lodging | |
| MarketCap: 2656.66 Millions | |
| Recent Price: 87.61 Smart Investing & Trading Score: 70 | |
| Day Percent Change: 0.99% Day Change: 0.76 | |
| Week Change: 3.07% Year-to-date Change: -12.7% | |
| WH Links: Profile News Message Board | |
| Charts:- Daily , Weekly | |
| Add WH to Watchlist: View: Get Complete WH Trend Analysis ➞ | |
 | AMCX AMC Networks Inc. |
| Sector: Services & Goods | |
| SubSector: Entertainment - Diversified | |
| MarketCap: 1477.37 Millions | |
| Recent Price: 6.84 Smart Investing & Trading Score: 70 | |
| Day Percent Change: 0.29% Day Change: 0.03 | |
| Week Change: 14.38% Year-to-date Change: -30.9% | |
| AMCX Links: Profile News Message Board | |
| Charts:- Daily , Weekly | |
| Add AMCX to Watchlist: View: Get Complete AMCX Trend Analysis ➞ | |
 | WMT Walmart Inc. |
| Sector: Services & Goods | |
| SubSector: Discount, Variety Stores | |
| MarketCap: 355610 Millions | |
| Recent Price: 103.62 Smart Investing & Trading Score: 70 | |
| Day Percent Change: 0.27% Day Change: 0.2 | |
| Week Change: 4.34% Year-to-date Change: 15.3% | |
| WMT Links: Profile News Message Board | |
| Charts:- Daily , Weekly | |
| Add WMT to Watchlist: View: Get Complete WMT Trend Analysis ➞ | |
 | TIME Time Inc. |
| Sector: Services & Goods | |
| SubSector: Publishing - Periodicals | |
| MarketCap: 1884.61 Millions | |
| Recent Price: 26.02 Smart Investing & Trading Score: 70 | |
| Day Percent Change: 0% Day Change: 0 | |
| Week Change: 2.22% Year-to-date Change: 4.8% | |
| TIME Links: Profile News Message Board | |
| Charts:- Daily , Weekly | |
| Add TIME to Watchlist: View: Get Complete TIME Trend Analysis ➞ | |
 | ASO Academy Sports and Outdoors, Inc. |
| Sector: Services & Goods | |
| SubSector: Specialty Retail | |
| MarketCap: 16027 Millions | |
| Recent Price: 52.02 Smart Investing & Trading Score: 70 | |
| Day Percent Change: -1.65% Day Change: -0.91 | |
| Week Change: 2.24% Year-to-date Change: -9.3% | |
| ASO Links: Profile News Message Board | |
| Charts:- Daily , Weekly | |
| Add ASO to Watchlist: View: Get Complete ASO Trend Analysis ➞ | |
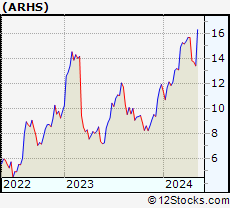 | ARHS Arhaus, Inc. |
| Sector: Services & Goods | |
| SubSector: Home Improvement Retail | |
| MarketCap: 1450 Millions | |
| Recent Price: 12.13 Smart Investing & Trading Score: 69 | |
| Day Percent Change: 6.85% Day Change: 0.82 | |
| Week Change: 27.48% Year-to-date Change: 29.0% | |
| ARHS Links: Profile News Message Board | |
| Charts:- Daily , Weekly | |
| Add ARHS to Watchlist: View: Get Complete ARHS Trend Analysis ➞ | |
 | FWRG First Watch Restaurant Group, Inc. |
| Sector: Services & Goods | |
| SubSector: Restaurants | |
| MarketCap: 1000 Millions | |
| Recent Price: 17.80 Smart Investing & Trading Score: 68 | |
| Day Percent Change: -0.06% Day Change: -0.01 | |
| Week Change: -0.28% Year-to-date Change: -4.4% | |
| FWRG Links: Profile News Message Board | |
| Charts:- Daily , Weekly | |
| Add FWRG to Watchlist: View: Get Complete FWRG Trend Analysis ➞ | |
 | CAVA CAVA Group, Inc. |
| Sector: Services & Goods | |
| SubSector: Restaurants | |
| MarketCap: 4510 Millions | |
| Recent Price: 84.50 Smart Investing & Trading Score: 64 | |
| Day Percent Change: 18.12% Day Change: 18.72 | |
| Week Change: -3.51% Year-to-date Change: -25.1% | |
| CAVA Links: Profile News Message Board | |
| Charts:- Daily , Weekly | |
| Add CAVA to Watchlist: View: Get Complete CAVA Trend Analysis ➞ | |
 | BURL Burlington Stores, Inc. |
| Sector: Services & Goods | |
| SubSector: Discount, Variety Stores | |
| MarketCap: 9801.42 Millions | |
| Recent Price: 278.45 Smart Investing & Trading Score: 60 | |
| Day Percent Change: 66.03% Day Change: 109.57 | |
| Week Change: -0.43% Year-to-date Change: -2.3% | |
| BURL Links: Profile News Message Board | |
| Charts:- Daily , Weekly | |
| Add BURL to Watchlist: View: Get Complete BURL Trend Analysis ➞ | |
 | FTDR frontdoor, inc. |
| Sector: Services & Goods | |
| SubSector: Business Services | |
| MarketCap: 2974.22 Millions | |
| Recent Price: 57.01 Smart Investing & Trading Score: 60 | |
| Day Percent Change: 36.37% Day Change: 12.94 | |
| Week Change: 1.51% Year-to-date Change: 4.3% | |
| FTDR Links: Profile News Message Board | |
| Charts:- Daily , Weekly | |
| Add FTDR to Watchlist: View: Get Complete FTDR Trend Analysis ➞ | |
 | H Hyatt Hotels Corporation |
| Sector: Services & Goods | |
| SubSector: Lodging | |
| MarketCap: 5525.56 Millions | |
| Recent Price: 140.69 Smart Investing & Trading Score: 60 | |
| Day Percent Change: 28.81% Day Change: 33.27 | |
| Week Change: 3% Year-to-date Change: -10.2% | |
| H Links: Profile News Message Board | |
| Charts:- Daily , Weekly | |
| Add H to Watchlist: View: Get Complete H Trend Analysis ➞ | |
 | MCRI Monarch Casino & Resort, Inc. |
| Sector: Services & Goods | |
| SubSector: Resorts & Casinos | |
| MarketCap: 352.894 Millions | |
| Recent Price: 99.03 Smart Investing & Trading Score: 60 | |
| Day Percent Change: 9.06% Day Change: 6.17 | |
| Week Change: -1.48% Year-to-date Change: 26.4% | |
| MCRI Links: Profile News Message Board | |
| Charts:- Daily , Weekly | |
| Add MCRI to Watchlist: View: Get Complete MCRI Trend Analysis ➞ | |
 | SEAT Vivid Seats Inc. |
| Sector: Services & Goods | |
| SubSector: Internet Content & Information | |
| MarketCap: 1560 Millions | |
| Recent Price: 17.51 Smart Investing & Trading Score: 60 | |
| Day Percent Change: 6.09% Day Change: 0.27 | |
| Week Change: 1616.67% Year-to-date Change: 278.2% | |
| SEAT Links: Profile News Message Board | |
| Charts:- Daily , Weekly | |
| Add SEAT to Watchlist: View: Get Complete SEAT Trend Analysis ➞ | |
 | CRMT America s Car-Mart, Inc. |
| Sector: Services & Goods | |
| SubSector: Auto Dealerships | |
| MarketCap: 329.921 Millions | |
| Recent Price: 45.66 Smart Investing & Trading Score: 60 | |
| Day Percent Change: 5.93% Day Change: 3.5 | |
| Week Change: 4.34% Year-to-date Change: -10.9% | |
| CRMT Links: Profile News Message Board | |
| Charts:- Daily , Weekly | |
| Add CRMT to Watchlist: View: Get Complete CRMT Trend Analysis ➞ | |
 | CAKE The Cheesecake Factory Incorporated |
| Sector: Services & Goods | |
| SubSector: Restaurants | |
| MarketCap: 829 Millions | |
| Recent Price: 62.36 Smart Investing & Trading Score: 60 | |
| Day Percent Change: 5.78% Day Change: 2.22 | |
| Week Change: 1.63% Year-to-date Change: 33.4% | |
| CAKE Links: Profile News Message Board | |
| Charts:- Daily , Weekly | |
| Add CAKE to Watchlist: View: Get Complete CAKE Trend Analysis ➞ | |
 | MED Medifast, Inc. |
| Sector: Services & Goods | |
| SubSector: Specialty Retail, Other | |
| MarketCap: 681.044 Millions | |
| Recent Price: 13.19 Smart Investing & Trading Score: 60 | |
| Day Percent Change: 5.38% Day Change: 1.02 | |
| Week Change: 0.92% Year-to-date Change: -25.1% | |
| MED Links: Profile News Message Board | |
| Charts:- Daily , Weekly | |
| Add MED to Watchlist: View: Get Complete MED Trend Analysis ➞ | |
 | QUAD Quad/Graphics, Inc. |
| Sector: Services & Goods | |
| SubSector: Business Services | |
| MarketCap: 205.182 Millions | |
| Recent Price: 6.27 Smart Investing & Trading Score: 60 | |
| Day Percent Change: 5.35% Day Change: 0.24 | |
| Week Change: -5.86% Year-to-date Change: -7.7% | |
| QUAD Links: Profile News Message Board | |
| Charts:- Daily , Weekly | |
| Add QUAD to Watchlist: View: Get Complete QUAD Trend Analysis ➞ | |
| For tabular summary view of above stock list: Summary View ➞ 0 - 25 , 25 - 50 , 50 - 75 , 75 - 100 , 100 - 125 , 125 - 150 , 150 - 175 , 175 - 200 , 200 - 225 , 225 - 250 , 250 - 275 , 275 - 300 , 300 - 325 , 325 - 350 , 350 - 375 | ||
| Click To Change The Sort Order: By Market Cap or Company Size Performance: Year-to-date, Week and Day | |
| Select Chart Type: | ||
|
Best Stocks Today 12Stocks.com |
© 2025 12Stocks.com Terms & Conditions Privacy Contact Us
All Information Provided Only For Education And Not To Be Used For Investing or Trading. See Terms & Conditions


One More Thing ... Get Best Stocks Delivered Daily!
Never Ever Miss A Move With Our Top Ten Stocks Lists
Find Best Stocks In Any Market - Bull or Bear Market
Take A Peek At Our Top Ten Stocks Lists: Daily, Weekly, Year-to-Date & Top Trends
Find Best Stocks In Any Market - Bull or Bear Market
Take A Peek At Our Top Ten Stocks Lists: Daily, Weekly, Year-to-Date & Top Trends
Consumer Services Stocks With Best Up Trends [0-bearish to 100-bullish]: VSE [100], eBay [100], Kratos Defense[100], Graham [100], CompX [100], Fastenal [100], Jacobs Engineering[100], Willdan [100], Gray Television[100], Williams-Sonoma [100], Rush Enterprises[100]
Best Consumer Services Stocks Year-to-Date:
ThredUp [640.29%], Vivid Seats[278.19%], Willdan [211.45%], Kratos Defense[162.09%], Roblox [123.87%], National Vision[120.92%], Altisource Portfolio[99.84%], Noodles & [90.05%], Gray Television[89.96%], QuantumScape [80.15%], PaySign [80.13%] Best Consumer Services Stocks This Week:
Vivid Seats[1616.67%], Holley [66.18%], Money[64.55%], Myriad Genetics[55.81%], Grocery Outlet[42.09%], RealReal [33.98%], CompX [30.87%], Willdan [30.08%], comScore [29.36%], Arhaus [27.48%], Gray Television[26.37%] Best Consumer Services Stocks Daily:
CareDx [185.69%], Wingstop [150.46%], National CineMedia[112.46%], VSE [69.41%], Burlington Stores[66.03%], Myriad Genetics[64.88%], Costco Wholesale[58.1%], Daily Journal[57.5%], Texas Roadhouse[55.27%], Royal Caribbean[53.63%], CRA [53.26%]