
 Login Sign Up


| |||||
 |  | ||||

| 12Stocks.com Market Intelligence |
Best Biotech Stocks
|
|
| Quick Read: Best Biotech Stocks List By Performances & Trends: Daily, Weekly, Year-to-Date, Market Cap (Size) & Technical Trends | |||
| Best Biotech Stocks Views: Quick Browse View, Summary & Slide Show View | |||
| 12Stocks.com Biotech Stocks Performances & Trends Daily | |||||||||
|
|  The overall market intelligence score is 49 (0-bearish to 100-bullish) which puts Biotech sector in short term neutral trend. The market intelligence score from previous trading session is 17 and hence an improvement of trend.
| ||||||||
Here are the market intelligence trend scores of the most requested Biotech stocks at 12Stocks.com (click stock name for detailed review):
|


| 12Stocks.com: Investing in Biotech sector with Stocks | |
|
The following table helps investors and traders sort through current performance and trends (as measured by market intelligence score) of various
stocks in the Biotech sector. Quick View: Move mouse or cursor over stock symbol (ticker) to view short-term Technical chart and over stock name to view long term chart. Click on  to add stock symbol to your watchlist and to add stock symbol to your watchlist and  to view watchlist. Click on any ticker or stock name for detailed market intelligence report for that stock. to view watchlist. Click on any ticker or stock name for detailed market intelligence report for that stock. |
12Stocks.com Performance of Stocks in Biotech Sector
| Ticker | Stock Name | Watchlist | Category | Recent Price | Market Intelligence Score | Change % | YTD Change% |
| BLUE | bluebird bio |   | Biotechnology | 0.92 | 37 | 0.07 | -33.09% |
| NVO | Novo Nordisk | | Biotechnology | 126.88 | 78 | 0.02 | 22.65% |
| SRPT | Sarepta | | Biotechnology | 128.80 | 100 | 0.02 | 33.57% |
| KRON | Kronos Bio | | Biotechnology | 1.00 | 30 | 0.00 | -20.00% |
| SVA | Sinovac | | Biotechnology | 6.47 | 27 | 0.00 | 0.00% |
| PBYI | Puma nology | | Biotechnology | 5.02 | 58 | 0.00 | 15.94% |
| FBIO | Fortress | | Biotechnology | 1.72 | 17 | 0.00 | -42.86% |
| CASI | CASI | | Biotechnology | 2.42 | 27 | 0.00 | -66.20% |
| AVIR | Atea | | Biotechnology | 3.71 | 40 | 0.00 | 21.64% |
| APTO | Aptose | | Biotechnology | 1.22 | 27 | 0.00 | -51.97% |
| SLGL | Sol-Gel Technologies | | Biotechnology | 0.85 | 45 | 0.00 | -22.99% |
| NCNA | NuCana | | Biotechnology | 4.00 | 90 | 0.00 | NA |
| IMAB | I Mab | | Biotechnology | 1.80 | 70 | 0.00 | -5.26% |
| ANNX | Annexon | | Biotechnology | 4.70 | 65 | 0.00 | 3.07% |
| RPTX | Repare | | Biotechnology | 3.20 | 27 | 0.00 | -56.16% |
| RPHM | Reneo | | Biotechnology | 1.67 | 5 | 0.00 | 3.09% |
| OBIO | Orchestra BioMed | | Biotechnology | 4.39 | 20 | 0.00 | -51.81% |
| SLRN | Acelyrin | | Biotechnology | 4.24 | 25 | 0.00 | -42.47% |
| FUSN | Fusion | | Biotechnology | 21.40 | 61 | -0.09 | 122.92% |
| LGND | Ligand | | Biotechnology | 70.46 | 20 | -0.16 | -1.34% |
| PIRS | Pieris | | Biotechnology | 11.70 | 80 | -0.17 | NA |
| ITOS | iTeos | | Biotechnology | 10.78 | 68 | -0.19 | -1.46% |
| BMEA | Biomea Fusion | | Biotechnology | 10.75 | 10 | -0.19 | -26.57% |
| HRMY | Harmony | | Biotechnology | 29.25 | 53 | -0.24 | -9.41% |
| RGEN | Repligen | | Biotechnology | 166.14 | 20 | -0.26 | -7.60% |
| To view more stocks, click on Next / Previous arrows or select different range: 0 - 25 , 25 - 50 , 50 - 75 , 75 - 100 , 100 - 125 , 125 - 150 , 150 - 175 , 175 - 200 , 200 - 225 , 225 - 250 , 250 - 275 , 275 - 300 , 300 - 325 , 325 - 350 , 350 - 375 , 375 - 400 | ||
 | Click To Change The Sort Order: By Market Cap or Company Size Performance: Year-to-date, Week and Day |  |
|
Get the most comprehensive stock market coverage daily at 12Stocks.com ➞ Best Stocks Today ➞ Best Stocks Weekly ➞ Best Stocks Year-to-Date ➞ Best Stocks Trends ➞  Best Stocks Today 12Stocks.com Best Nasdaq Stocks ➞ Best S&P 500 Stocks ➞ Best Tech Stocks ➞ Best Biotech Stocks ➞ |
| Detailed Overview of Biotech Stocks |
| Biotech Technical Overview, Leaders & Laggards, Top Biotech ETF Funds & Detailed Biotech Stocks List, Charts, Trends & More |
| Biotech Sector: Technical Analysis, Trends & YTD Performance | |
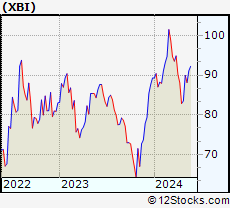
| Biotech sector, as represented by XBI, an exchange-traded fund [ETF] that holds basket of Biotech stocks (e.g, Amgen, Celgene) is down by -4.22% and is currently underperforming the overall market by -10.78% year-to-date. Below is a quick view of Technical charts and trends: | |
 XBI Weekly Chart |
|
| Long Term Trend: Not Good | |
| Medium Term Trend: Not Good | |
 XBI Daily Chart |
|
| Short Term Trend: Very Good | |
| Overall Trend Score: 49 | |
| YTD Performance: -4.22% | |
| **Trend Scores & Views Are Only For Educational Purposes And Not For Investing | |
| 12Stocks.com: Top Performing Biotech Sector Stocks | ||||||||||||||||||||||||||||||||||||||||||||||||
 The top performing Biotech sector stocks year to date are
Now, more recently, over last week, the top performing Biotech sector stocks on the move are


|
||||||||||||||||||||||||||||||||||||||||||||||||
| 12Stocks.com: Investing in Biotech Sector using Exchange Traded Funds | |
|
The following table shows list of key exchange traded funds (ETF) that
help investors track Biotech Index. For detailed view, check out our ETF Funds section of our website. Quick View: Move mouse or cursor over ETF symbol (ticker) to view short-term Technical chart and over ETF name to view long term chart. Click on ticker or stock name for detailed view. Click on to add stock symbol to your watchlist and to view watchlist. |
12Stocks.com List of ETFs that track Biotech Index
| Ticker | ETF Name | Watchlist | Recent Price | Market Intelligence Score | Change % | Week % | Year-to-date % |
| LABD | Biotech Bear 3X | | 9.69 | 35 | -7.89 | -7.89 | 0% |
| XBI | Biotech | | 85.52 | 49 | 2.43 | 2.43 | -4.22% |
| LABU | Biotech Bull 3X | | 94.11 | 42 | 7.54 | 7.54 | -22.84% |
| IBB | Biotechnology | | 128.37 | 42 | 1.49 | 1.49 | -5.51% |
| IYH | Healthcare | | 58.86 | 70 | 0.43 | 0.43 | 2.82% |
| IXJ | Global Healthcare | | 89.47 | 70 | 0.39 | 0.39 | 3.17% |
| BIB | Biotechnology | | 51.77 | 64 | 4.25 | 4.25 | -9.26% |
| IHF | Healthcare Providers | | 52.06 | 65 | 0.27 | 0.27 | -0.86% |
| CURE | Healthcare Bull 3X | | 106.25 | 39 | 0.90 | 0.9 | 4.43% |
| FBT | First NYSE | | 145.65 | 42 | 1.39 | 1.39 | -7.85% |
| BIS | Short Biotech | | 19.55 | 44 | -3.31 | -3.31 | 8.19% |
| PTH | DWA Healthcare Momentum | | 39.88 | 48 | -0.03 | -0.03 | 1.89% |
| PBE | Biotech & Genome | | 61.47 | 57 | 1.81 | 1.81 | -6.64% |
| BTEC | Principal Healthcare Innovators | | 34.84 | 42 | 1.72 | 1.72 | -4.1% |
| BBH | Biotech | | 157.37 | 49 | 1.10 | 1.1 | -4.81% |
| BBP | Bio Biotechnology Products | | 53.55 | 64 | 4.01 | 4.01 | -7.82% |
| BBC | Bio Biotechnology Clinical | | 26.25 | 75 | 2.82 | 2.82 | 7.35% |
| 12Stocks.com: Charts, Trends, Fundamental Data and Performances of Biotech Stocks | |
|
We now take in-depth look at all Biotech stocks including charts, multi-period performances and overall trends (as measured by market intelligence score). One can sort Biotech stocks (click link to choose) by Daily, Weekly and by Year-to-Date performances. Also, one can sort by size of the company or by market capitalization. |
| Select Your Default Chart Type: | |||||
| |||||
| Click on stock symbol or name for detailed view. Click on to add stock symbol to your watchlist and to view watchlist. Quick View: Move mouse or cursor over "Daily" to quickly view daily Technical stock chart and over "Weekly" to view weekly Technical stock chart. | |||||

 | BLUE bluebird bio, Inc. |
| Sector: Health Care | |
| SubSector: Biotechnology | |
| MarketCap: 3365.05 Millions | |
| Recent Price: 0.92 Market Intelligence Score: 37 | |
| Day Percent Change: 0.07% Day Change: 0.00 | |
| Week Change: 0.07% Year-to-date Change: -33.1% | |
| BLUE Links: Profile News Message Board | |
| Charts:- Daily , Weekly | |
| Add BLUE to Watchlist: View: Get Complete BLUE Trend Analysis ➞ | |
 | NVO Novo Nordisk A/S |
| Sector: Health Care | |
| SubSector: Biotechnology | |
| MarketCap: 100744 Millions | |
| Recent Price: 126.88 Market Intelligence Score: 78 | |
| Day Percent Change: 0.02% Day Change: 0.03 | |
| Week Change: 0.02% Year-to-date Change: 22.7% | |
| NVO Links: Profile News Message Board | |
| Charts:- Daily , Weekly | |
| Add NVO to Watchlist: View: Get Complete NVO Trend Analysis ➞ | |
 | SRPT Sarepta Therapeutics, Inc. |
| Sector: Health Care | |
| SubSector: Biotechnology | |
| MarketCap: 7388.05 Millions | |
| Recent Price: 128.80 Market Intelligence Score: 100 | |
| Day Percent Change: 0.02% Day Change: 0.03 | |
| Week Change: 0.02% Year-to-date Change: 33.6% | |
| SRPT Links: Profile News Message Board | |
| Charts:- Daily , Weekly | |
| Add SRPT to Watchlist: View: Get Complete SRPT Trend Analysis ➞ | |
 | KRON Kronos Bio, Inc. |
| Sector: Health Care | |
| SubSector: Biotechnology | |
| MarketCap: 17287 Millions | |
| Recent Price: 1.00 Market Intelligence Score: 30 | |
| Day Percent Change: 0.00% Day Change: 0.00 | |
| Week Change: 0% Year-to-date Change: -20.0% | |
| KRON Links: Profile News Message Board | |
| Charts:- Daily , Weekly | |
| Add KRON to Watchlist: View: Get Complete KRON Trend Analysis ➞ | |
 | SVA Sinovac Biotech Ltd. |
| Sector: Health Care | |
| SubSector: Biotechnology | |
| MarketCap: 336.88 Millions | |
| Recent Price: 6.47 Market Intelligence Score: 27 | |
| Day Percent Change: 0.00% Day Change: 0.00 | |
| Week Change: 0% Year-to-date Change: 0.0% | |
| SVA Links: Profile News Message Board | |
| Charts:- Daily , Weekly | |
| Add SVA to Watchlist: View: Get Complete SVA Trend Analysis ➞ | |
 | PBYI Puma Biotechnology, Inc. |
| Sector: Health Care | |
| SubSector: Biotechnology | |
| MarketCap: 385.585 Millions | |
| Recent Price: 5.02 Market Intelligence Score: 58 | |
| Day Percent Change: 0.00% Day Change: 0.00 | |
| Week Change: 0% Year-to-date Change: 15.9% | |
| PBYI Links: Profile News Message Board | |
| Charts:- Daily , Weekly | |
| Add PBYI to Watchlist: View: Get Complete PBYI Trend Analysis ➞ | |
 | FBIO Fortress Biotech, Inc. |
| Sector: Health Care | |
| SubSector: Biotechnology | |
| MarketCap: 116.885 Millions | |
| Recent Price: 1.72 Market Intelligence Score: 17 | |
| Day Percent Change: 0.00% Day Change: 0.00 | |
| Week Change: 0% Year-to-date Change: -42.9% | |
| FBIO Links: Profile News Message Board | |
| Charts:- Daily , Weekly | |
| Add FBIO to Watchlist: View: Get Complete FBIO Trend Analysis ➞ | |
 | CASI CASI Pharmaceuticals, Inc. |
| Sector: Health Care | |
| SubSector: Biotechnology | |
| MarketCap: 210.085 Millions | |
| Recent Price: 2.42 Market Intelligence Score: 27 | |
| Day Percent Change: 0.00% Day Change: 0.00 | |
| Week Change: 0% Year-to-date Change: -66.2% | |
| CASI Links: Profile News Message Board | |
| Charts:- Daily , Weekly | |
| Add CASI to Watchlist: View: Get Complete CASI Trend Analysis ➞ | |
 | AVIR Atea Pharmaceuticals, Inc. |
| Sector: Health Care | |
| SubSector: Biotechnology | |
| MarketCap: 22587 Millions | |
| Recent Price: 3.71 Market Intelligence Score: 40 | |
| Day Percent Change: 0.00% Day Change: 0.00 | |
| Week Change: 0% Year-to-date Change: 21.6% | |
| AVIR Links: Profile News Message Board | |
| Charts:- Daily , Weekly | |
| Add AVIR to Watchlist: View: Get Complete AVIR Trend Analysis ➞ | |
 | APTO Aptose Biosciences Inc. |
| Sector: Health Care | |
| SubSector: Biotechnology | |
| MarketCap: 484.585 Millions | |
| Recent Price: 1.22 Market Intelligence Score: 27 | |
| Day Percent Change: 0.00% Day Change: 0.00 | |
| Week Change: 0% Year-to-date Change: -52.0% | |
| APTO Links: Profile News Message Board | |
| Charts:- Daily , Weekly | |
| Add APTO to Watchlist: View: Get Complete APTO Trend Analysis ➞ | |
 | SLGL Sol-Gel Technologies Ltd. |
| Sector: Health Care | |
| SubSector: Biotechnology | |
| MarketCap: 183.285 Millions | |
| Recent Price: 0.85 Market Intelligence Score: 45 | |
| Day Percent Change: 0.00% Day Change: 0.00 | |
| Week Change: 0% Year-to-date Change: -23.0% | |
| SLGL Links: Profile News Message Board | |
| Charts:- Daily , Weekly | |
| Add SLGL to Watchlist: View: Get Complete SLGL Trend Analysis ➞ | |
 | NCNA NuCana plc |
| Sector: Health Care | |
| SubSector: Biotechnology | |
| MarketCap: 185.785 Millions | |
| Recent Price: 4.00 Market Intelligence Score: 90 | |
| Day Percent Change: 0.00% Day Change: 0.00 | |
| Week Change: 0% Year-to-date Change: 1,252.3% | |
| NCNA Links: Profile News Message Board | |
| Charts:- Daily , Weekly | |
| Add NCNA to Watchlist: View: Get Complete NCNA Trend Analysis ➞ | |
 | IMAB I Mab |
| Sector: Health Care | |
| SubSector: Biotechnology | |
| MarketCap: 26187 Millions | |
| Recent Price: 1.80 Market Intelligence Score: 70 | |
| Day Percent Change: 0.00% Day Change: 0.00 | |
| Week Change: 0% Year-to-date Change: -5.3% | |
| IMAB Links: Profile News Message Board | |
| Charts:- Daily , Weekly | |
| Add IMAB to Watchlist: View: Get Complete IMAB Trend Analysis ➞ | |
 | ANNX Annexon, Inc. |
| Sector: Health Care | |
| SubSector: Biotechnology | |
| MarketCap: 94487 Millions | |
| Recent Price: 4.70 Market Intelligence Score: 65 | |
| Day Percent Change: 0.00% Day Change: 0.00 | |
| Week Change: 0% Year-to-date Change: 3.1% | |
| ANNX Links: Profile News Message Board | |
| Charts:- Daily , Weekly | |
| Add ANNX to Watchlist: View: Get Complete ANNX Trend Analysis ➞ | |
 | RPTX Repare Therapeutics Inc. |
| Sector: Health Care | |
| SubSector: Biotechnology | |
| MarketCap: 13687 Millions | |
| Recent Price: 3.20 Market Intelligence Score: 27 | |
| Day Percent Change: 0.00% Day Change: 0.00 | |
| Week Change: 0% Year-to-date Change: -56.2% | |
| RPTX Links: Profile News Message Board | |
| Charts:- Daily , Weekly | |
| Add RPTX to Watchlist: View: Get Complete RPTX Trend Analysis ➞ | |
 | RPHM Reneo Pharmaceuticals, Inc. |
| Sector: Health Care | |
| SubSector: Biotechnology | |
| MarketCap: 233 Millions | |
| Recent Price: 1.67 Market Intelligence Score: 5 | |
| Day Percent Change: 0.00% Day Change: 0.00 | |
| Week Change: 0% Year-to-date Change: 3.1% | |
| RPHM Links: Profile News Message Board | |
| Charts:- Daily , Weekly | |
| Add RPHM to Watchlist: View: Get Complete RPHM Trend Analysis ➞ | |
 | OBIO Orchestra BioMed Holdings, Inc. |
| Sector: Health Care | |
| SubSector: Biotechnology | |
| MarketCap: 271 Millions | |
| Recent Price: 4.39 Market Intelligence Score: 20 | |
| Day Percent Change: 0.00% Day Change: 0.00 | |
| Week Change: 0% Year-to-date Change: -51.8% | |
| OBIO Links: Profile News Message Board | |
| Charts:- Daily , Weekly | |
| Add OBIO to Watchlist: View: Get Complete OBIO Trend Analysis ➞ | |
 | SLRN Acelyrin, Inc. |
| Sector: Health Care | |
| SubSector: Biotechnology | |
| MarketCap: 2030 Millions | |
| Recent Price: 4.24 Market Intelligence Score: 25 | |
| Day Percent Change: 0.00% Day Change: 0.00 | |
| Week Change: 0% Year-to-date Change: -42.5% | |
| SLRN Links: Profile News Message Board | |
| Charts:- Daily , Weekly | |
| Add SLRN to Watchlist: View: Get Complete SLRN Trend Analysis ➞ | |
 | FUSN Fusion Pharmaceuticals Inc. |
| Sector: Health Care | |
| SubSector: Biotechnology | |
| MarketCap: 52487 Millions | |
| Recent Price: 21.40 Market Intelligence Score: 61 | |
| Day Percent Change: -0.09% Day Change: -0.02 | |
| Week Change: -0.09% Year-to-date Change: 122.9% | |
| FUSN Links: Profile News Message Board | |
| Charts:- Daily , Weekly | |
| Add FUSN to Watchlist: View: Get Complete FUSN Trend Analysis ➞ | |
 | LGND Ligand Pharmaceuticals Incorporated |
| Sector: Health Care | |
| SubSector: Biotechnology | |
| MarketCap: 1344.45 Millions | |
| Recent Price: 70.46 Market Intelligence Score: 20 | |
| Day Percent Change: -0.16% Day Change: -0.11 | |
| Week Change: -0.16% Year-to-date Change: -1.3% | |
| LGND Links: Profile News Message Board | |
| Charts:- Daily , Weekly | |
| Add LGND to Watchlist: View: Get Complete LGND Trend Analysis ➞ | |
 | PIRS Pieris Pharmaceuticals, Inc. |
| Sector: Health Care | |
| SubSector: Biotechnology | |
| MarketCap: 150.785 Millions | |
| Recent Price: 11.70 Market Intelligence Score: 80 | |
| Day Percent Change: -0.17% Day Change: -0.02 | |
| Week Change: -0.17% Year-to-date Change: 6,328.6% | |
| PIRS Links: Profile News Message Board | |
| Charts:- Daily , Weekly | |
| Add PIRS to Watchlist: View: Get Complete PIRS Trend Analysis ➞ | |
 | ITOS iTeos Therapeutics, Inc. |
| Sector: Health Care | |
| SubSector: Biotechnology | |
| MarketCap: 10487 Millions | |
| Recent Price: 10.78 Market Intelligence Score: 68 | |
| Day Percent Change: -0.19% Day Change: -0.02 | |
| Week Change: -0.19% Year-to-date Change: -1.5% | |
| ITOS Links: Profile News Message Board | |
| Charts:- Daily , Weekly | |
| Add ITOS to Watchlist: View: Get Complete ITOS Trend Analysis ➞ | |
 | BMEA Biomea Fusion, Inc. |
| Sector: Health Care | |
| SubSector: Biotechnology | |
| MarketCap: 818 Millions | |
| Recent Price: 10.75 Market Intelligence Score: 10 | |
| Day Percent Change: -0.19% Day Change: -0.02 | |
| Week Change: -0.19% Year-to-date Change: -26.6% | |
| BMEA Links: Profile News Message Board | |
| Charts:- Daily , Weekly | |
| Add BMEA to Watchlist: View: Get Complete BMEA Trend Analysis ➞ | |
 | HRMY Harmony Biosciences Holdings, Inc. |
| Sector: Health Care | |
| SubSector: Biotechnology | |
| MarketCap: 24487 Millions | |
| Recent Price: 29.25 Market Intelligence Score: 53 | |
| Day Percent Change: -0.24% Day Change: -0.07 | |
| Week Change: -0.24% Year-to-date Change: -9.4% | |
| HRMY Links: Profile News Message Board | |
| Charts:- Daily , Weekly | |
| Add HRMY to Watchlist: View: Get Complete HRMY Trend Analysis ➞ | |
 | RGEN Repligen Corporation |
| Sector: Health Care | |
| SubSector: Biotechnology | |
| MarketCap: 4711.75 Millions | |
| Recent Price: 166.14 Market Intelligence Score: 20 | |
| Day Percent Change: -0.26% Day Change: -0.44 | |
| Week Change: -0.26% Year-to-date Change: -7.6% | |
| RGEN Links: Profile News Message Board | |
| Charts:- Daily , Weekly | |
| Add RGEN to Watchlist: View: Get Complete RGEN Trend Analysis ➞ | |
| To view more stocks, click on Next / Previous arrows or select different range: 0 - 25 , 25 - 50 , 50 - 75 , 75 - 100 , 100 - 125 , 125 - 150 , 150 - 175 , 175 - 200 , 200 - 225 , 225 - 250 , 250 - 275 , 275 - 300 , 300 - 325 , 325 - 350 , 350 - 375 , 375 - 400 | ||
| Click To Change The Sort Order: By Market Cap or Company Size Performance: Year-to-date, Week and Day | |
| Select Chart Type: | ||
|
Best Stocks Today 12Stocks.com |
© 2024 12Stocks.com Terms & Conditions Privacy Contact Us
All Information Provided Only For Education And Not To Be Used For Investing or Trading. See Terms & Conditions


One More Thing ... Get Best Stocks Delivered Daily!
Never Ever Miss A Move With Our Top Ten Stocks Lists
Find Best Stocks In Any Market - Bull or Bear Market
Take A Peek At Our Top Ten Stocks Lists: Daily, Weekly, Year-to-Date & Top Trends
Find Best Stocks In Any Market - Bull or Bear Market
Take A Peek At Our Top Ten Stocks Lists: Daily, Weekly, Year-to-Date & Top Trends
Biotech Stocks With Best Up Trends [0-bearish to 100-bullish]: Deciphera [100], Mesoblast [100], PTC [100], Agenus [100], Cullinan Oncology[100], Xencor [100], Zura Bio[100], Verrica [100], Agios [100], Shattuck Labs[100], Moderna [100]
Best Biotech Stocks Year-to-Date:
Pieris [6328.57%], Avenue [2707.45%], Precision [2595.89%], Inovio [2154.9%], Assembly [1472.98%], Agenus [1441.25%], NuCana [1252.27%], Adverum nologies[1167.27%], Affimed N.V[776.8%], Mesoblast [545.45%], Corbus [490.07%] Best Biotech Stocks This Week:
Deciphera [72.56%], Vaxxinity [31.65%], Acrivon [18.2%], Janux [18.18%], Ocean Biomedical[17.16%], Ginkgo Bioworks[15.08%], Codexis [14.66%], Exscientia [14.5%], Mesoblast [13.78%], PTC [12.5%], Nektar [10.61%] Best Biotech Stocks Daily:
Deciphera [72.56%], Vaxxinity [31.65%], Acrivon [18.20%], Janux [18.18%], Ocean Biomedical[17.16%], Ginkgo Bioworks[15.08%], Codexis [14.66%], Exscientia [14.50%], Mesoblast [13.78%], PTC [12.50%], Nektar [10.61%]