
 Login Sign Up


| |||||
 |  | ||||

| 12Stocks.com Market Intelligence |
Best Biotech Stocks
|
|
| Quick Read: Best Biotech Stocks List By Performances & Trends: Daily, Weekly, Year-to-Date, Market Cap (Size) & Technical Trends | |||
| Best Biotech Stocks Views: Quick Browse View, Summary & Slide Show View | |||
| 12Stocks.com Biotech Stocks Performances & Trends Daily | |||||||||
|
|  The overall market intelligence score is 57 (0-bearish to 100-bullish) which puts Biotech sector in short term neutral trend. The market intelligence score from previous trading session is 55 and hence an improvement of trend.
| ||||||||
Here are the market intelligence trend scores of the most requested Biotech stocks at 12Stocks.com (click stock name for detailed review):
|


| 12Stocks.com: Investing in Biotech sector with Stocks | |
|
The following table helps investors and traders sort through current performance and trends (as measured by market intelligence score) of various
stocks in the Biotech sector. Quick View: Move mouse or cursor over stock symbol (ticker) to view short-term Technical chart and over stock name to view long term chart. Click on  to add stock symbol to your watchlist and to add stock symbol to your watchlist and  to view watchlist. Click on any ticker or stock name for detailed market intelligence report for that stock. to view watchlist. Click on any ticker or stock name for detailed market intelligence report for that stock. |
12Stocks.com Performance of Stocks in Biotech Sector
| Ticker | Stock Name | Watchlist | Category | Recent Price | Market Intelligence Score | Change % | YTD Change% |
| INVA | Innoviva |   | Biotechnology | 15.53 | 85 | 0.52 | -3.18% |
| INSM | Insmed | | Biotechnology | 26.08 | 64 | 0.50 | -15.84% |
| ALVR | AlloVir | | Biotechnology | 0.80 | 58 | 0.50 | 17.15% |
| IBIO | iBio | | Biotechnology | 2.00 | 58 | 0.50 | 45.99% |
| KALA | Kala | | Biotechnology | 7.04 | 69 | 0.47 | 0.57% |
| KYMR | Kymera | | Biotechnology | 38.44 | 69 | 0.46 | 51.28% |
| KALV | KalVista | | Biotechnology | 12.19 | 30 | 0.41 | -0.49% |
| PHVS | Pharvaris N.V | | Biotechnology | 22.62 | 32 | 0.40 | -20.14% |
| LYEL | Lyell Immunopharma | | Biotechnology | 2.54 | 74 | 0.40 | 29.26% |
| CYTK | Cytokinetics | | Biotechnology | 65.28 | 42 | 0.35 | -21.81% |
| EDIT | Editas Medicine | | Biotechnology | 5.68 | 64 | 0.35 | -43.93% |
| VBIV | VBI Vaccines | | Biotechnology | 0.60 | 80 | 0.35 | 2.47% |
| NUVB | Nuvation Bio | | Biotechnology | 3.19 | 61 | 0.31 | 110.56% |
| TSVT | 2seventy bio | | Biotechnology | 4.96 | 69 | 0.30 | 14.68% |
| KURA | Kura Oncology | | Biotechnology | 21.07 | 77 | 0.29 | 46.52% |
| RPHM | Reneo | | Biotechnology | 1.74 | 88 | 0.29 | 7.41% |
| CARA | Cara | | Biotechnology | 0.79 | 57 | 0.28 | 6.62% |
| ITCI | Intra-Cellular Therapies | | Biotechnology | 71.21 | 68 | 0.28 | -0.57% |
| AMGN | Amgen | | Biotechnology | 300.30 | 88 | 0.27 | 4.26% |
| NBTX | Nanobiotix S.A | | Biotechnology | 6.41 | 90 | 0.16 | -13.61% |
| FDMT | 4D Molecular | | Biotechnology | 26.80 | 59 | 0.15 | 29.47% |
| IVA | Inventiva S.A | | Biotechnology | 3.45 | 52 | 0.00 | -23.50% |
| SVA | Sinovac | | Biotechnology | 6.47 | 17 | 0.00 | 0.00% |
| AVXL | Anavex Life | | Biotechnology | 3.84 | 74 | 0.00 | -58.75% |
| FBIO | Fortress | | Biotechnology | 1.78 | 35 | 0.00 | -40.86% |
| To view more stocks, click on Next / Previous arrows or select different range: 0 - 25 , 25 - 50 , 50 - 75 , 75 - 100 , 100 - 125 , 125 - 150 , 150 - 175 , 175 - 200 , 200 - 225 , 225 - 250 , 250 - 275 , 275 - 300 , 300 - 325 , 325 - 350 , 350 - 375 , 375 - 400 | ||
 | Click To Change The Sort Order: By Market Cap or Company Size Performance: Year-to-date, Week and Day |  |
|
Get the most comprehensive stock market coverage daily at 12Stocks.com ➞ Best Stocks Today ➞ Best Stocks Weekly ➞ Best Stocks Year-to-Date ➞ Best Stocks Trends ➞  Best Stocks Today 12Stocks.com Best Nasdaq Stocks ➞ Best S&P 500 Stocks ➞ Best Tech Stocks ➞ Best Biotech Stocks ➞ |
| Detailed Overview of Biotech Stocks |
| Biotech Technical Overview, Leaders & Laggards, Top Biotech ETF Funds & Detailed Biotech Stocks List, Charts, Trends & More |
| Biotech Sector: Technical Analysis, Trends & YTD Performance | |
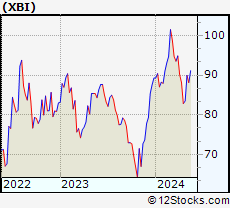
| Biotech sector, as represented by XBI, an exchange-traded fund [ETF] that holds basket of Biotech stocks (e.g, Amgen, Celgene) is up by 1.28% and is currently underperforming the overall market by -6.84% year-to-date. Below is a quick view of Technical charts and trends: | |
 XBI Weekly Chart |
|
| Long Term Trend: Not Good | |
| Medium Term Trend: Very Good | |
 XBI Daily Chart |
|
| Short Term Trend: Very Good | |
| Overall Trend Score: 57 | |
| YTD Performance: 1.28% | |
| **Trend Scores & Views Are Only For Educational Purposes And Not For Investing | |
| 12Stocks.com: Top Performing Biotech Sector Stocks | ||||||||||||||||||||||||||||||||||||||||||||||||
 The top performing Biotech sector stocks year to date are
Now, more recently, over last week, the top performing Biotech sector stocks on the move are


|
||||||||||||||||||||||||||||||||||||||||||||||||
| 12Stocks.com: Investing in Biotech Sector using Exchange Traded Funds | |
|
The following table shows list of key exchange traded funds (ETF) that
help investors track Biotech Index. For detailed view, check out our ETF Funds section of our website. Quick View: Move mouse or cursor over ETF symbol (ticker) to view short-term Technical chart and over ETF name to view long term chart. Click on ticker or stock name for detailed view. Click on to add stock symbol to your watchlist and to view watchlist. |
12Stocks.com List of ETFs that track Biotech Index
| Ticker | ETF Name | Watchlist | Recent Price | Market Intelligence Score | Change % | Week % | Year-to-date % |
| LABD | Biotech Bear 3X | | 8.16 | 46 | 0.25 | -1.45 | -15.79% |
| XBI | Biotech | | 90.43 | 57 | -0.17 | 0.5 | 1.28% |
| LABU | Biotech Bull 3X | | 110.25 | 52 | -0.33 | 1.16 | -9.61% |
| IBB | Biotechnology | | 133.28 | 62 | 0.20 | 0.24 | -1.89% |
| IYH | Healthcare | | 60.00 | 64 | 0.79 | 1.25 | 4.81% |
| IHF | Healthcare Providers | | 52.51 | 67 | 1.04 | 1.59 | 0% |
| IXJ | Global Healthcare | | 90.81 | 82 | 0.84 | 1.28 | 4.72% |
| CURE | Healthcare Bull 3X | | 110.75 | 64 | 2.54 | 3.61 | 8.86% |
| PTH | DWA Healthcare Momentum | | 42.12 | 62 | 0.48 | 0.17 | 7.61% |
| BIB | Biotechnology | | 55.60 | 55 | 0.42 | -0.05 | -2.54% |
| FBT | First NYSE | | 148.96 | 57 | 0.36 | 0.51 | -5.75% |
| BBC | Bio Biotechnology Clinical | | 28.10 | 52 | 0.64 | 0.75 | 14.92% |
| BBH | Biotech | | 163.85 | 75 | 0.04 | -0.18 | -0.88% |
| PBE | Biotech & Genome | | 64.18 | 57 | 0.93 | 0.11 | -2.52% |
| BTEC | Principal Healthcare Innovators | | 37.07 | 74 | 0.03 | 0.27 | 2.04% |
| BIS | Short Biotech | | 18.00 | 53 | -1.21 | 0.06 | -0.39% |
| BBP | Bio Biotechnology Products | | 55.46 | 52 | -0.52 | -0.05 | -4.53% |
| 12Stocks.com: Charts, Trends, Fundamental Data and Performances of Biotech Stocks | |
|
We now take in-depth look at all Biotech stocks including charts, multi-period performances and overall trends (as measured by market intelligence score). One can sort Biotech stocks (click link to choose) by Daily, Weekly and by Year-to-Date performances. Also, one can sort by size of the company or by market capitalization. |
| Select Your Default Chart Type: | |||||
| |||||
| Click on stock symbol or name for detailed view. Click on to add stock symbol to your watchlist and to view watchlist. Quick View: Move mouse or cursor over "Daily" to quickly view daily Technical stock chart and over "Weekly" to view weekly Technical stock chart. | |||||

 | INVA Innoviva, Inc. |
| Sector: Health Care | |
| SubSector: Biotechnology | |
| MarketCap: 1023.15 Millions | |
| Recent Price: 15.53 Market Intelligence Score: 85 | |
| Day Percent Change: 0.52% Day Change: 0.08 | |
| Week Change: 2.17% Year-to-date Change: -3.2% | |
| INVA Links: Profile News Message Board | |
| Charts:- Daily , Weekly | |
| Add INVA to Watchlist: View: Get Complete INVA Trend Analysis ➞ | |
 | INSM Insmed Incorporated |
| Sector: Health Care | |
| SubSector: Biotechnology | |
| MarketCap: 1452.45 Millions | |
| Recent Price: 26.08 Market Intelligence Score: 64 | |
| Day Percent Change: 0.50% Day Change: 0.13 | |
| Week Change: 2.07% Year-to-date Change: -15.8% | |
| INSM Links: Profile News Message Board | |
| Charts:- Daily , Weekly | |
| Add INSM to Watchlist: View: Get Complete INSM Trend Analysis ➞ | |
 | ALVR AlloVir, Inc. |
| Sector: Health Care | |
| SubSector: Biotechnology | |
| MarketCap: 25787 Millions | |
| Recent Price: 0.80 Market Intelligence Score: 58 | |
| Day Percent Change: 0.50% Day Change: 0.00 | |
| Week Change: -0.13% Year-to-date Change: 17.2% | |
| ALVR Links: Profile News Message Board | |
| Charts:- Daily , Weekly | |
| Add ALVR to Watchlist: View: Get Complete ALVR Trend Analysis ➞ | |
 | IBIO iBio, Inc. |
| Sector: Health Care | |
| SubSector: Biotechnology | |
| MarketCap: 110.885 Millions | |
| Recent Price: 2.00 Market Intelligence Score: 58 | |
| Day Percent Change: 0.50% Day Change: 0.01 | |
| Week Change: 0.5% Year-to-date Change: 46.0% | |
| IBIO Links: Profile News Message Board | |
| Charts:- Daily , Weekly | |
| Add IBIO to Watchlist: View: Get Complete IBIO Trend Analysis ➞ | |
 | KALA Kala Pharmaceuticals, Inc. |
| Sector: Health Care | |
| SubSector: Biotechnology | |
| MarketCap: 276.485 Millions | |
| Recent Price: 7.04 Market Intelligence Score: 69 | |
| Day Percent Change: 0.47% Day Change: 0.03 | |
| Week Change: 0.47% Year-to-date Change: 0.6% | |
| KALA Links: Profile News Message Board | |
| Charts:- Daily , Weekly | |
| Add KALA to Watchlist: View: Get Complete KALA Trend Analysis ➞ | |
 | KYMR Kymera Therapeutics, Inc. |
| Sector: Health Care | |
| SubSector: Biotechnology | |
| MarketCap: 27087 Millions | |
| Recent Price: 38.44 Market Intelligence Score: 69 | |
| Day Percent Change: 0.46% Day Change: 0.17 | |
| Week Change: 2.92% Year-to-date Change: 51.3% | |
| KYMR Links: Profile News Message Board | |
| Charts:- Daily , Weekly | |
| Add KYMR to Watchlist: View: Get Complete KYMR Trend Analysis ➞ | |
 | KALV KalVista Pharmaceuticals, Inc. |
| Sector: Health Care | |
| SubSector: Biotechnology | |
| MarketCap: 138.385 Millions | |
| Recent Price: 12.19 Market Intelligence Score: 30 | |
| Day Percent Change: 0.41% Day Change: 0.05 | |
| Week Change: 0.49% Year-to-date Change: -0.5% | |
| KALV Links: Profile News Message Board | |
| Charts:- Daily , Weekly | |
| Add KALV to Watchlist: View: Get Complete KALV Trend Analysis ➞ | |
 | PHVS Pharvaris N.V. |
| Sector: Health Care | |
| SubSector: Biotechnology | |
| MarketCap: 475 Millions | |
| Recent Price: 22.62 Market Intelligence Score: 32 | |
| Day Percent Change: 0.40% Day Change: 0.09 | |
| Week Change: -2.96% Year-to-date Change: -20.1% | |
| PHVS Links: Profile News Message Board | |
| Charts:- Daily , Weekly | |
| Add PHVS to Watchlist: View: Get Complete PHVS Trend Analysis ➞ | |
 | LYEL Lyell Immunopharma, Inc. |
| Sector: Health Care | |
| SubSector: Biotechnology | |
| MarketCap: 809 Millions | |
| Recent Price: 2.54 Market Intelligence Score: 74 | |
| Day Percent Change: 0.40% Day Change: 0.01 | |
| Week Change: 4.31% Year-to-date Change: 29.3% | |
| LYEL Links: Profile News Message Board | |
| Charts:- Daily , Weekly | |
| Add LYEL to Watchlist: View: Get Complete LYEL Trend Analysis ➞ | |
 | CYTK Cytokinetics, Incorporated |
| Sector: Health Care | |
| SubSector: Biotechnology | |
| MarketCap: 654.285 Millions | |
| Recent Price: 65.28 Market Intelligence Score: 42 | |
| Day Percent Change: 0.35% Day Change: 0.23 | |
| Week Change: 0.02% Year-to-date Change: -21.8% | |
| CYTK Links: Profile News Message Board | |
| Charts:- Daily , Weekly | |
| Add CYTK to Watchlist: View: Get Complete CYTK Trend Analysis ➞ | |
 | EDIT Editas Medicine, Inc. |
| Sector: Health Care | |
| SubSector: Biotechnology | |
| MarketCap: 1194.95 Millions | |
| Recent Price: 5.68 Market Intelligence Score: 64 | |
| Day Percent Change: 0.35% Day Change: 0.02 | |
| Week Change: 0.18% Year-to-date Change: -43.9% | |
| EDIT Links: Profile News Message Board | |
| Charts:- Daily , Weekly | |
| Add EDIT to Watchlist: View: Get Complete EDIT Trend Analysis ➞ | |
 | VBIV VBI Vaccines Inc. |
| Sector: Health Care | |
| SubSector: Biotechnology | |
| MarketCap: 139.785 Millions | |
| Recent Price: 0.60 Market Intelligence Score: 80 | |
| Day Percent Change: 0.35% Day Change: 0.00 | |
| Week Change: 2.03% Year-to-date Change: 2.5% | |
| VBIV Links: Profile News Message Board | |
| Charts:- Daily , Weekly | |
| Add VBIV to Watchlist: View: Get Complete VBIV Trend Analysis ➞ | |
 | NUVB Nuvation Bio Inc. |
| Sector: Health Care | |
| SubSector: Biotechnology | |
| MarketCap: 381 Millions | |
| Recent Price: 3.19 Market Intelligence Score: 61 | |
| Day Percent Change: 0.31% Day Change: 0.01 | |
| Week Change: -0.78% Year-to-date Change: 110.6% | |
| NUVB Links: Profile News Message Board | |
| Charts:- Daily , Weekly | |
| Add NUVB to Watchlist: View: Get Complete NUVB Trend Analysis ➞ | |
 | TSVT 2seventy bio, Inc. |
| Sector: Health Care | |
| SubSector: Biotechnology | |
| MarketCap: 504 Millions | |
| Recent Price: 4.96 Market Intelligence Score: 69 | |
| Day Percent Change: 0.30% Day Change: 0.01 | |
| Week Change: 3.77% Year-to-date Change: 14.7% | |
| TSVT Links: Profile News Message Board | |
| Charts:- Daily , Weekly | |
| Add TSVT to Watchlist: View: Get Complete TSVT Trend Analysis ➞ | |
 | KURA Kura Oncology, Inc. |
| Sector: Health Care | |
| SubSector: Biotechnology | |
| MarketCap: 401.885 Millions | |
| Recent Price: 21.07 Market Intelligence Score: 77 | |
| Day Percent Change: 0.29% Day Change: 0.06 | |
| Week Change: 2.13% Year-to-date Change: 46.5% | |
| KURA Links: Profile News Message Board | |
| Charts:- Daily , Weekly | |
| Add KURA to Watchlist: View: Get Complete KURA Trend Analysis ➞ | |
 | RPHM Reneo Pharmaceuticals, Inc. |
| Sector: Health Care | |
| SubSector: Biotechnology | |
| MarketCap: 233 Millions | |
| Recent Price: 1.74 Market Intelligence Score: 88 | |
| Day Percent Change: 0.29% Day Change: 0.00 | |
| Week Change: 0.58% Year-to-date Change: 7.4% | |
| RPHM Links: Profile News Message Board | |
| Charts:- Daily , Weekly | |
| Add RPHM to Watchlist: View: Get Complete RPHM Trend Analysis ➞ | |
 | CARA Cara Therapeutics, Inc. |
| Sector: Health Care | |
| SubSector: Biotechnology | |
| MarketCap: 597.985 Millions | |
| Recent Price: 0.79 Market Intelligence Score: 57 | |
| Day Percent Change: 0.28% Day Change: 0.00 | |
| Week Change: 1.8% Year-to-date Change: 6.6% | |
| CARA Links: Profile News Message Board | |
| Charts:- Daily , Weekly | |
| Add CARA to Watchlist: View: Get Complete CARA Trend Analysis ➞ | |
 | ITCI Intra-Cellular Therapies, Inc. |
| Sector: Health Care | |
| SubSector: Biotechnology | |
| MarketCap: 991.885 Millions | |
| Recent Price: 71.21 Market Intelligence Score: 68 | |
| Day Percent Change: 0.28% Day Change: 0.20 | |
| Week Change: 3.5% Year-to-date Change: -0.6% | |
| ITCI Links: Profile News Message Board | |
| Charts:- Daily , Weekly | |
| Add ITCI to Watchlist: View: Get Complete ITCI Trend Analysis ➞ | |
 | AMGN Amgen Inc. |
| Sector: Health Care | |
| SubSector: Biotechnology | |
| MarketCap: 121030 Millions | |
| Recent Price: 300.30 Market Intelligence Score: 88 | |
| Day Percent Change: 0.27% Day Change: 0.82 | |
| Week Change: -3.53% Year-to-date Change: 4.3% | |
| AMGN Links: Profile News Message Board | |
| Charts:- Daily , Weekly | |
| Add AMGN to Watchlist: View: Get Complete AMGN Trend Analysis ➞ | |
 | NBTX Nanobiotix S.A. |
| Sector: Health Care | |
| SubSector: Biotechnology | |
| MarketCap: 177 Millions | |
| Recent Price: 6.41 Market Intelligence Score: 90 | |
| Day Percent Change: 0.16% Day Change: 0.01 | |
| Week Change: 7.19% Year-to-date Change: -13.6% | |
| NBTX Links: Profile News Message Board | |
| Charts:- Daily , Weekly | |
| Add NBTX to Watchlist: View: Get Complete NBTX Trend Analysis ➞ | |
 | FDMT 4D Molecular Therapeutics, Inc. |
| Sector: Health Care | |
| SubSector: Biotechnology | |
| MarketCap: 772 Millions | |
| Recent Price: 26.80 Market Intelligence Score: 59 | |
| Day Percent Change: 0.15% Day Change: 0.04 | |
| Week Change: 0.37% Year-to-date Change: 29.5% | |
| FDMT Links: Profile News Message Board | |
| Charts:- Daily , Weekly | |
| Add FDMT to Watchlist: View: Get Complete FDMT Trend Analysis ➞ | |
 | IVA Inventiva S.A. |
| Sector: Health Care | |
| SubSector: Biotechnology | |
| MarketCap: 46487 Millions | |
| Recent Price: 3.45 Market Intelligence Score: 52 | |
| Day Percent Change: 0.00% Day Change: 0.00 | |
| Week Change: 3.6% Year-to-date Change: -23.5% | |
| IVA Links: Profile News Message Board | |
| Charts:- Daily , Weekly | |
| Add IVA to Watchlist: View: Get Complete IVA Trend Analysis ➞ | |
 | SVA Sinovac Biotech Ltd. |
| Sector: Health Care | |
| SubSector: Biotechnology | |
| MarketCap: 336.88 Millions | |
| Recent Price: 6.47 Market Intelligence Score: 17 | |
| Day Percent Change: 0.00% Day Change: 0.00 | |
| Week Change: 0% Year-to-date Change: 0.0% | |
| SVA Links: Profile News Message Board | |
| Charts:- Daily , Weekly | |
| Add SVA to Watchlist: View: Get Complete SVA Trend Analysis ➞ | |
 | AVXL Anavex Life Sciences Corp. |
| Sector: Health Care | |
| SubSector: Biotechnology | |
| MarketCap: 175.985 Millions | |
| Recent Price: 3.84 Market Intelligence Score: 74 | |
| Day Percent Change: 0.00% Day Change: 0.00 | |
| Week Change: -0.26% Year-to-date Change: -58.8% | |
| AVXL Links: Profile News Message Board | |
| Charts:- Daily , Weekly | |
| Add AVXL to Watchlist: View: Get Complete AVXL Trend Analysis ➞ | |
 | FBIO Fortress Biotech, Inc. |
| Sector: Health Care | |
| SubSector: Biotechnology | |
| MarketCap: 116.885 Millions | |
| Recent Price: 1.78 Market Intelligence Score: 35 | |
| Day Percent Change: 0.00% Day Change: 0.00 | |
| Week Change: 1.71% Year-to-date Change: -40.9% | |
| FBIO Links: Profile News Message Board | |
| Charts:- Daily , Weekly | |
| Add FBIO to Watchlist: View: Get Complete FBIO Trend Analysis ➞ | |
| To view more stocks, click on Next / Previous arrows or select different range: 0 - 25 , 25 - 50 , 50 - 75 , 75 - 100 , 100 - 125 , 125 - 150 , 150 - 175 , 175 - 200 , 200 - 225 , 225 - 250 , 250 - 275 , 275 - 300 , 300 - 325 , 325 - 350 , 350 - 375 , 375 - 400 | ||
| Click To Change The Sort Order: By Market Cap or Company Size Performance: Year-to-date, Week and Day | |
| Select Chart Type: | ||
|
Best Stocks Today 12Stocks.com |
© 2024 12Stocks.com Terms & Conditions Privacy Contact Us
All Information Provided Only For Education And Not To Be Used For Investing or Trading. See Terms & Conditions


One More Thing ... Get Best Stocks Delivered Daily!
Never Ever Miss A Move With Our Top Ten Stocks Lists
Find Best Stocks In Any Market - Bull or Bear Market
Take A Peek At Our Top Ten Stocks Lists: Daily, Weekly, Year-to-Date & Top Trends
Find Best Stocks In Any Market - Bull or Bear Market
Take A Peek At Our Top Ten Stocks Lists: Daily, Weekly, Year-to-Date & Top Trends
Biotech Stocks With Best Up Trends [0-bearish to 100-bullish]: Design [100], Summit [100], Vanda [100], Emergent Bio[100], Cue Biopharma[100], Edgewise [100], Verrica [100], Avid Bioservices[100], Entrada [100], United [100], Blueprint Medicines[100]
Best Biotech Stocks Year-to-Date:
Pieris [5965.93%], Precision [2782.19%], Avenue [2620.5%], Inovio [2086.27%], Assembly [1438.84%], Agenus [1350.66%], Adverum nologies[1273.54%], NuCana [1211.7%], Affimed N.V[736.8%], Mesoblast [623.18%], Corbus [558.44%] Best Biotech Stocks This Week:
Design [23.42%], Passage Bio[21.37%], Summit [20.96%], FibroGen [20.18%], Lineage Cell[18.87%], BioCryst [18.2%], Vigil Neuroscience[17.28%], ALX Oncology[14.32%], Cerus [14.2%], Esperion [13.94%], Emergent Bio[13.11%] Best Biotech Stocks Daily:
Design [28.85%], Summit [18.79%], FibroGen [18.10%], Vanda [13.22%], Passage Bio[12.77%], Esperion [11.79%], Emergent Bio[10.55%], Vigil Neuroscience[10.38%], Athira Pharma[10.10%], ALX Oncology[9.75%], Sutro Biopharma[9.25%]