
 Login Sign Up


| |||||
 |  | ||||

| 12Stocks.com Market Intelligence |
Best Biotech Stocks
|
|
| Quick Read: Best Biotech Stocks List By Performances & Trends: Daily, Weekly, Year-to-Date, Market Cap (Size) & Technical Trends | |||
| Best Biotech Stocks Views: Quick Browse View, Summary & Slide Show View | |||
| 12Stocks.com Biotech Stocks Performances & Trends Daily | |||||||||
|
|  The overall market intelligence score is 25 (0-bearish to 100-bullish) which puts Biotech sector in short term bearish to neutral trend. The market intelligence score from previous trading session is 32 and a deterioration of trend continues.
| ||||||||
Here are the market intelligence trend scores of the most requested Biotech stocks at 12Stocks.com (click stock name for detailed review):
|


| 12Stocks.com: Investing in Biotech sector with Stocks | |
|
The following table helps investors and traders sort through current performance and trends (as measured by market intelligence score) of various
stocks in the Biotech sector. Quick View: Move mouse or cursor over stock symbol (ticker) to view short-term Technical chart and over stock name to view long term chart. Click on  to add stock symbol to your watchlist and to add stock symbol to your watchlist and  to view watchlist. Click on any ticker or stock name for detailed market intelligence report for that stock. to view watchlist. Click on any ticker or stock name for detailed market intelligence report for that stock. |
12Stocks.com Performance of Stocks in Biotech Sector
| Ticker | Stock Name | Watchlist | Category | Recent Price | Market Intelligence Score | Change % | YTD Change% |
| LYRA | Lyra |   | Biotechnology | 5.26 | 58 | 0.67 | 0.86% |
| OBIO | Orchestra BioMed | | Biotechnology | 4.52 | 17 | 0.67 | -50.38% |
| AVDL | Avadel | | Biotechnology | 17.77 | 93 | 0.62 | 25.85% |
| CERS | Cerus | | Biotechnology | 1.67 | 28 | 0.60 | -22.69% |
| RPRX | Royalty Pharma | | Biotechnology | 28.15 | 17 | 0.59 | 0.20% |
| PMVP | PMV | | Biotechnology | 1.70 | 59 | 0.59 | -45.16% |
| RFL | Rafael | | Biotechnology | 1.72 | 40 | 0.58 | -6.01% |
| MOR | MorphoSys AG | | Biotechnology | 18.14 | 63 | 0.50 | 83.23% |
| BIIB | Biogen | | Biotechnology | 202.97 | 57 | 0.49 | -21.56% |
| ALLK | Allakos | | Biotechnology | 1.02 | 20 | 0.49 | -62.45% |
| ARGX | argenx SE | | Biotechnology | 376.57 | 20 | 0.42 | -1.01% |
| ALNY | Alnylam | | Biotechnology | 144.40 | 18 | 0.41 | -24.56% |
| IKNA | Ikena Oncology | | Biotechnology | 1.31 | 34 | 0.38 | -34.25% |
| RGNX | REGENXBIO | | Biotechnology | 16.10 | 36 | 0.37 | -10.31% |
| SPRO | Spero | | Biotechnology | 1.43 | 15 | 0.35 | -3.06% |
| CGEM | Cullinan Oncology | | Biotechnology | 18.97 | 93 | 0.34 | 86.02% |
| CERE | Cerevel | | Biotechnology | 42.00 | 40 | 0.31 | -0.92% |
| RPHM | Reneo | | Biotechnology | 1.68 | 43 | 0.30 | 3.70% |
| ROIV | Roivant | | Biotechnology | 10.85 | 41 | 0.23 | -2.34% |
| VXRT | Vaxart | | Biotechnology | 0.71 | 10 | 0.21 | 24.16% |
| OMER | Omeros | | Biotechnology | 3.04 | 8 | 0.16 | -6.88% |
| MNPR | Monopar | | Biotechnology | 0.63 | 83 | 0.16 | 83.43% |
| ACRV | Acrivon | | Biotechnology | 9.47 | 78 | 0.11 | 90.54% |
| FUSN | Fusion | | Biotechnology | 21.42 | 83 | 0.09 | 123.13% |
| SGMO | Sangamo | | Biotechnology | 0.49 | 44 | 0.06 | -9.20% |
| To view more stocks, click on Next / Previous arrows or select different range: 0 - 25 , 25 - 50 , 50 - 75 , 75 - 100 , 100 - 125 , 125 - 150 , 150 - 175 , 175 - 200 , 200 - 225 , 225 - 250 , 250 - 275 , 275 - 300 , 300 - 325 , 325 - 350 , 350 - 375 , 375 - 400 | ||
 | Click To Change The Sort Order: By Market Cap or Company Size Performance: Year-to-date, Week and Day |  |
|
Get the most comprehensive stock market coverage daily at 12Stocks.com ➞ Best Stocks Today ➞ Best Stocks Weekly ➞ Best Stocks Year-to-Date ➞ Best Stocks Trends ➞  Best Stocks Today 12Stocks.com Best Nasdaq Stocks ➞ Best S&P 500 Stocks ➞ Best Tech Stocks ➞ Best Biotech Stocks ➞ |
| Detailed Overview of Biotech Stocks |
| Biotech Technical Overview, Leaders & Laggards, Top Biotech ETF Funds & Detailed Biotech Stocks List, Charts, Trends & More |
| Biotech Sector: Technical Analysis, Trends & YTD Performance | |
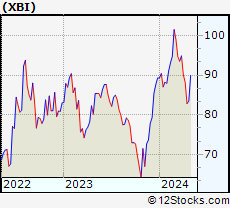
| Biotech sector, as represented by XBI, an exchange-traded fund [ETF] that holds basket of Biotech stocks (e.g, Amgen, Celgene) is down by -8.08% and is currently underperforming the overall market by -12.93% year-to-date. Below is a quick view of Technical charts and trends: | |
 XBI Weekly Chart |
|
| Long Term Trend: Not Good | |
| Medium Term Trend: Not Good | |
 XBI Daily Chart |
|
| Short Term Trend: Very Good | |
| Overall Trend Score: 25 | |
| YTD Performance: -8.08% | |
| **Trend Scores & Views Are Only For Educational Purposes And Not For Investing | |
| 12Stocks.com: Top Performing Biotech Sector Stocks | ||||||||||||||||||||||||||||||||||||||||||||||||
 The top performing Biotech sector stocks year to date are
Now, more recently, over last week, the top performing Biotech sector stocks on the move are


|
||||||||||||||||||||||||||||||||||||||||||||||||
| 12Stocks.com: Investing in Biotech Sector using Exchange Traded Funds | |
|
The following table shows list of key exchange traded funds (ETF) that
help investors track Biotech Index. For detailed view, check out our ETF Funds section of our website. Quick View: Move mouse or cursor over ETF symbol (ticker) to view short-term Technical chart and over ETF name to view long term chart. Click on ticker or stock name for detailed view. Click on to add stock symbol to your watchlist and to view watchlist. |
12Stocks.com List of ETFs that track Biotech Index
| Ticker | ETF Name | Watchlist | Recent Price | Market Intelligence Score | Change % | Week % | Year-to-date % |
| LABD | Biotech Bear 3X | | 11.04 | 75 | 6.46 | 2.22 | 13.93% |
| XBI | Biotech | | 82.08 | 25 | -2.22 | -0.91 | -8.08% |
| LABU | Biotech Bull 3X | | 83.50 | 25 | -6.60 | -2.96 | -31.54% |
| IBB | Biotechnology | | 125.78 | 18 | -1.55 | 0.85 | -7.41% |
| IYH | Healthcare | | 58.65 | 45 | -0.74 | 0.84 | 2.45% |
| IHF | Healthcare Providers | | 52.11 | 55 | -0.29 | -0.19 | -0.76% |
| BBH | Biotech | | 157.33 | 49 | 0.00 | 3.26 | -4.83% |
| IXJ | Global Healthcare | | 88.83 | 25 | -0.54 | 1.23 | 2.43% |
| FBT | First NYSE | | 142.85 | 25 | -1.75 | 0.83 | -9.62% |
| BIB | Biotechnology | | 50.12 | 32 | -0.12 | 3.98 | -12.15% |
| CURE | Healthcare Bull 3X | | 105.25 | 25 | -2.41 | 1.86 | 3.45% |
| BIS | Short Biotech | | 20.09 | 61 | 0.00 | -3.85 | 11.18% |
| PTH | DWA Healthcare Momentum | | 39.60 | 46 | -0.08 | 0.18 | 1.18% |
| PBE | Biotech & Genome | | 60.05 | 32 | -1.36 | 0.33 | -8.79% |
| BTEC | Principal Healthcare Innovators | | 34.21 | 32 | 0.02 | 1.04 | -5.83% |
| BBC | Bio Biotechnology Clinical | | 24.51 | 36 | -4.35 | -0.8 | 0.24% |
| BBP | Bio Biotechnology Products | | 51.14 | 35 | -2.40 | 1.41 | -11.96% |
| 12Stocks.com: Charts, Trends, Fundamental Data and Performances of Biotech Stocks | |
|
We now take in-depth look at all Biotech stocks including charts, multi-period performances and overall trends (as measured by market intelligence score). One can sort Biotech stocks (click link to choose) by Daily, Weekly and by Year-to-Date performances. Also, one can sort by size of the company or by market capitalization. |
| Select Your Default Chart Type: | |||||
| |||||
| Click on stock symbol or name for detailed view. Click on to add stock symbol to your watchlist and to view watchlist. Quick View: Move mouse or cursor over "Daily" to quickly view daily Technical stock chart and over "Weekly" to view weekly Technical stock chart. | |||||

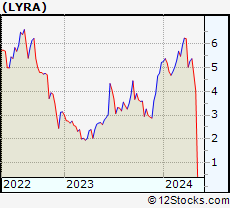 | LYRA Lyra Therapeutics, Inc. |
| Sector: Health Care | |
| SubSector: Biotechnology | |
| MarketCap: 12487 Millions | |
| Recent Price: 5.26 Market Intelligence Score: 58 | |
| Day Percent Change: 0.67% Day Change: 0.03 | |
| Week Change: -2.05% Year-to-date Change: 0.9% | |
| LYRA Links: Profile News Message Board | |
| Charts:- Daily , Weekly | |
| Add LYRA to Watchlist: View: Get Complete LYRA Trend Analysis ➞ | |
 | OBIO Orchestra BioMed Holdings, Inc. |
| Sector: Health Care | |
| SubSector: Biotechnology | |
| MarketCap: 271 Millions | |
| Recent Price: 4.52 Market Intelligence Score: 17 | |
| Day Percent Change: 0.67% Day Change: 0.03 | |
| Week Change: -2.59% Year-to-date Change: -50.4% | |
| OBIO Links: Profile News Message Board | |
| Charts:- Daily , Weekly | |
| Add OBIO to Watchlist: View: Get Complete OBIO Trend Analysis ➞ | |
 | AVDL Avadel Pharmaceuticals plc |
| Sector: Health Care | |
| SubSector: Biotechnology | |
| MarketCap: 354.485 Millions | |
| Recent Price: 17.77 Market Intelligence Score: 93 | |
| Day Percent Change: 0.62% Day Change: 0.11 | |
| Week Change: 2.54% Year-to-date Change: 25.9% | |
| AVDL Links: Profile News Message Board | |
| Charts:- Daily , Weekly | |
| Add AVDL to Watchlist: View: Get Complete AVDL Trend Analysis ➞ | |
 | CERS Cerus Corporation |
| Sector: Health Care | |
| SubSector: Biotechnology | |
| MarketCap: 607.185 Millions | |
| Recent Price: 1.67 Market Intelligence Score: 28 | |
| Day Percent Change: 0.60% Day Change: 0.01 | |
| Week Change: -0.6% Year-to-date Change: -22.7% | |
| CERS Links: Profile News Message Board | |
| Charts:- Daily , Weekly | |
| Add CERS to Watchlist: View: Get Complete CERS Trend Analysis ➞ | |
 | RPRX Royalty Pharma plc |
| Sector: Health Care | |
| SubSector: Biotechnology | |
| MarketCap: 28457 Millions | |
| Recent Price: 28.15 Market Intelligence Score: 17 | |
| Day Percent Change: 0.59% Day Change: 0.16 | |
| Week Change: -0.05% Year-to-date Change: 0.2% | |
| RPRX Links: Profile News Message Board | |
| Charts:- Daily , Weekly | |
| Add RPRX to Watchlist: View: Get Complete RPRX Trend Analysis ➞ | |
 | PMVP PMV Pharmaceuticals, Inc. |
| Sector: Health Care | |
| SubSector: Biotechnology | |
| MarketCap: 20187 Millions | |
| Recent Price: 1.70 Market Intelligence Score: 59 | |
| Day Percent Change: 0.59% Day Change: 0.01 | |
| Week Change: 4.94% Year-to-date Change: -45.2% | |
| PMVP Links: Profile News Message Board | |
| Charts:- Daily , Weekly | |
| Add PMVP to Watchlist: View: Get Complete PMVP Trend Analysis ➞ | |
 | RFL Rafael Holdings, Inc. |
| Sector: Health Care | |
| SubSector: Biotechnology | |
| MarketCap: 203.685 Millions | |
| Recent Price: 1.72 Market Intelligence Score: 40 | |
| Day Percent Change: 0.58% Day Change: 0.01 | |
| Week Change: -2.27% Year-to-date Change: -6.0% | |
| RFL Links: Profile News Message Board | |
| Charts:- Daily , Weekly | |
| Add RFL to Watchlist: View: Get Complete RFL Trend Analysis ➞ | |
 | MOR MorphoSys AG |
| Sector: Health Care | |
| SubSector: Biotechnology | |
| MarketCap: 2636.85 Millions | |
| Recent Price: 18.14 Market Intelligence Score: 63 | |
| Day Percent Change: 0.50% Day Change: 0.09 | |
| Week Change: 1% Year-to-date Change: 83.2% | |
| MOR Links: Profile News Message Board | |
| Charts:- Daily , Weekly | |
| Add MOR to Watchlist: View: Get Complete MOR Trend Analysis ➞ | |
 | BIIB Biogen Inc. |
| Sector: Health Care | |
| SubSector: Biotechnology | |
| MarketCap: 53102.6 Millions | |
| Recent Price: 202.97 Market Intelligence Score: 57 | |
| Day Percent Change: 0.49% Day Change: 0.98 | |
| Week Change: 4.42% Year-to-date Change: -21.6% | |
| BIIB Links: Profile News Message Board | |
| Charts:- Daily , Weekly | |
| Add BIIB to Watchlist: View: Get Complete BIIB Trend Analysis ➞ | |
 | ALLK Allakos Inc. |
| Sector: Health Care | |
| SubSector: Biotechnology | |
| MarketCap: 3233.55 Millions | |
| Recent Price: 1.02 Market Intelligence Score: 20 | |
| Day Percent Change: 0.49% Day Change: 0.00 | |
| Week Change: -3.76% Year-to-date Change: -62.5% | |
| ALLK Links: Profile News Message Board | |
| Charts:- Daily , Weekly | |
| Add ALLK to Watchlist: View: Get Complete ALLK Trend Analysis ➞ | |
 | ARGX argenx SE |
| Sector: Health Care | |
| SubSector: Biotechnology | |
| MarketCap: 5077.05 Millions | |
| Recent Price: 376.57 Market Intelligence Score: 20 | |
| Day Percent Change: 0.42% Day Change: 1.57 | |
| Week Change: 4.57% Year-to-date Change: -1.0% | |
| ARGX Links: Profile News Message Board | |
| Charts:- Daily , Weekly | |
| Add ARGX to Watchlist: View: Get Complete ARGX Trend Analysis ➞ | |
 | ALNY Alnylam Pharmaceuticals, Inc. |
| Sector: Health Care | |
| SubSector: Biotechnology | |
| MarketCap: 12793.2 Millions | |
| Recent Price: 144.40 Market Intelligence Score: 18 | |
| Day Percent Change: 0.41% Day Change: 0.59 | |
| Week Change: -0.01% Year-to-date Change: -24.6% | |
| ALNY Links: Profile News Message Board | |
| Charts:- Daily , Weekly | |
| Add ALNY to Watchlist: View: Get Complete ALNY Trend Analysis ➞ | |
 | IKNA Ikena Oncology, Inc. |
| Sector: Health Care | |
| SubSector: Biotechnology | |
| MarketCap: 277 Millions | |
| Recent Price: 1.31 Market Intelligence Score: 34 | |
| Day Percent Change: 0.38% Day Change: 0.00 | |
| Week Change: -1.13% Year-to-date Change: -34.3% | |
| IKNA Links: Profile News Message Board | |
| Charts:- Daily , Weekly | |
| Add IKNA to Watchlist: View: Get Complete IKNA Trend Analysis ➞ | |
 | RGNX REGENXBIO Inc. |
| Sector: Health Care | |
| SubSector: Biotechnology | |
| MarketCap: 1232.85 Millions | |
| Recent Price: 16.10 Market Intelligence Score: 36 | |
| Day Percent Change: 0.37% Day Change: 0.06 | |
| Week Change: 2.61% Year-to-date Change: -10.3% | |
| RGNX Links: Profile News Message Board | |
| Charts:- Daily , Weekly | |
| Add RGNX to Watchlist: View: Get Complete RGNX Trend Analysis ➞ | |
 | SPRO Spero Therapeutics, Inc. |
| Sector: Health Care | |
| SubSector: Biotechnology | |
| MarketCap: 121.085 Millions | |
| Recent Price: 1.43 Market Intelligence Score: 15 | |
| Day Percent Change: 0.35% Day Change: 0.01 | |
| Week Change: 1.06% Year-to-date Change: -3.1% | |
| SPRO Links: Profile News Message Board | |
| Charts:- Daily , Weekly | |
| Add SPRO to Watchlist: View: Get Complete SPRO Trend Analysis ➞ | |
 | CGEM Cullinan Oncology, Inc. |
| Sector: Health Care | |
| SubSector: Biotechnology | |
| MarketCap: 433 Millions | |
| Recent Price: 18.97 Market Intelligence Score: 93 | |
| Day Percent Change: 0.34% Day Change: 0.07 | |
| Week Change: 21.1% Year-to-date Change: 86.0% | |
| CGEM Links: Profile News Message Board | |
| Charts:- Daily , Weekly | |
| Add CGEM to Watchlist: View: Get Complete CGEM Trend Analysis ➞ | |
 | CERE Cerevel Therapeutics Holdings, Inc. |
| Sector: Health Care | |
| SubSector: Biotechnology | |
| MarketCap: 21587 Millions | |
| Recent Price: 42.00 Market Intelligence Score: 40 | |
| Day Percent Change: 0.31% Day Change: 0.13 | |
| Week Change: -0.37% Year-to-date Change: -0.9% | |
| CERE Links: Profile News Message Board | |
| Charts:- Daily , Weekly | |
| Add CERE to Watchlist: View: Get Complete CERE Trend Analysis ➞ | |
 | RPHM Reneo Pharmaceuticals, Inc. |
| Sector: Health Care | |
| SubSector: Biotechnology | |
| MarketCap: 233 Millions | |
| Recent Price: 1.68 Market Intelligence Score: 43 | |
| Day Percent Change: 0.30% Day Change: 0.00 | |
| Week Change: -3.45% Year-to-date Change: 3.7% | |
| RPHM Links: Profile News Message Board | |
| Charts:- Daily , Weekly | |
| Add RPHM to Watchlist: View: Get Complete RPHM Trend Analysis ➞ | |
 | ROIV Roivant Sciences Ltd. |
| Sector: Health Care | |
| SubSector: Biotechnology | |
| MarketCap: 7780 Millions | |
| Recent Price: 10.85 Market Intelligence Score: 41 | |
| Day Percent Change: 0.23% Day Change: 0.03 | |
| Week Change: 3.68% Year-to-date Change: -2.3% | |
| ROIV Links: Profile News Message Board | |
| Charts:- Daily , Weekly | |
| Add ROIV to Watchlist: View: Get Complete ROIV Trend Analysis ➞ | |
 | VXRT Vaxart, Inc. |
| Sector: Health Care | |
| SubSector: Biotechnology | |
| MarketCap: 129.785 Millions | |
| Recent Price: 0.71 Market Intelligence Score: 10 | |
| Day Percent Change: 0.21% Day Change: 0.00 | |
| Week Change: -7.06% Year-to-date Change: 24.2% | |
| VXRT Links: Profile News Message Board | |
| Charts:- Daily , Weekly | |
| Add VXRT to Watchlist: View: Get Complete VXRT Trend Analysis ➞ | |
 | OMER Omeros Corporation |
| Sector: Health Care | |
| SubSector: Biotechnology | |
| MarketCap: 759.585 Millions | |
| Recent Price: 3.04 Market Intelligence Score: 8 | |
| Day Percent Change: 0.16% Day Change: 0.00 | |
| Week Change: -0.16% Year-to-date Change: -6.9% | |
| OMER Links: Profile News Message Board | |
| Charts:- Daily , Weekly | |
| Add OMER to Watchlist: View: Get Complete OMER Trend Analysis ➞ | |
 | MNPR Monopar Therapeutics Inc. |
| Sector: Health Care | |
| SubSector: Biotechnology | |
| MarketCap: 71487 Millions | |
| Recent Price: 0.63 Market Intelligence Score: 83 | |
| Day Percent Change: 0.16% Day Change: 0.00 | |
| Week Change: -0.79% Year-to-date Change: 83.4% | |
| MNPR Links: Profile News Message Board | |
| Charts:- Daily , Weekly | |
| Add MNPR to Watchlist: View: Get Complete MNPR Trend Analysis ➞ | |
 | ACRV Acrivon Therapeutics, Inc. |
| Sector: Health Care | |
| SubSector: Biotechnology | |
| MarketCap: 286 Millions | |
| Recent Price: 9.47 Market Intelligence Score: 78 | |
| Day Percent Change: 0.11% Day Change: 0.01 | |
| Week Change: 0.85% Year-to-date Change: 90.5% | |
| ACRV Links: Profile News Message Board | |
| Charts:- Daily , Weekly | |
| Add ACRV to Watchlist: View: Get Complete ACRV Trend Analysis ➞ | |
 | FUSN Fusion Pharmaceuticals Inc. |
| Sector: Health Care | |
| SubSector: Biotechnology | |
| MarketCap: 52487 Millions | |
| Recent Price: 21.42 Market Intelligence Score: 83 | |
| Day Percent Change: 0.09% Day Change: 0.02 | |
| Week Change: 0.94% Year-to-date Change: 123.1% | |
| FUSN Links: Profile News Message Board | |
| Charts:- Daily , Weekly | |
| Add FUSN to Watchlist: View: Get Complete FUSN Trend Analysis ➞ | |
 | SGMO Sangamo Therapeutics, Inc. |
| Sector: Health Care | |
| SubSector: Biotechnology | |
| MarketCap: 779.285 Millions | |
| Recent Price: 0.49 Market Intelligence Score: 44 | |
| Day Percent Change: 0.06% Day Change: 0.00 | |
| Week Change: -3.56% Year-to-date Change: -9.2% | |
| SGMO Links: Profile News Message Board | |
| Charts:- Daily , Weekly | |
| Add SGMO to Watchlist: View: Get Complete SGMO Trend Analysis ➞ | |
| To view more stocks, click on Next / Previous arrows or select different range: 0 - 25 , 25 - 50 , 50 - 75 , 75 - 100 , 100 - 125 , 125 - 150 , 150 - 175 , 175 - 200 , 200 - 225 , 225 - 250 , 250 - 275 , 275 - 300 , 300 - 325 , 325 - 350 , 350 - 375 , 375 - 400 | ||
| Click To Change The Sort Order: By Market Cap or Company Size Performance: Year-to-date, Week and Day | |
| Select Chart Type: | ||
|
Best Stocks Today 12Stocks.com |
© 2024 12Stocks.com Terms & Conditions Privacy Contact Us
All Information Provided Only For Education And Not To Be Used For Investing or Trading. See Terms & Conditions


One More Thing ... Get Best Stocks Delivered Daily!
Never Ever Miss A Move With Our Top Ten Stocks Lists
Find Best Stocks In Any Market - Bull or Bear Market
Take A Peek At Our Top Ten Stocks Lists: Daily, Weekly, Year-to-Date & Top Trends
Find Best Stocks In Any Market - Bull or Bear Market
Take A Peek At Our Top Ten Stocks Lists: Daily, Weekly, Year-to-Date & Top Trends
Biotech Stocks With Best Up Trends [0-bearish to 100-bullish]: Annovis Bio[100], Agios [100], Agenus [95], Mesoblast [95], Avadel [93], Cullinan Oncology[93], Pieris [93], NewAmsterdam Pharma[93], PureTech Health[93], Exelixis [90], ALX Oncology[88]
Best Biotech Stocks Year-to-Date:
Pieris [6273.63%], Precision [2590.41%], Inovio [1864.71%], Assembly [1543.7%], NuCana [1198.17%], Adverum nologies[1152.66%], Agenus [882.61%], Affimed N.V[671.2%], Mesoblast [464.55%], Corbus [456.13%], Janux [333.88%] Best Biotech Stocks This Week:
Pieris [7900%], Agenus [53.2%], BeyondSpring [35%], Seres [33.67%], Annovis Bio[30%], ProKidney [27.45%], Cullinan Oncology[21.1%], Mesoblast [19.19%], CASI [16%], BeiGene [15.37%], Prelude [13.45%] Best Biotech Stocks Daily:
ADiTx [10.57%], Agenus [9.64%], Structure [7.74%], Merus N.V[7.33%], CASI [6.97%], Zura Bio[6.75%], Galectin [6.08%], Galera [4.98%], Sana nology[3.69%], BeiGene [3.68%], Prelude [3.58%]