
 Login Sign Up


| |||||
 |  | ||||

| 12Stocks.com Market Intelligence |
Best Biotech Stocks
|
|
| Quick Read: Best Biotech Stocks List By Performances & Trends: Daily, Weekly, Year-to-Date, Market Cap (Size) & Technical Trends | |||
| Best Biotech Stocks Views: Quick Browse View, Summary & Slide Show View | |||
| 12Stocks.com Biotech Stocks Performances & Trends Daily | |||||||||
|
|  The overall market intelligence score is 10 (0-bearish to 100-bullish) which puts Biotech sector in short term bearish trend. The market intelligence score from previous trading session is 0 and an improvement of trend continues.
| ||||||||
Here are the market intelligence trend scores of the most requested Biotech stocks at 12Stocks.com (click stock name for detailed review):
|


| 12Stocks.com: Investing in Biotech sector with Stocks | |
|
The following table helps investors and traders sort through current performance and trends (as measured by market intelligence score) of various
stocks in the Biotech sector. Quick View: Move mouse or cursor over stock symbol (ticker) to view short-term Technical chart and over stock name to view long term chart. Click on  to add stock symbol to your watchlist and to add stock symbol to your watchlist and  to view watchlist. Click on any ticker or stock name for detailed market intelligence report for that stock. to view watchlist. Click on any ticker or stock name for detailed market intelligence report for that stock. |
12Stocks.com Performance of Stocks in Biotech Sector
| Ticker | Stock Name | Watchlist | Category | Recent Price | Market Intelligence Score | Change % | YTD Change% |
| GBIO | Generation Bio |   | Biotechnology | 2.81 | 53 | 1.44 | 70.30% |
| OCS | Oculis Holding | | Biotechnology | 11.95 | 45 | 1.44 | 7.65% |
| VRTX | Vertex | | Biotechnology | 399.92 | 49 | 1.43 | -1.71% |
| MIRM | Mirum | | Biotechnology | 24.17 | 42 | 1.43 | -18.12% |
| ROIV | Roivant | | Biotechnology | 10.61 | 58 | 1.43 | -4.46% |
| ASND | Ascendis Pharma | | Biotechnology | 142.10 | 49 | 1.38 | 12.82% |
| ALEC | Alector | | Biotechnology | 5.17 | 32 | 1.37 | -35.21% |
| BNTX | BioNTech SE | | Biotechnology | 88.01 | 52 | 1.37 | -16.61% |
| CMPX | Compass | | Biotechnology | 1.49 | 46 | 1.36 | -2.93% |
| BBIO | BridgeBio Pharma | | Biotechnology | 25.07 | 35 | 1.33 | -37.90% |
| TBPH | Theravance Biopharma | | Biotechnology | 9.46 | 60 | 1.28 | -15.84% |
| ACRV | Acrivon | | Biotechnology | 9.51 | 56 | 1.28 | 91.35% |
| NBIX | Neurocrine | | Biotechnology | 133.66 | 25 | 1.26 | 1.44% |
| PRQR | ProQR | | Biotechnology | 2.02 | 39 | 1.26 | 1.77% |
| NTLA | Intellia | | Biotechnology | 21.83 | 42 | 1.21 | -28.40% |
| AUPH | Aurinia | | Biotechnology | 5.05 | 42 | 1.20 | -43.83% |
| SRPT | Sarepta | | Biotechnology | 116.96 | 22 | 1.16 | 21.29% |
| AMGN | Amgen | | Biotechnology | 271.91 | 57 | 1.11 | -5.59% |
| CRSP | CRISPR | | Biotechnology | 55.66 | 18 | 1.11 | -11.09% |
| AUTL | Autolus | | Biotechnology | 4.56 | 17 | 1.11 | -29.19% |
| BGNE | BeiGene | | Biotechnology | 130.94 | 25 | 1.10 | -27.40% |
| TECH | Bio-Techne | | Biotechnology | 62.80 | 35 | 1.09 | -18.61% |
| GERN | Geron | | Biotechnology | 3.73 | 83 | 1.08 | 76.78% |
| SRRK | Scholar Rock | | Biotechnology | 14.00 | 62 | 1.08 | -25.53% |
| CRNX | Crinetics | | Biotechnology | 43.44 | 48 | 1.07 | 22.09% |
| To view more stocks, click on Next / Previous arrows or select different range: 0 - 25 , 25 - 50 , 50 - 75 , 75 - 100 , 100 - 125 , 125 - 150 , 150 - 175 , 175 - 200 , 200 - 225 , 225 - 250 , 250 - 275 , 275 - 300 , 300 - 325 , 325 - 350 , 350 - 375 , 375 - 400 | ||
 | Click To Change The Sort Order: By Market Cap or Company Size Performance: Year-to-date, Week and Day |  |
|
Get the most comprehensive stock market coverage daily at 12Stocks.com ➞ Best Stocks Today ➞ Best Stocks Weekly ➞ Best Stocks Year-to-Date ➞ Best Stocks Trends ➞  Best Stocks Today 12Stocks.com Best Nasdaq Stocks ➞ Best S&P 500 Stocks ➞ Best Tech Stocks ➞ Best Biotech Stocks ➞ |
| Detailed Overview of Biotech Stocks |
| Biotech Technical Overview, Leaders & Laggards, Top Biotech ETF Funds & Detailed Biotech Stocks List, Charts, Trends & More |
| Biotech Sector: Technical Analysis, Trends & YTD Performance | |
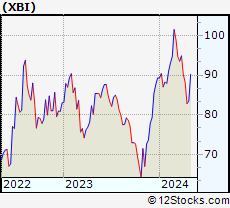
| Biotech sector, as represented by XBI, an exchange-traded fund [ETF] that holds basket of Biotech stocks (e.g, Amgen, Celgene) is down by -7.26% and is currently underperforming the overall market by -11.65% year-to-date. Below is a quick view of Technical charts and trends: | |
 XBI Weekly Chart |
|
| Long Term Trend: Not Good | |
| Medium Term Trend: Not Good | |
 XBI Daily Chart |
|
| Short Term Trend: Deteriorating | |
| Overall Trend Score: 10 | |
| YTD Performance: -7.26% | |
| **Trend Scores & Views Are Only For Educational Purposes And Not For Investing | |
| 12Stocks.com: Top Performing Biotech Sector Stocks | ||||||||||||||||||||||||||||||||||||||||||||||||
 The top performing Biotech sector stocks year to date are
Now, more recently, over last week, the top performing Biotech sector stocks on the move are


|
||||||||||||||||||||||||||||||||||||||||||||||||
| 12Stocks.com: Investing in Biotech Sector using Exchange Traded Funds | |
|
The following table shows list of key exchange traded funds (ETF) that
help investors track Biotech Index. For detailed view, check out our ETF Funds section of our website. Quick View: Move mouse or cursor over ETF symbol (ticker) to view short-term Technical chart and over ETF name to view long term chart. Click on ticker or stock name for detailed view. Click on to add stock symbol to your watchlist and to view watchlist. |
12Stocks.com List of ETFs that track Biotech Index
| Ticker | ETF Name | Watchlist | Recent Price | Market Intelligence Score | Change % | Week % | Year-to-date % |
| LABD | Biotech Bear 3X | | 10.75 | 95 | -0.46 | -0.46 | 10.94% |
| XBI | Biotech | | 82.81 | 10 | -0.03 | -0.03 | -7.26% |
| IBB | Biotechnology | | 126.11 | 25 | 1.11 | 1.11 | -7.17% |
| LABU | Biotech Bull 3X | | 86.43 | 10 | 0.44 | 0.44 | -29.14% |
| IHF | Healthcare Providers | | 52.08 | 70 | -0.26 | -0.26 | -0.83% |
| IYH | Healthcare | | 58.43 | 38 | 0.46 | 0.46 | 2.06% |
| IXJ | Global Healthcare | | 88.41 | 52 | 0.75 | 0.75 | 1.95% |
| CURE | Healthcare Bull 3X | | 104.45 | 32 | 1.08 | 1.08 | 2.66% |
| FBT | First NYSE | | 142.93 | 25 | 0.88 | 0.88 | -9.57% |
| BIB | Biotechnology | | 49.10 | 25 | 1.87 | 1.87 | -13.94% |
| PTH | DWA Healthcare Momentum | | 39.34 | 20 | -0.48 | -0.48 | 0.51% |
| PBE | Biotech & Genome | | 60.64 | 25 | 1.32 | 1.32 | -7.9% |
| BIS | Short Biotech | | 20.47 | 76 | -2.03 | -2.03 | 13.28% |
| BBH | Biotech | | 154.56 | 32 | 1.44 | 1.44 | -6.5% |
| BBC | Bio Biotechnology Clinical | | 24.86 | 10 | 0.61 | 0.61 | 1.67% |
| BTEC | Principal Healthcare Innovators | | 33.76 | 10 | -0.30 | -0.3 | -7.07% |
| BBP | Bio Biotechnology Products | | 51.43 | 17 | 1.98 | 1.98 | -11.47% |
| 12Stocks.com: Charts, Trends, Fundamental Data and Performances of Biotech Stocks | |
|
We now take in-depth look at all Biotech stocks including charts, multi-period performances and overall trends (as measured by market intelligence score). One can sort Biotech stocks (click link to choose) by Daily, Weekly and by Year-to-Date performances. Also, one can sort by size of the company or by market capitalization. |
| Select Your Default Chart Type: | |||||
| |||||
| Click on stock symbol or name for detailed view. Click on to add stock symbol to your watchlist and to view watchlist. Quick View: Move mouse or cursor over "Daily" to quickly view daily Technical stock chart and over "Weekly" to view weekly Technical stock chart. | |||||

 | GBIO Generation Bio Co. |
| Sector: Health Care | |
| SubSector: Biotechnology | |
| MarketCap: 17487 Millions | |
| Recent Price: 2.81 Market Intelligence Score: 53 | |
| Day Percent Change: 1.44% Day Change: 0.04 | |
| Week Change: 1.44% Year-to-date Change: 70.3% | |
| GBIO Links: Profile News Message Board | |
| Charts:- Daily , Weekly | |
| Add GBIO to Watchlist: View: Get Complete GBIO Trend Analysis ➞ | |
 | OCS Oculis Holding AG |
| Sector: Health Care | |
| SubSector: Biotechnology | |
| MarketCap: 460 Millions | |
| Recent Price: 11.95 Market Intelligence Score: 45 | |
| Day Percent Change: 1.44% Day Change: 0.17 | |
| Week Change: 1.44% Year-to-date Change: 7.7% | |
| OCS Links: Profile News Message Board | |
| Charts:- Daily , Weekly | |
| Add OCS to Watchlist: View: Get Complete OCS Trend Analysis ➞ | |
 | VRTX Vertex Pharmaceuticals Incorporated |
| Sector: Health Care | |
| SubSector: Biotechnology | |
| MarketCap: 57669.6 Millions | |
| Recent Price: 399.92 Market Intelligence Score: 49 | |
| Day Percent Change: 1.43% Day Change: 5.64 | |
| Week Change: 1.43% Year-to-date Change: -1.7% | |
| VRTX Links: Profile News Message Board | |
| Charts:- Daily , Weekly | |
| Add VRTX to Watchlist: View: Get Complete VRTX Trend Analysis ➞ | |
 | MIRM Mirum Pharmaceuticals, Inc. |
| Sector: Health Care | |
| SubSector: Biotechnology | |
| MarketCap: 309.585 Millions | |
| Recent Price: 24.17 Market Intelligence Score: 42 | |
| Day Percent Change: 1.43% Day Change: 0.34 | |
| Week Change: 1.43% Year-to-date Change: -18.1% | |
| MIRM Links: Profile News Message Board | |
| Charts:- Daily , Weekly | |
| Add MIRM to Watchlist: View: Get Complete MIRM Trend Analysis ➞ | |
 | ROIV Roivant Sciences Ltd. |
| Sector: Health Care | |
| SubSector: Biotechnology | |
| MarketCap: 7780 Millions | |
| Recent Price: 10.61 Market Intelligence Score: 58 | |
| Day Percent Change: 1.43% Day Change: 0.15 | |
| Week Change: 1.43% Year-to-date Change: -4.5% | |
| ROIV Links: Profile News Message Board | |
| Charts:- Daily , Weekly | |
| Add ROIV to Watchlist: View: Get Complete ROIV Trend Analysis ➞ | |
 | ASND Ascendis Pharma A/S |
| Sector: Health Care | |
| SubSector: Biotechnology | |
| MarketCap: 5470.35 Millions | |
| Recent Price: 142.10 Market Intelligence Score: 49 | |
| Day Percent Change: 1.38% Day Change: 1.93 | |
| Week Change: 1.38% Year-to-date Change: 12.8% | |
| ASND Links: Profile News Message Board | |
| Charts:- Daily , Weekly | |
| Add ASND to Watchlist: View: Get Complete ASND Trend Analysis ➞ | |
 | ALEC Alector, Inc. |
| Sector: Health Care | |
| SubSector: Biotechnology | |
| MarketCap: 2719.35 Millions | |
| Recent Price: 5.17 Market Intelligence Score: 32 | |
| Day Percent Change: 1.37% Day Change: 0.07 | |
| Week Change: 1.37% Year-to-date Change: -35.2% | |
| ALEC Links: Profile News Message Board | |
| Charts:- Daily , Weekly | |
| Add ALEC to Watchlist: View: Get Complete ALEC Trend Analysis ➞ | |
 | BNTX BioNTech SE |
| Sector: Health Care | |
| SubSector: Biotechnology | |
| MarketCap: 11933.7 Millions | |
| Recent Price: 88.01 Market Intelligence Score: 52 | |
| Day Percent Change: 1.37% Day Change: 1.19 | |
| Week Change: 1.37% Year-to-date Change: -16.6% | |
| BNTX Links: Profile News Message Board | |
| Charts:- Daily , Weekly | |
| Add BNTX to Watchlist: View: Get Complete BNTX Trend Analysis ➞ | |
 | CMPX Compass Therapeutics, Inc. |
| Sector: Health Care | |
| SubSector: Biotechnology | |
| MarketCap: 406 Millions | |
| Recent Price: 1.49 Market Intelligence Score: 46 | |
| Day Percent Change: 1.36% Day Change: 0.02 | |
| Week Change: 1.36% Year-to-date Change: -2.9% | |
| CMPX Links: Profile News Message Board | |
| Charts:- Daily , Weekly | |
| Add CMPX to Watchlist: View: Get Complete CMPX Trend Analysis ➞ | |
 | BBIO BridgeBio Pharma, Inc. |
| Sector: Health Care | |
| SubSector: Biotechnology | |
| MarketCap: 3879.35 Millions | |
| Recent Price: 25.07 Market Intelligence Score: 35 | |
| Day Percent Change: 1.33% Day Change: 0.33 | |
| Week Change: 1.33% Year-to-date Change: -37.9% | |
| BBIO Links: Profile News Message Board | |
| Charts:- Daily , Weekly | |
| Add BBIO to Watchlist: View: Get Complete BBIO Trend Analysis ➞ | |
 | TBPH Theravance Biopharma, Inc. |
| Sector: Health Care | |
| SubSector: Biotechnology | |
| MarketCap: 1404.55 Millions | |
| Recent Price: 9.46 Market Intelligence Score: 60 | |
| Day Percent Change: 1.28% Day Change: 0.12 | |
| Week Change: 1.28% Year-to-date Change: -15.8% | |
| TBPH Links: Profile News Message Board | |
| Charts:- Daily , Weekly | |
| Add TBPH to Watchlist: View: Get Complete TBPH Trend Analysis ➞ | |
 | ACRV Acrivon Therapeutics, Inc. |
| Sector: Health Care | |
| SubSector: Biotechnology | |
| MarketCap: 286 Millions | |
| Recent Price: 9.51 Market Intelligence Score: 56 | |
| Day Percent Change: 1.28% Day Change: 0.12 | |
| Week Change: 1.28% Year-to-date Change: 91.4% | |
| ACRV Links: Profile News Message Board | |
| Charts:- Daily , Weekly | |
| Add ACRV to Watchlist: View: Get Complete ACRV Trend Analysis ➞ | |
 | NBIX Neurocrine Biosciences, Inc. |
| Sector: Health Care | |
| SubSector: Biotechnology | |
| MarketCap: 7897.85 Millions | |
| Recent Price: 133.66 Market Intelligence Score: 25 | |
| Day Percent Change: 1.26% Day Change: 1.66 | |
| Week Change: 1.26% Year-to-date Change: 1.4% | |
| NBIX Links: Profile News Message Board | |
| Charts:- Daily , Weekly | |
| Add NBIX to Watchlist: View: Get Complete NBIX Trend Analysis ➞ | |
 | PRQR ProQR Therapeutics N.V. |
| Sector: Health Care | |
| SubSector: Biotechnology | |
| MarketCap: 324.385 Millions | |
| Recent Price: 2.02 Market Intelligence Score: 39 | |
| Day Percent Change: 1.26% Day Change: 0.03 | |
| Week Change: 1.26% Year-to-date Change: 1.8% | |
| PRQR Links: Profile News Message Board | |
| Charts:- Daily , Weekly | |
| Add PRQR to Watchlist: View: Get Complete PRQR Trend Analysis ➞ | |
 | NTLA Intellia Therapeutics, Inc. |
| Sector: Health Care | |
| SubSector: Biotechnology | |
| MarketCap: 707.185 Millions | |
| Recent Price: 21.83 Market Intelligence Score: 42 | |
| Day Percent Change: 1.21% Day Change: 0.26 | |
| Week Change: 1.21% Year-to-date Change: -28.4% | |
| NTLA Links: Profile News Message Board | |
| Charts:- Daily , Weekly | |
| Add NTLA to Watchlist: View: Get Complete NTLA Trend Analysis ➞ | |
 | AUPH Aurinia Pharmaceuticals Inc. |
| Sector: Health Care | |
| SubSector: Biotechnology | |
| MarketCap: 1319.75 Millions | |
| Recent Price: 5.05 Market Intelligence Score: 42 | |
| Day Percent Change: 1.20% Day Change: 0.06 | |
| Week Change: 1.2% Year-to-date Change: -43.8% | |
| AUPH Links: Profile News Message Board | |
| Charts:- Daily , Weekly | |
| Add AUPH to Watchlist: View: Get Complete AUPH Trend Analysis ➞ | |
 | SRPT Sarepta Therapeutics, Inc. |
| Sector: Health Care | |
| SubSector: Biotechnology | |
| MarketCap: 7388.05 Millions | |
| Recent Price: 116.96 Market Intelligence Score: 22 | |
| Day Percent Change: 1.16% Day Change: 1.34 | |
| Week Change: 1.16% Year-to-date Change: 21.3% | |
| SRPT Links: Profile News Message Board | |
| Charts:- Daily , Weekly | |
| Add SRPT to Watchlist: View: Get Complete SRPT Trend Analysis ➞ | |
 | AMGN Amgen Inc. |
| Sector: Health Care | |
| SubSector: Biotechnology | |
| MarketCap: 121030 Millions | |
| Recent Price: 271.91 Market Intelligence Score: 57 | |
| Day Percent Change: 1.11% Day Change: 2.98 | |
| Week Change: 1.11% Year-to-date Change: -5.6% | |
| AMGN Links: Profile News Message Board | |
| Charts:- Daily , Weekly | |
| Add AMGN to Watchlist: View: Get Complete AMGN Trend Analysis ➞ | |
 | CRSP CRISPR Therapeutics AG |
| Sector: Health Care | |
| SubSector: Biotechnology | |
| MarketCap: 2691.35 Millions | |
| Recent Price: 55.66 Market Intelligence Score: 18 | |
| Day Percent Change: 1.11% Day Change: 0.61 | |
| Week Change: 1.11% Year-to-date Change: -11.1% | |
| CRSP Links: Profile News Message Board | |
| Charts:- Daily , Weekly | |
| Add CRSP to Watchlist: View: Get Complete CRSP Trend Analysis ➞ | |
 | AUTL Autolus Therapeutics plc |
| Sector: Health Care | |
| SubSector: Biotechnology | |
| MarketCap: 296.285 Millions | |
| Recent Price: 4.56 Market Intelligence Score: 17 | |
| Day Percent Change: 1.11% Day Change: 0.05 | |
| Week Change: 1.11% Year-to-date Change: -29.2% | |
| AUTL Links: Profile News Message Board | |
| Charts:- Daily , Weekly | |
| Add AUTL to Watchlist: View: Get Complete AUTL Trend Analysis ➞ | |
 | BGNE BeiGene, Ltd. |
| Sector: Health Care | |
| SubSector: Biotechnology | |
| MarketCap: 10838.5 Millions | |
| Recent Price: 130.94 Market Intelligence Score: 25 | |
| Day Percent Change: 1.10% Day Change: 1.42 | |
| Week Change: 1.1% Year-to-date Change: -27.4% | |
| BGNE Links: Profile News Message Board | |
| Charts:- Daily , Weekly | |
| Add BGNE to Watchlist: View: Get Complete BGNE Trend Analysis ➞ | |
 | TECH Bio-Techne Corporation |
| Sector: Health Care | |
| SubSector: Biotechnology | |
| MarketCap: 6958.05 Millions | |
| Recent Price: 62.80 Market Intelligence Score: 35 | |
| Day Percent Change: 1.09% Day Change: 0.68 | |
| Week Change: 1.09% Year-to-date Change: -18.6% | |
| TECH Links: Profile News Message Board | |
| Charts:- Daily , Weekly | |
| Add TECH to Watchlist: View: Get Complete TECH Trend Analysis ➞ | |
 | GERN Geron Corporation |
| Sector: Health Care | |
| SubSector: Biotechnology | |
| MarketCap: 228.685 Millions | |
| Recent Price: 3.73 Market Intelligence Score: 83 | |
| Day Percent Change: 1.08% Day Change: 0.04 | |
| Week Change: 1.08% Year-to-date Change: 76.8% | |
| GERN Links: Profile News Message Board | |
| Charts:- Daily , Weekly | |
| Add GERN to Watchlist: View: Get Complete GERN Trend Analysis ➞ | |
 | SRRK Scholar Rock Holding Corporation |
| Sector: Health Care | |
| SubSector: Biotechnology | |
| MarketCap: 441.385 Millions | |
| Recent Price: 14.00 Market Intelligence Score: 62 | |
| Day Percent Change: 1.08% Day Change: 0.15 | |
| Week Change: 1.08% Year-to-date Change: -25.5% | |
| SRRK Links: Profile News Message Board | |
| Charts:- Daily , Weekly | |
| Add SRRK to Watchlist: View: Get Complete SRRK Trend Analysis ➞ | |
 | CRNX Crinetics Pharmaceuticals, Inc. |
| Sector: Health Care | |
| SubSector: Biotechnology | |
| MarketCap: 381.085 Millions | |
| Recent Price: 43.44 Market Intelligence Score: 48 | |
| Day Percent Change: 1.07% Day Change: 0.46 | |
| Week Change: 1.07% Year-to-date Change: 22.1% | |
| CRNX Links: Profile News Message Board | |
| Charts:- Daily , Weekly | |
| Add CRNX to Watchlist: View: Get Complete CRNX Trend Analysis ➞ | |
| To view more stocks, click on Next / Previous arrows or select different range: 0 - 25 , 25 - 50 , 50 - 75 , 75 - 100 , 100 - 125 , 125 - 150 , 150 - 175 , 175 - 200 , 200 - 225 , 225 - 250 , 250 - 275 , 275 - 300 , 300 - 325 , 325 - 350 , 350 - 375 , 375 - 400 | ||
| Click To Change The Sort Order: By Market Cap or Company Size Performance: Year-to-date, Week and Day | |
| Select Chart Type: | ||
|
Best Stocks Today 12Stocks.com |
© 2024 12Stocks.com Terms & Conditions Privacy Contact Us
All Information Provided Only For Education And Not To Be Used For Investing or Trading. See Terms & Conditions


One More Thing ... Get Best Stocks Delivered Daily!
Never Ever Miss A Move With Our Top Ten Stocks Lists
Find Best Stocks In Any Market - Bull or Bear Market
Take A Peek At Our Top Ten Stocks Lists: Daily, Weekly, Year-to-Date & Top Trends
Find Best Stocks In Any Market - Bull or Bear Market
Take A Peek At Our Top Ten Stocks Lists: Daily, Weekly, Year-to-Date & Top Trends
Biotech Stocks With Best Up Trends [0-bearish to 100-bullish]: Annovis Bio[93], Agios [90], Anika [90], GH Research[88], Day One[86], Agenus [83], Moderna [83], Geron [83], XOMA [83], Humacyte [81], NuCana [81]
Best Biotech Stocks Year-to-Date:
Precision [2552.05%], Inovio [1864.71%], Assembly [1512%], Adverum nologies[1406.38%], NuCana [1231.98%], Affimed N.V[700%], Agenus [596.94%], Corbus [524.17%], Mesoblast [402.73%], Janux [354.91%], Viking [237.13%] Best Biotech Stocks This Week:
ProKidney [33.33%], BeyondSpring [17.22%], Molecular Partners[16.87%], ArTara [16.41%], Annovis Bio[14.9%], Seres [11.56%], Cara [10.5%], Syros [9.91%], Nektar [9.68%], Pharvaris N.V[8.92%], Agenus [8.66%] Best Biotech Stocks Daily:
ProKidney [33.33%], BeyondSpring [17.22%], Molecular Partners[16.87%], ArTara [16.41%], Annovis Bio[14.90%], Seres [11.56%], Cara [10.50%], Syros [9.91%], Nektar [9.68%], Pharvaris N.V[8.92%], Agenus [8.66%]