
 Login Sign Up


| |||||
 |  | ||||

| 12Stocks.com Market Intelligence |
Best Biotech Stocks
|
|
| Quick Read: Best Biotech Stocks List By Performances & Trends: Daily, Weekly, Year-to-Date, Market Cap (Size) & Technical Trends | |||
| Best Biotech Stocks Views: Quick Browse View, Summary & Slide Show View | |||
| 12Stocks.com Biotech Stocks Performances & Trends Daily | |||||||||
|
|  The overall market intelligence score is 25 (0-bearish to 100-bullish) which puts Biotech sector in short term bearish to neutral trend. The market intelligence score from previous trading session is 32 and hence a deterioration of trend.
| ||||||||
Here are the market intelligence trend scores of the most requested Biotech stocks at 12Stocks.com (click stock name for detailed review):
|


| 12Stocks.com: Investing in Biotech sector with Stocks | |
|
The following table helps investors and traders sort through current performance and trends (as measured by market intelligence score) of various
stocks in the Biotech sector. Quick View: Move mouse or cursor over stock symbol (ticker) to view short-term Technical chart and over stock name to view long term chart. Click on  to add stock symbol to your watchlist and to add stock symbol to your watchlist and  to view watchlist. Click on any ticker or stock name for detailed market intelligence report for that stock. to view watchlist. Click on any ticker or stock name for detailed market intelligence report for that stock. |
12Stocks.com Performance of Stocks in Biotech Sector
| Ticker | Stock Name | Watchlist | Category | Recent Price | Market Intelligence Score | Change % | YTD Change% |
| MLTX | MoonLake Immuno |   | Biotechnology | 42.81 | 42 | -0.99 | -31.81% |
| PIRS | Pieris | | Biotechnology | 11.88 | 100 | -1.00 | NA |
| VRTX | Vertex | | Biotechnology | 400.76 | 42 | -1.02 | -1.51% |
| PCVX | Vaxcyte | | Biotechnology | 60.25 | 25 | -1.03 | -4.01% |
| ALVR | AlloVir | | Biotechnology | 0.78 | 95 | -1.05 | 15.14% |
| SPRO | Spero | | Biotechnology | 1.42 | 15 | -1.05 | -3.40% |
| VYGR | Voyager | | Biotechnology | 7.57 | 51 | -1.05 | -10.31% |
| ROIV | Roivant | | Biotechnology | 10.82 | 61 | -1.05 | -2.57% |
| ANIP | ANI | | Biotechnology | 65.43 | 44 | -1.07 | 18.66% |
| OBIO | Orchestra BioMed | | Biotechnology | 4.49 | 20 | -1.10 | -50.71% |
| VIR | Vir nology | | Biotechnology | 8.04 | 20 | -1.11 | -20.08% |
| NUVB | Nuvation Bio | | Biotechnology | 2.65 | 68 | -1.12 | 74.92% |
| TNYA | Tenaya | | Biotechnology | 4.40 | 51 | -1.12 | 38.36% |
| PTN | Palatin Technologies | | Biotechnology | 1.73 | 10 | -1.14 | -56.53% |
| SIGA | SIGA Technologies | | Biotechnology | 8.66 | 68 | -1.14 | 54.64% |
| ASND | Ascendis Pharma | | Biotechnology | 143.18 | 56 | -1.14 | 13.68% |
| AUPH | Aurinia | | Biotechnology | 5.03 | 32 | -1.18 | -44.05% |
| PROK | ProKidney | | Biotechnology | 2.52 | 76 | -1.18 | 44.13% |
| CERS | Cerus | | Biotechnology | 1.66 | 28 | -1.19 | -23.15% |
| OABI | OmniAb | | Biotechnology | 4.59 | 10 | -1.19 | -24.34% |
| ITCI | Intra-Cellular Therapies | | Biotechnology | 73.12 | 83 | -1.20 | 2.09% |
| ADMA | ADMA Biologics | | Biotechnology | 6.46 | 90 | -1.22 | 42.92% |
| JAZZ | Jazz | | Biotechnology | 108.32 | 10 | -1.23 | -11.93% |
| RAPT | RAPT | | Biotechnology | 7.90 | 10 | -1.25 | -68.21% |
| IOVA | Iovance Bio | | Biotechnology | 11.71 | 41 | -1.26 | 44.03% |
| To view more stocks, click on Next / Previous arrows or select different range: 0 - 25 , 25 - 50 , 50 - 75 , 75 - 100 , 100 - 125 , 125 - 150 , 150 - 175 , 175 - 200 , 200 - 225 , 225 - 250 , 250 - 275 , 275 - 300 , 300 - 325 , 325 - 350 , 350 - 375 , 375 - 400 | ||
 | Click To Change The Sort Order: By Market Cap or Company Size Performance: Year-to-date, Week and Day |  |
|
Get the most comprehensive stock market coverage daily at 12Stocks.com ➞ Best Stocks Today ➞ Best Stocks Weekly ➞ Best Stocks Year-to-Date ➞ Best Stocks Trends ➞  Best Stocks Today 12Stocks.com Best Nasdaq Stocks ➞ Best S&P 500 Stocks ➞ Best Tech Stocks ➞ Best Biotech Stocks ➞ |
| Detailed Overview of Biotech Stocks |
| Biotech Technical Overview, Leaders & Laggards, Top Biotech ETF Funds & Detailed Biotech Stocks List, Charts, Trends & More |
| Biotech Sector: Technical Analysis, Trends & YTD Performance | |
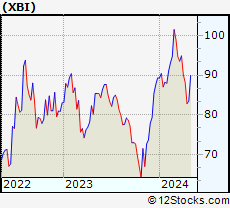
| Biotech sector, as represented by XBI, an exchange-traded fund [ETF] that holds basket of Biotech stocks (e.g, Amgen, Celgene) is down by -5.99% and is currently underperforming the overall market by -11.65% year-to-date. Below is a quick view of Technical charts and trends: | |
 XBI Weekly Chart |
|
| Long Term Trend: Not Good | |
| Medium Term Trend: Not Good | |
 XBI Daily Chart |
|
| Short Term Trend: Very Good | |
| Overall Trend Score: 25 | |
| YTD Performance: -5.99% | |
| **Trend Scores & Views Are Only For Educational Purposes And Not For Investing | |
| 12Stocks.com: Top Performing Biotech Sector Stocks | ||||||||||||||||||||||||||||||||||||||||||||||||
 The top performing Biotech sector stocks year to date are
Now, more recently, over last week, the top performing Biotech sector stocks on the move are


|
||||||||||||||||||||||||||||||||||||||||||||||||
| 12Stocks.com: Investing in Biotech Sector using Exchange Traded Funds | |
|
The following table shows list of key exchange traded funds (ETF) that
help investors track Biotech Index. For detailed view, check out our ETF Funds section of our website. Quick View: Move mouse or cursor over ETF symbol (ticker) to view short-term Technical chart and over ETF name to view long term chart. Click on ticker or stock name for detailed view. Click on to add stock symbol to your watchlist and to view watchlist. |
12Stocks.com List of ETFs that track Biotech Index
| Ticker | ETF Name | Watchlist | Recent Price | Market Intelligence Score | Change % | Week % | Year-to-date % |
| LABD | Biotech Bear 3X | | 10.37 | 62 | 2.98 | -3.98 | 7.02% |
| XBI | Biotech | | 83.94 | 25 | -0.89 | 1.34 | -5.99% |
| LABU | Biotech Bull 3X | | 89.40 | 25 | -2.80 | 3.89 | -26.7% |
| IBB | Biotechnology | | 127.76 | 32 | -0.20 | 2.44 | -5.96% |
| IYH | Healthcare | | 59.09 | 30 | -0.20 | 1.6 | 3.22% |
| IXJ | Global Healthcare | | 89.31 | 45 | -0.35 | 1.78 | 2.99% |
| IHF | Healthcare Providers | | 52.26 | 48 | -0.11 | 0.1 | -0.48% |
| CURE | Healthcare Bull 3X | | 107.85 | 32 | -0.25 | 4.37 | 6.01% |
| FBT | First NYSE | | 145.40 | 18 | 0.05 | 2.62 | -8.01% |
| BIB | Biotechnology | | 50.18 | 32 | -0.30 | 4.11 | -12.04% |
| BIS | Short Biotech | | 20.09 | 61 | 0.75 | -3.85 | 11.18% |
| BBH | Biotech | | 157.33 | 49 | 0.03 | 3.26 | -4.83% |
| PBE | Biotech & Genome | | 60.88 | 17 | -0.43 | 1.72 | -7.53% |
| PTH | DWA Healthcare Momentum | | 39.63 | 46 | -1.34 | 0.25 | 1.25% |
| BTEC | Principal Healthcare Innovators | | 34.20 | 18 | -1.73 | 1.02 | -5.85% |
| BBP | Bio Biotechnology Products | | 52.40 | 20 | 0.02 | 3.91 | -9.8% |
| BBC | Bio Biotechnology Clinical | | 25.63 | 36 | -0.17 | 3.71 | 4.81% |
| 12Stocks.com: Charts, Trends, Fundamental Data and Performances of Biotech Stocks | |
|
We now take in-depth look at all Biotech stocks including charts, multi-period performances and overall trends (as measured by market intelligence score). One can sort Biotech stocks (click link to choose) by Daily, Weekly and by Year-to-Date performances. Also, one can sort by size of the company or by market capitalization. |
| Select Your Default Chart Type: | |||||
| |||||
| Click on stock symbol or name for detailed view. Click on to add stock symbol to your watchlist and to view watchlist. Quick View: Move mouse or cursor over "Daily" to quickly view daily Technical stock chart and over "Weekly" to view weekly Technical stock chart. | |||||

 | MLTX MoonLake Immunotherapeutics |
| Sector: Health Care | |
| SubSector: Biotechnology | |
| MarketCap: 2670 Millions | |
| Recent Price: 42.81 Market Intelligence Score: 42 | |
| Day Percent Change: -0.99% Day Change: -0.43 | |
| Week Change: 1.47% Year-to-date Change: -31.8% | |
| MLTX Links: Profile News Message Board | |
| Charts:- Daily , Weekly | |
| Add MLTX to Watchlist: View: Get Complete MLTX Trend Analysis ➞ | |
 | PIRS Pieris Pharmaceuticals, Inc. |
| Sector: Health Care | |
| SubSector: Biotechnology | |
| MarketCap: 150.785 Millions | |
| Recent Price: 11.88 Market Intelligence Score: 100 | |
| Day Percent Change: -1.00% Day Change: -0.12 | |
| Week Change: 8093.1% Year-to-date Change: 6,427.5% | |
| PIRS Links: Profile News Message Board | |
| Charts:- Daily , Weekly | |
| Add PIRS to Watchlist: View: Get Complete PIRS Trend Analysis ➞ | |
 | VRTX Vertex Pharmaceuticals Incorporated |
| Sector: Health Care | |
| SubSector: Biotechnology | |
| MarketCap: 57669.6 Millions | |
| Recent Price: 400.76 Market Intelligence Score: 42 | |
| Day Percent Change: -1.02% Day Change: -4.15 | |
| Week Change: 1.64% Year-to-date Change: -1.5% | |
| VRTX Links: Profile News Message Board | |
| Charts:- Daily , Weekly | |
| Add VRTX to Watchlist: View: Get Complete VRTX Trend Analysis ➞ | |
 | PCVX Vaxcyte, Inc. |
| Sector: Health Care | |
| SubSector: Biotechnology | |
| MarketCap: 13887 Millions | |
| Recent Price: 60.25 Market Intelligence Score: 25 | |
| Day Percent Change: -1.03% Day Change: -0.63 | |
| Week Change: -0.76% Year-to-date Change: -4.0% | |
| PCVX Links: Profile News Message Board | |
| Charts:- Daily , Weekly | |
| Add PCVX to Watchlist: View: Get Complete PCVX Trend Analysis ➞ | |
 | ALVR AlloVir, Inc. |
| Sector: Health Care | |
| SubSector: Biotechnology | |
| MarketCap: 25787 Millions | |
| Recent Price: 0.78 Market Intelligence Score: 95 | |
| Day Percent Change: -1.05% Day Change: -0.01 | |
| Week Change: 4.11% Year-to-date Change: 15.1% | |
| ALVR Links: Profile News Message Board | |
| Charts:- Daily , Weekly | |
| Add ALVR to Watchlist: View: Get Complete ALVR Trend Analysis ➞ | |
 | SPRO Spero Therapeutics, Inc. |
| Sector: Health Care | |
| SubSector: Biotechnology | |
| MarketCap: 121.085 Millions | |
| Recent Price: 1.42 Market Intelligence Score: 15 | |
| Day Percent Change: -1.05% Day Change: -0.02 | |
| Week Change: 0.71% Year-to-date Change: -3.4% | |
| SPRO Links: Profile News Message Board | |
| Charts:- Daily , Weekly | |
| Add SPRO to Watchlist: View: Get Complete SPRO Trend Analysis ➞ | |
 | VYGR Voyager Therapeutics, Inc. |
| Sector: Health Care | |
| SubSector: Biotechnology | |
| MarketCap: 321.085 Millions | |
| Recent Price: 7.57 Market Intelligence Score: 51 | |
| Day Percent Change: -1.05% Day Change: -0.08 | |
| Week Change: 0.93% Year-to-date Change: -10.3% | |
| VYGR Links: Profile News Message Board | |
| Charts:- Daily , Weekly | |
| Add VYGR to Watchlist: View: Get Complete VYGR Trend Analysis ➞ | |
 | ROIV Roivant Sciences Ltd. |
| Sector: Health Care | |
| SubSector: Biotechnology | |
| MarketCap: 7780 Millions | |
| Recent Price: 10.82 Market Intelligence Score: 61 | |
| Day Percent Change: -1.05% Day Change: -0.12 | |
| Week Change: 3.44% Year-to-date Change: -2.6% | |
| ROIV Links: Profile News Message Board | |
| Charts:- Daily , Weekly | |
| Add ROIV to Watchlist: View: Get Complete ROIV Trend Analysis ➞ | |
 | ANIP ANI Pharmaceuticals, Inc. |
| Sector: Health Care | |
| SubSector: Biotechnology | |
| MarketCap: 489.285 Millions | |
| Recent Price: 65.43 Market Intelligence Score: 44 | |
| Day Percent Change: -1.07% Day Change: -0.71 | |
| Week Change: -0.08% Year-to-date Change: 18.7% | |
| ANIP Links: Profile News Message Board | |
| Charts:- Daily , Weekly | |
| Add ANIP to Watchlist: View: Get Complete ANIP Trend Analysis ➞ | |
 | OBIO Orchestra BioMed Holdings, Inc. |
| Sector: Health Care | |
| SubSector: Biotechnology | |
| MarketCap: 271 Millions | |
| Recent Price: 4.49 Market Intelligence Score: 20 | |
| Day Percent Change: -1.10% Day Change: -0.05 | |
| Week Change: -3.23% Year-to-date Change: -50.7% | |
| OBIO Links: Profile News Message Board | |
| Charts:- Daily , Weekly | |
| Add OBIO to Watchlist: View: Get Complete OBIO Trend Analysis ➞ | |
 | VIR Vir Biotechnology, Inc. |
| Sector: Health Care | |
| SubSector: Biotechnology | |
| MarketCap: 3916.75 Millions | |
| Recent Price: 8.04 Market Intelligence Score: 20 | |
| Day Percent Change: -1.11% Day Change: -0.09 | |
| Week Change: 1.01% Year-to-date Change: -20.1% | |
| VIR Links: Profile News Message Board | |
| Charts:- Daily , Weekly | |
| Add VIR to Watchlist: View: Get Complete VIR Trend Analysis ➞ | |
 | NUVB Nuvation Bio Inc. |
| Sector: Health Care | |
| SubSector: Biotechnology | |
| MarketCap: 381 Millions | |
| Recent Price: 2.65 Market Intelligence Score: 68 | |
| Day Percent Change: -1.12% Day Change: -0.03 | |
| Week Change: 1.92% Year-to-date Change: 74.9% | |
| NUVB Links: Profile News Message Board | |
| Charts:- Daily , Weekly | |
| Add NUVB to Watchlist: View: Get Complete NUVB Trend Analysis ➞ | |
 | TNYA Tenaya Therapeutics, Inc. |
| Sector: Health Care | |
| SubSector: Biotechnology | |
| MarketCap: 395 Millions | |
| Recent Price: 4.40 Market Intelligence Score: 51 | |
| Day Percent Change: -1.12% Day Change: -0.05 | |
| Week Change: 1.85% Year-to-date Change: 38.4% | |
| TNYA Links: Profile News Message Board | |
| Charts:- Daily , Weekly | |
| Add TNYA to Watchlist: View: Get Complete TNYA Trend Analysis ➞ | |
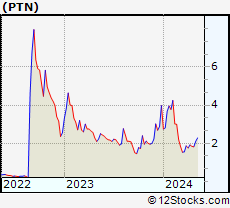 | PTN Palatin Technologies, Inc. |
| Sector: Health Care | |
| SubSector: Biotechnology | |
| MarketCap: 109.285 Millions | |
| Recent Price: 1.73 Market Intelligence Score: 10 | |
| Day Percent Change: -1.14% Day Change: -0.02 | |
| Week Change: -5.98% Year-to-date Change: -56.5% | |
| PTN Links: Profile News Message Board | |
| Charts:- Daily , Weekly | |
| Add PTN to Watchlist: View: Get Complete PTN Trend Analysis ➞ | |
 | SIGA SIGA Technologies, Inc. |
| Sector: Health Care | |
| SubSector: Biotechnology | |
| MarketCap: 424.285 Millions | |
| Recent Price: 8.66 Market Intelligence Score: 68 | |
| Day Percent Change: -1.14% Day Change: -0.10 | |
| Week Change: 3.84% Year-to-date Change: 54.6% | |
| SIGA Links: Profile News Message Board | |
| Charts:- Daily , Weekly | |
| Add SIGA to Watchlist: View: Get Complete SIGA Trend Analysis ➞ | |
 | ASND Ascendis Pharma A/S |
| Sector: Health Care | |
| SubSector: Biotechnology | |
| MarketCap: 5470.35 Millions | |
| Recent Price: 143.18 Market Intelligence Score: 56 | |
| Day Percent Change: -1.14% Day Change: -1.65 | |
| Week Change: 2.15% Year-to-date Change: 13.7% | |
| ASND Links: Profile News Message Board | |
| Charts:- Daily , Weekly | |
| Add ASND to Watchlist: View: Get Complete ASND Trend Analysis ➞ | |
 | AUPH Aurinia Pharmaceuticals Inc. |
| Sector: Health Care | |
| SubSector: Biotechnology | |
| MarketCap: 1319.75 Millions | |
| Recent Price: 5.03 Market Intelligence Score: 32 | |
| Day Percent Change: -1.18% Day Change: -0.06 | |
| Week Change: 0.8% Year-to-date Change: -44.1% | |
| AUPH Links: Profile News Message Board | |
| Charts:- Daily , Weekly | |
| Add AUPH to Watchlist: View: Get Complete AUPH Trend Analysis ➞ | |
 | PROK ProKidney Corp. |
| Sector: Health Care | |
| SubSector: Biotechnology | |
| MarketCap: 2470 Millions | |
| Recent Price: 2.52 Market Intelligence Score: 76 | |
| Day Percent Change: -1.18% Day Change: -0.03 | |
| Week Change: 23.28% Year-to-date Change: 44.1% | |
| PROK Links: Profile News Message Board | |
| Charts:- Daily , Weekly | |
| Add PROK to Watchlist: View: Get Complete PROK Trend Analysis ➞ | |
 | CERS Cerus Corporation |
| Sector: Health Care | |
| SubSector: Biotechnology | |
| MarketCap: 607.185 Millions | |
| Recent Price: 1.66 Market Intelligence Score: 28 | |
| Day Percent Change: -1.19% Day Change: -0.02 | |
| Week Change: -1.19% Year-to-date Change: -23.2% | |
| CERS Links: Profile News Message Board | |
| Charts:- Daily , Weekly | |
| Add CERS to Watchlist: View: Get Complete CERS Trend Analysis ➞ | |
 | OABI OmniAb, Inc. |
| Sector: Health Care | |
| SubSector: Biotechnology | |
| MarketCap: 570 Millions | |
| Recent Price: 4.59 Market Intelligence Score: 10 | |
| Day Percent Change: -1.19% Day Change: -0.05 | |
| Week Change: -1.82% Year-to-date Change: -24.3% | |
| OABI Links: Profile News Message Board | |
| Charts:- Daily , Weekly | |
| Add OABI to Watchlist: View: Get Complete OABI Trend Analysis ➞ | |
 | ITCI Intra-Cellular Therapies, Inc. |
| Sector: Health Care | |
| SubSector: Biotechnology | |
| MarketCap: 991.885 Millions | |
| Recent Price: 73.12 Market Intelligence Score: 83 | |
| Day Percent Change: -1.20% Day Change: -0.89 | |
| Week Change: 1.04% Year-to-date Change: 2.1% | |
| ITCI Links: Profile News Message Board | |
| Charts:- Daily , Weekly | |
| Add ITCI to Watchlist: View: Get Complete ITCI Trend Analysis ➞ | |
 | ADMA ADMA Biologics, Inc. |
| Sector: Health Care | |
| SubSector: Biotechnology | |
| MarketCap: 204.985 Millions | |
| Recent Price: 6.46 Market Intelligence Score: 90 | |
| Day Percent Change: -1.22% Day Change: -0.08 | |
| Week Change: 3.03% Year-to-date Change: 42.9% | |
| ADMA Links: Profile News Message Board | |
| Charts:- Daily , Weekly | |
| Add ADMA to Watchlist: View: Get Complete ADMA Trend Analysis ➞ | |
 | JAZZ Jazz Pharmaceuticals plc |
| Sector: Health Care | |
| SubSector: Biotechnology | |
| MarketCap: 5576.05 Millions | |
| Recent Price: 108.32 Market Intelligence Score: 10 | |
| Day Percent Change: -1.23% Day Change: -1.35 | |
| Week Change: -1.47% Year-to-date Change: -11.9% | |
| JAZZ Links: Profile News Message Board | |
| Charts:- Daily , Weekly | |
| Add JAZZ to Watchlist: View: Get Complete JAZZ Trend Analysis ➞ | |
 | RAPT RAPT Therapeutics, Inc. |
| Sector: Health Care | |
| SubSector: Biotechnology | |
| MarketCap: 368.785 Millions | |
| Recent Price: 7.90 Market Intelligence Score: 10 | |
| Day Percent Change: -1.25% Day Change: -0.10 | |
| Week Change: -0.75% Year-to-date Change: -68.2% | |
| RAPT Links: Profile News Message Board | |
| Charts:- Daily , Weekly | |
| Add RAPT to Watchlist: View: Get Complete RAPT Trend Analysis ➞ | |
 | IOVA Iovance Biotherapeutics, Inc. |
| Sector: Health Care | |
| SubSector: Biotechnology | |
| MarketCap: 3533.35 Millions | |
| Recent Price: 11.71 Market Intelligence Score: 41 | |
| Day Percent Change: -1.26% Day Change: -0.15 | |
| Week Change: 3.45% Year-to-date Change: 44.0% | |
| IOVA Links: Profile News Message Board | |
| Charts:- Daily , Weekly | |
| Add IOVA to Watchlist: View: Get Complete IOVA Trend Analysis ➞ | |
| To view more stocks, click on Next / Previous arrows or select different range: 0 - 25 , 25 - 50 , 50 - 75 , 75 - 100 , 100 - 125 , 125 - 150 , 150 - 175 , 175 - 200 , 200 - 225 , 225 - 250 , 250 - 275 , 275 - 300 , 300 - 325 , 325 - 350 , 350 - 375 , 375 - 400 | ||
| Click To Change The Sort Order: By Market Cap or Company Size Performance: Year-to-date, Week and Day | |
| Select Chart Type: | ||
|
Best Stocks Today 12Stocks.com |
© 2024 12Stocks.com Terms & Conditions Privacy Contact Us
All Information Provided Only For Education And Not To Be Used For Investing or Trading. See Terms & Conditions


One More Thing ... Get Best Stocks Delivered Daily!
Never Ever Miss A Move With Our Top Ten Stocks Lists
Find Best Stocks In Any Market - Bull or Bear Market
Take A Peek At Our Top Ten Stocks Lists: Daily, Weekly, Year-to-Date & Top Trends
Find Best Stocks In Any Market - Bull or Bear Market
Take A Peek At Our Top Ten Stocks Lists: Daily, Weekly, Year-to-Date & Top Trends
Biotech Stocks With Best Up Trends [0-bearish to 100-bullish]: Annovis Bio[100], PureTech Health[100], Agios [100], Pieris [100], Avadel [100], Agenus [95], Mesoblast [95], Exelixis [95], Blueprint Medicines[95], BioMarin [95], AlloVir [95]
Best Biotech Stocks Year-to-Date:
Pieris [6427.47%], Precision [2590.41%], Inovio [1892.16%], Assembly [1543.7%], Adverum nologies[1253.61%], NuCana [1198.17%], Agenus [796.24%], Affimed N.V[680.8%], Corbus [488.41%], Mesoblast [465.45%], Janux [352.07%] Best Biotech Stocks This Week:
Pieris [8093.1%], Agenus [39.74%], BeyondSpring [35%], Seres [30.29%], Annovis Bio[27.4%], ProKidney [23.28%], Cullinan Oncology[20.69%], Mesoblast [19.39%], Molecular Partners[16.87%], HOOKIPA Pharma[16.17%], Longboard [13.3%] Best Biotech Stocks Daily:
Agenus [14.86%], Cullinan Oncology[13.55%], HOOKIPA Pharma[11.11%], Gritstone Oncology[10.06%], Sage [8.11%], Relay [7.46%], Annovis Bio[7.24%], BeyondSpring [6.11%], Sarepta [6.09%], Molecular Templates[5.81%], Vigil Neuroscience[5.66%]