
 Login Sign Up


| |||||
 |  | ||||

| 12Stocks.com Market Intelligence |
Best Biotech Stocks
|
|
| Quick Read: Best Biotech Stocks List By Performances & Trends: Daily, Weekly, Year-to-Date, Market Cap (Size) & Technical Trends | |||
| Best Biotech Stocks Views: Quick Browse View, Summary & Slide Show View | |||
| 12Stocks.com Biotech Stocks Performances & Trends Daily | |||||||||
|
|  The overall market intelligence score is 50 (0-bearish to 100-bullish) which puts Biotech sector in short term neutral trend. The market intelligence score from previous trading session is 49 and hence an improvement of trend.
| ||||||||
Here are the market intelligence trend scores of the most requested Biotech stocks at 12Stocks.com (click stock name for detailed review):
|


| 12Stocks.com: Investing in Biotech sector with Stocks | |
|
The following table helps investors and traders sort through current performance and trends (as measured by market intelligence score) of various
stocks in the Biotech sector. Quick View: Move mouse or cursor over stock symbol (ticker) to view short-term Technical chart and over stock name to view long term chart. Click on  to add stock symbol to your watchlist and to add stock symbol to your watchlist and  to view watchlist. Click on any ticker or stock name for detailed market intelligence report for that stock. to view watchlist. Click on any ticker or stock name for detailed market intelligence report for that stock. |
12Stocks.com Performance of Stocks in Biotech Sector
| Ticker | Stock Name | Watchlist | Category | Recent Price | Market Intelligence Score | Change % | YTD Change% |
| GLTO | Galecto |   | Biotechnology | 0.68 | 25 | 0.00 | -5.54% |
| KNSA | Kiniksa | | Biotechnology | 19.39 | 64 | -0.05 | 10.55% |
| CERE | Cerevel | | Biotechnology | 42.59 | 76 | -0.09 | 0.47% |
| MGTX | MeiraGTx | | Biotechnology | 4.99 | 32 | -0.10 | -28.99% |
| FENC | Fennec | | Biotechnology | 9.08 | 10 | -0.11 | -19.07% |
| PTGX | Protagonist | | Biotechnology | 25.53 | 25 | -0.12 | 11.34% |
| SLRN | Acelyrin | | Biotechnology | 4.25 | 28 | -0.12 | -42.40% |
| FOLD | Amicus | | Biotechnology | 10.41 | 42 | -0.19 | -26.64% |
| RARE | Ultragenyx | | Biotechnology | 43.21 | 25 | -0.21 | -9.64% |
| LYEL | Lyell Immunopharma | | Biotechnology | 2.33 | 30 | -0.21 | 18.32% |
| BLTE | Belite Bio | | Biotechnology | 40.48 | 44 | -0.22 | -11.13% |
| JANX | Janux | | Biotechnology | 58.04 | 93 | -0.26 | 440.16% |
| GILD | Gilead | | Biotechnology | 65.33 | 27 | -0.27 | -19.36% |
| ARVN | Arvinas | | Biotechnology | 32.39 | 0 | -0.28 | -21.31% |
| IMAB | I Mab | | Biotechnology | 1.76 | 15 | -0.28 | -7.37% |
| GRTS | Gritstone Oncology | | Biotechnology | 0.87 | 64 | -0.29 | -57.29% |
| EXAI | Exscientia | | Biotechnology | 5.12 | 57 | -0.29 | -20.94% |
| SRPT | Sarepta | | Biotechnology | 130.50 | 100 | -0.31 | 35.33% |
| CNTA | Centessa | | Biotechnology | 9.44 | 25 | -0.32 | 16.83% |
| XBIT | X | | Biotechnology | 8.13 | 75 | -0.37 | 103.25% |
| ABUS | Arbutus Biopharma | | Biotechnology | 2.68 | 17 | -0.37 | 7.20% |
| PBYI | Puma nology | | Biotechnology | 4.93 | 10 | -0.40 | 13.86% |
| IGMS | IGM | | Biotechnology | 9.44 | 42 | -0.42 | 13.60% |
| SLN | Silence | | Biotechnology | 21.31 | 0 | -0.42 | 21.39% |
| KPTI | Karyopharm | | Biotechnology | 1.08 | 27 | -0.46 | 24.28% |
| To view more stocks, click on Next / Previous arrows or select different range: 0 - 25 , 25 - 50 , 50 - 75 , 75 - 100 , 100 - 125 , 125 - 150 , 150 - 175 , 175 - 200 , 200 - 225 , 225 - 250 , 250 - 275 , 275 - 300 , 300 - 325 , 325 - 350 , 350 - 375 , 375 - 400 | ||
 | Click To Change The Sort Order: By Market Cap or Company Size Performance: Year-to-date, Week and Day |  |
|
Get the most comprehensive stock market coverage daily at 12Stocks.com ➞ Best Stocks Today ➞ Best Stocks Weekly ➞ Best Stocks Year-to-Date ➞ Best Stocks Trends ➞  Best Stocks Today 12Stocks.com Best Nasdaq Stocks ➞ Best S&P 500 Stocks ➞ Best Tech Stocks ➞ Best Biotech Stocks ➞ |
| Detailed Overview of Biotech Stocks |
| Biotech Technical Overview, Leaders & Laggards, Top Biotech ETF Funds & Detailed Biotech Stocks List, Charts, Trends & More |
| Biotech Sector: Technical Analysis, Trends & YTD Performance | |
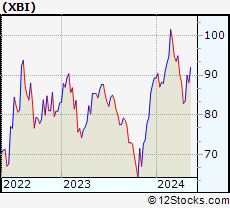
| Biotech sector, as represented by XBI, an exchange-traded fund [ETF] that holds basket of Biotech stocks (e.g, Amgen, Celgene) is down by -1.06% and is currently underperforming the overall market by -6.68% year-to-date. Below is a quick view of Technical charts and trends: | |
 XBI Weekly Chart |
|
| Long Term Trend: Not Good | |
| Medium Term Trend: Deteriorating | |
 XBI Daily Chart |
|
| Short Term Trend: Very Good | |
| Overall Trend Score: 50 | |
| YTD Performance: -1.06% | |
| **Trend Scores & Views Are Only For Educational Purposes And Not For Investing | |
| 12Stocks.com: Top Performing Biotech Sector Stocks | ||||||||||||||||||||||||||||||||||||||||||||||||
 The top performing Biotech sector stocks year to date are
Now, more recently, over last week, the top performing Biotech sector stocks on the move are


|
||||||||||||||||||||||||||||||||||||||||||||||||
| 12Stocks.com: Investing in Biotech Sector using Exchange Traded Funds | |
|
The following table shows list of key exchange traded funds (ETF) that
help investors track Biotech Index. For detailed view, check out our ETF Funds section of our website. Quick View: Move mouse or cursor over ETF symbol (ticker) to view short-term Technical chart and over ETF name to view long term chart. Click on ticker or stock name for detailed view. Click on to add stock symbol to your watchlist and to view watchlist. |
12Stocks.com List of ETFs that track Biotech Index
| Ticker | ETF Name | Watchlist | Recent Price | Market Intelligence Score | Change % | Week % | Year-to-date % |
| XBI | Biotech | | 88.34 | 50 | 1.16 | 5.81 | -1.06% |
| LABD | Biotech Bear 3X | | 8.76 | 44 | -2.99 | -16.73 | -9.6% |
| IBB | Biotechnology | | 130.64 | 64 | 0.89 | 3.28 | -3.84% |
| LABU | Biotech Bull 3X | | 102.99 | 42 | 3.19 | 17.69 | -15.56% |
| IYH | Healthcare | | 59.12 | 37 | -0.10 | 0.87 | 3.27% |
| IHF | Healthcare Providers | | 51.64 | 15 | 0.39 | -0.54 | -1.66% |
| IXJ | Global Healthcare | | 89.41 | 37 | -0.17 | 0.33 | 3.1% |
| CURE | Healthcare Bull 3X | | 105.11 | 40 | -1.36 | -0.19 | 3.31% |
| FBT | First NYSE | | 147.18 | 22 | 0.79 | 2.46 | -6.88% |
| BIB | Biotechnology | | 52.58 | 57 | 0.00 | 5.88 | -7.84% |
| PBE | Biotech & Genome | | 63.57 | 44 | 1.13 | 5.28 | -3.45% |
| PTH | DWA Healthcare Momentum | | 41.27 | 22 | 0.00 | 3.46 | 5.44% |
| BBH | Biotech | | 160.51 | 64 | 1.18 | 3.12 | -2.9% |
| BIS | Short Biotech | | 18.61 | 36 | -2.62 | -7.96 | 2.99% |
| BBC | Bio Biotechnology Clinical | | 27.15 | 42 | 0.20 | 6.35 | 11.03% |
| BTEC | Principal Healthcare Innovators | | 35.90 | 42 | 0.00 | 4.81 | -1.19% |
| BBP | Bio Biotechnology Products | | 54.35 | 45 | 0.00 | 5.56 | -6.45% |
| 12Stocks.com: Charts, Trends, Fundamental Data and Performances of Biotech Stocks | |
|
We now take in-depth look at all Biotech stocks including charts, multi-period performances and overall trends (as measured by market intelligence score). One can sort Biotech stocks (click link to choose) by Daily, Weekly and by Year-to-Date performances. Also, one can sort by size of the company or by market capitalization. |
| Select Your Default Chart Type: | |||||
| |||||
| Click on stock symbol or name for detailed view. Click on to add stock symbol to your watchlist and to view watchlist. Quick View: Move mouse or cursor over "Daily" to quickly view daily Technical stock chart and over "Weekly" to view weekly Technical stock chart. | |||||

 | GLTO Galecto, Inc. |
| Sector: Health Care | |
| SubSector: Biotechnology | |
| MarketCap: 34487 Millions | |
| Recent Price: 0.68 Market Intelligence Score: 25 | |
| Day Percent Change: 0.00% Day Change: 0.00 | |
| Week Change: -3.5% Year-to-date Change: -5.5% | |
| GLTO Links: Profile News Message Board | |
| Charts:- Daily , Weekly | |
| Add GLTO to Watchlist: View: Get Complete GLTO Trend Analysis ➞ | |
 | KNSA Kiniksa Pharmaceuticals, Ltd. |
| Sector: Health Care | |
| SubSector: Biotechnology | |
| MarketCap: 780.285 Millions | |
| Recent Price: 19.39 Market Intelligence Score: 64 | |
| Day Percent Change: -0.05% Day Change: -0.01 | |
| Week Change: 8.45% Year-to-date Change: 10.6% | |
| KNSA Links: Profile News Message Board | |
| Charts:- Daily , Weekly | |
| Add KNSA to Watchlist: View: Get Complete KNSA Trend Analysis ➞ | |
 | CERE Cerevel Therapeutics Holdings, Inc. |
| Sector: Health Care | |
| SubSector: Biotechnology | |
| MarketCap: 21587 Millions | |
| Recent Price: 42.59 Market Intelligence Score: 76 | |
| Day Percent Change: -0.09% Day Change: -0.04 | |
| Week Change: 0.28% Year-to-date Change: 0.5% | |
| CERE Links: Profile News Message Board | |
| Charts:- Daily , Weekly | |
| Add CERE to Watchlist: View: Get Complete CERE Trend Analysis ➞ | |
 | MGTX MeiraGTx Holdings plc |
| Sector: Health Care | |
| SubSector: Biotechnology | |
| MarketCap: 402.885 Millions | |
| Recent Price: 4.99 Market Intelligence Score: 32 | |
| Day Percent Change: -0.10% Day Change: 0.00 | |
| Week Change: 3.85% Year-to-date Change: -29.0% | |
| MGTX Links: Profile News Message Board | |
| Charts:- Daily , Weekly | |
| Add MGTX to Watchlist: View: Get Complete MGTX Trend Analysis ➞ | |
 | FENC Fennec Pharmaceuticals Inc. |
| Sector: Health Care | |
| SubSector: Biotechnology | |
| MarketCap: 126.785 Millions | |
| Recent Price: 9.08 Market Intelligence Score: 10 | |
| Day Percent Change: -0.11% Day Change: -0.01 | |
| Week Change: -1.41% Year-to-date Change: -19.1% | |
| FENC Links: Profile News Message Board | |
| Charts:- Daily , Weekly | |
| Add FENC to Watchlist: View: Get Complete FENC Trend Analysis ➞ | |
 | PTGX Protagonist Therapeutics, Inc. |
| Sector: Health Care | |
| SubSector: Biotechnology | |
| MarketCap: 165.285 Millions | |
| Recent Price: 25.53 Market Intelligence Score: 25 | |
| Day Percent Change: -0.12% Day Change: -0.03 | |
| Week Change: 1.51% Year-to-date Change: 11.3% | |
| PTGX Links: Profile News Message Board | |
| Charts:- Daily , Weekly | |
| Add PTGX to Watchlist: View: Get Complete PTGX Trend Analysis ➞ | |
 | SLRN Acelyrin, Inc. |
| Sector: Health Care | |
| SubSector: Biotechnology | |
| MarketCap: 2030 Millions | |
| Recent Price: 4.25 Market Intelligence Score: 28 | |
| Day Percent Change: -0.12% Day Change: 0.00 | |
| Week Change: 0.12% Year-to-date Change: -42.4% | |
| SLRN Links: Profile News Message Board | |
| Charts:- Daily , Weekly | |
| Add SLRN to Watchlist: View: Get Complete SLRN Trend Analysis ➞ | |
 | FOLD Amicus Therapeutics, Inc. |
| Sector: Health Care | |
| SubSector: Biotechnology | |
| MarketCap: 2676.75 Millions | |
| Recent Price: 10.41 Market Intelligence Score: 42 | |
| Day Percent Change: -0.19% Day Change: -0.02 | |
| Week Change: 1.26% Year-to-date Change: -26.6% | |
| FOLD Links: Profile News Message Board | |
| Charts:- Daily , Weekly | |
| Add FOLD to Watchlist: View: Get Complete FOLD Trend Analysis ➞ | |
 | RARE Ultragenyx Pharmaceutical Inc. |
| Sector: Health Care | |
| SubSector: Biotechnology | |
| MarketCap: 2373.35 Millions | |
| Recent Price: 43.21 Market Intelligence Score: 25 | |
| Day Percent Change: -0.21% Day Change: -0.09 | |
| Week Change: -2.33% Year-to-date Change: -9.6% | |
| RARE Links: Profile News Message Board | |
| Charts:- Daily , Weekly | |
| Add RARE to Watchlist: View: Get Complete RARE Trend Analysis ➞ | |
 | LYEL Lyell Immunopharma, Inc. |
| Sector: Health Care | |
| SubSector: Biotechnology | |
| MarketCap: 809 Millions | |
| Recent Price: 2.33 Market Intelligence Score: 30 | |
| Day Percent Change: -0.21% Day Change: 0.00 | |
| Week Change: 7.39% Year-to-date Change: 18.3% | |
| LYEL Links: Profile News Message Board | |
| Charts:- Daily , Weekly | |
| Add LYEL to Watchlist: View: Get Complete LYEL Trend Analysis ➞ | |
 | BLTE Belite Bio, Inc |
| Sector: Health Care | |
| SubSector: Biotechnology | |
| MarketCap: 404 Millions | |
| Recent Price: 40.48 Market Intelligence Score: 44 | |
| Day Percent Change: -0.22% Day Change: -0.09 | |
| Week Change: 1.84% Year-to-date Change: -11.1% | |
| BLTE Links: Profile News Message Board | |
| Charts:- Daily , Weekly | |
| Add BLTE to Watchlist: View: Get Complete BLTE Trend Analysis ➞ | |
 | JANX Janux Therapeutics, Inc. |
| Sector: Health Care | |
| SubSector: Biotechnology | |
| MarketCap: 496 Millions | |
| Recent Price: 58.04 Market Intelligence Score: 93 | |
| Day Percent Change: -0.26% Day Change: -0.15 | |
| Week Change: 22.31% Year-to-date Change: 440.2% | |
| JANX Links: Profile News Message Board | |
| Charts:- Daily , Weekly | |
| Add JANX to Watchlist: View: Get Complete JANX Trend Analysis ➞ | |
 | GILD Gilead Sciences, Inc. |
| Sector: Health Care | |
| SubSector: Biotechnology | |
| MarketCap: 99485.6 Millions | |
| Recent Price: 65.33 Market Intelligence Score: 27 | |
| Day Percent Change: -0.27% Day Change: -0.18 | |
| Week Change: -0.14% Year-to-date Change: -19.4% | |
| GILD Links: Profile News Message Board | |
| Charts:- Daily , Weekly | |
| Add GILD to Watchlist: View: Get Complete GILD Trend Analysis ➞ | |
 | ARVN Arvinas, Inc. |
| Sector: Health Care | |
| SubSector: Biotechnology | |
| MarketCap: 3469.85 Millions | |
| Recent Price: 32.39 Market Intelligence Score: 0 | |
| Day Percent Change: -0.28% Day Change: -0.09 | |
| Week Change: 0.06% Year-to-date Change: -21.3% | |
| ARVN Links: Profile News Message Board | |
| Charts:- Daily , Weekly | |
| Add ARVN to Watchlist: View: Get Complete ARVN Trend Analysis ➞ | |
 | IMAB I Mab |
| Sector: Health Care | |
| SubSector: Biotechnology | |
| MarketCap: 26187 Millions | |
| Recent Price: 1.76 Market Intelligence Score: 15 | |
| Day Percent Change: -0.28% Day Change: 0.00 | |
| Week Change: -2.22% Year-to-date Change: -7.4% | |
| IMAB Links: Profile News Message Board | |
| Charts:- Daily , Weekly | |
| Add IMAB to Watchlist: View: Get Complete IMAB Trend Analysis ➞ | |
 | GRTS Gritstone Oncology, Inc. |
| Sector: Health Care | |
| SubSector: Biotechnology | |
| MarketCap: 240.085 Millions | |
| Recent Price: 0.87 Market Intelligence Score: 64 | |
| Day Percent Change: -0.29% Day Change: 0.00 | |
| Week Change: 7.11% Year-to-date Change: -57.3% | |
| GRTS Links: Profile News Message Board | |
| Charts:- Daily , Weekly | |
| Add GRTS to Watchlist: View: Get Complete GRTS Trend Analysis ➞ | |
 | EXAI Exscientia plc |
| Sector: Health Care | |
| SubSector: Biotechnology | |
| MarketCap: 796 Millions | |
| Recent Price: 5.12 Market Intelligence Score: 57 | |
| Day Percent Change: -0.29% Day Change: -0.01 | |
| Week Change: 26.77% Year-to-date Change: -20.9% | |
| EXAI Links: Profile News Message Board | |
| Charts:- Daily , Weekly | |
| Add EXAI to Watchlist: View: Get Complete EXAI Trend Analysis ➞ | |
 | SRPT Sarepta Therapeutics, Inc. |
| Sector: Health Care | |
| SubSector: Biotechnology | |
| MarketCap: 7388.05 Millions | |
| Recent Price: 130.50 Market Intelligence Score: 100 | |
| Day Percent Change: -0.31% Day Change: -0.40 | |
| Week Change: 1.34% Year-to-date Change: 35.3% | |
| SRPT Links: Profile News Message Board | |
| Charts:- Daily , Weekly | |
| Add SRPT to Watchlist: View: Get Complete SRPT Trend Analysis ➞ | |
 | CNTA Centessa Pharmaceuticals plc |
| Sector: Health Care | |
| SubSector: Biotechnology | |
| MarketCap: 616 Millions | |
| Recent Price: 9.44 Market Intelligence Score: 25 | |
| Day Percent Change: -0.32% Day Change: -0.03 | |
| Week Change: 5.65% Year-to-date Change: 16.8% | |
| CNTA Links: Profile News Message Board | |
| Charts:- Daily , Weekly | |
| Add CNTA to Watchlist: View: Get Complete CNTA Trend Analysis ➞ | |
 | XBIT XBiotech Inc. |
| Sector: Health Care | |
| SubSector: Biotechnology | |
| MarketCap: 420.385 Millions | |
| Recent Price: 8.13 Market Intelligence Score: 75 | |
| Day Percent Change: -0.37% Day Change: -0.03 | |
| Week Change: 3.3% Year-to-date Change: 103.3% | |
| XBIT Links: Profile News Message Board | |
| Charts:- Daily , Weekly | |
| Add XBIT to Watchlist: View: Get Complete XBIT Trend Analysis ➞ | |
 | ABUS Arbutus Biopharma Corporation |
| Sector: Health Care | |
| SubSector: Biotechnology | |
| MarketCap: 110.885 Millions | |
| Recent Price: 2.68 Market Intelligence Score: 17 | |
| Day Percent Change: -0.37% Day Change: -0.01 | |
| Week Change: -1.83% Year-to-date Change: 7.2% | |
| ABUS Links: Profile News Message Board | |
| Charts:- Daily , Weekly | |
| Add ABUS to Watchlist: View: Get Complete ABUS Trend Analysis ➞ | |
 | PBYI Puma Biotechnology, Inc. |
| Sector: Health Care | |
| SubSector: Biotechnology | |
| MarketCap: 385.585 Millions | |
| Recent Price: 4.93 Market Intelligence Score: 10 | |
| Day Percent Change: -0.40% Day Change: -0.02 | |
| Week Change: -1.79% Year-to-date Change: 13.9% | |
| PBYI Links: Profile News Message Board | |
| Charts:- Daily , Weekly | |
| Add PBYI to Watchlist: View: Get Complete PBYI Trend Analysis ➞ | |
 | IGMS IGM Biosciences, Inc. |
| Sector: Health Care | |
| SubSector: Biotechnology | |
| MarketCap: 2000.05 Millions | |
| Recent Price: 9.44 Market Intelligence Score: 42 | |
| Day Percent Change: -0.42% Day Change: -0.04 | |
| Week Change: 0.43% Year-to-date Change: 13.6% | |
| IGMS Links: Profile News Message Board | |
| Charts:- Daily , Weekly | |
| Add IGMS to Watchlist: View: Get Complete IGMS Trend Analysis ➞ | |
 | SLN Silence Therapeutics plc |
| Sector: Health Care | |
| SubSector: Biotechnology | |
| MarketCap: 198 Millions | |
| Recent Price: 21.31 Market Intelligence Score: 0 | |
| Day Percent Change: -0.42% Day Change: -0.09 | |
| Week Change: -1.37% Year-to-date Change: 21.4% | |
| SLN Links: Profile News Message Board | |
| Charts:- Daily , Weekly | |
| Add SLN to Watchlist: View: Get Complete SLN Trend Analysis ➞ | |
 | KPTI Karyopharm Therapeutics Inc. |
| Sector: Health Care | |
| SubSector: Biotechnology | |
| MarketCap: 1471.85 Millions | |
| Recent Price: 1.08 Market Intelligence Score: 27 | |
| Day Percent Change: -0.46% Day Change: -0.01 | |
| Week Change: 1.42% Year-to-date Change: 24.3% | |
| KPTI Links: Profile News Message Board | |
| Charts:- Daily , Weekly | |
| Add KPTI to Watchlist: View: Get Complete KPTI Trend Analysis ➞ | |
| To view more stocks, click on Next / Previous arrows or select different range: 0 - 25 , 25 - 50 , 50 - 75 , 75 - 100 , 100 - 125 , 125 - 150 , 150 - 175 , 175 - 200 , 200 - 225 , 225 - 250 , 250 - 275 , 275 - 300 , 300 - 325 , 325 - 350 , 350 - 375 , 375 - 400 | ||
| Click To Change The Sort Order: By Market Cap or Company Size Performance: Year-to-date, Week and Day | |
| Select Chart Type: | ||
|
Best Stocks Today 12Stocks.com |
© 2024 12Stocks.com Terms & Conditions Privacy Contact Us
All Information Provided Only For Education And Not To Be Used For Investing or Trading. See Terms & Conditions


One More Thing ... Get Best Stocks Delivered Daily!
Never Ever Miss A Move With Our Top Ten Stocks Lists
Find Best Stocks In Any Market - Bull or Bear Market
Take A Peek At Our Top Ten Stocks Lists: Daily, Weekly, Year-to-Date & Top Trends
Find Best Stocks In Any Market - Bull or Bear Market
Take A Peek At Our Top Ten Stocks Lists: Daily, Weekly, Year-to-Date & Top Trends
Biotech Stocks With Best Up Trends [0-bearish to 100-bullish]: Emergent Bio[100], Blueprint Medicines[100], Corcept [100], Anika [100], Bio-Techne [100], Agios [100], Reneo [100], United [100], Mesoblast [100], AnaptysBio [100], Revolution Medicines[100]
Best Biotech Stocks Year-to-Date:
Pieris [6064.83%], Avenue [2924.84%], Precision [2842.47%], Inovio [2249.02%], Assembly [1493.71%], Agenus [1414.68%], NuCana [1245.5%], Adverum nologies[1228.37%], Affimed N.V[740%], Mesoblast [562.73%], Corbus [533.61%] Best Biotech Stocks This Week:
CytomX [182.08%], Deciphera [73.17%], Emergent Bio[71.88%], Cue Biopharma[36.26%], Seres [33.33%], Poseida [31.22%], Exscientia [26.77%], Personalis [26.48%], Wave Life[26.18%], Nektar [26.14%], Codexis [25.56%] Best Biotech Stocks Daily:
Emergent Bio[70.98%], Orchestra BioMed[18.83%], Ocular Therapeutix[16.53%], Cellectis S.A[14.75%], Blueprint Medicines[12.75%], Moderna [12.70%], Mustang Bio[12.65%], Black Diamond[11.53%], EyePoint [10.53%], iBio [9.73%], Omeros [9.71%]