
 Login Sign Up


| |||||
 |  | ||||

| 12Stocks.com Market Intelligence |
Best Biotech Stocks
|
|
| Quick Read: Best Biotech Stocks List By Performances & Trends: Daily, Weekly, Year-to-Date, Market Cap (Size) & Technical Trends | |||
| Best Biotech Stocks Views: Quick Browse View, Summary & Slide Show View | |||
| 12Stocks.com Biotech Stocks Performances & Trends Daily | |||||||||
|
|  The overall market intelligence score is 50 (0-bearish to 100-bullish) which puts Biotech sector in short term neutral trend. The market intelligence score from previous trading session is 49 and hence an improvement of trend.
| ||||||||
Here are the market intelligence trend scores of the most requested Biotech stocks at 12Stocks.com (click stock name for detailed review):
|


| 12Stocks.com: Investing in Biotech sector with Stocks | |
|
The following table helps investors and traders sort through current performance and trends (as measured by market intelligence score) of various
stocks in the Biotech sector. Quick View: Move mouse or cursor over stock symbol (ticker) to view short-term Technical chart and over stock name to view long term chart. Click on  to add stock symbol to your watchlist and to add stock symbol to your watchlist and  to view watchlist. Click on any ticker or stock name for detailed market intelligence report for that stock. to view watchlist. Click on any ticker or stock name for detailed market intelligence report for that stock. |
12Stocks.com Performance of Stocks in Biotech Sector
| Ticker | Stock Name | Watchlist | Category | Recent Price | Market Intelligence Score | Change % | YTD Change% |
| NBTX | Nanobiotix S.A |   | Biotechnology | 6.00 | 37 | -3.07 | -19.14% |
| QSI | Quantum-Si | | Biotechnology | 1.74 | 88 | -3.07 | -13.68% |
| XNCR | Xencor | | Biotechnology | 23.19 | 100 | -3.09 | 9.23% |
| GNLX | Genelux | | Biotechnology | 3.17 | 30 | -3.35 | -79.17% |
| AFMD | Affimed N.V | | Biotechnology | 5.17 | 53 | -3.46 | 726.40% |
| ARQT | Arcutis Bio | | Biotechnology | 8.53 | 27 | -3.56 | 163.93% |
| GERN | Geron | | Biotechnology | 3.92 | 70 | -3.92 | 85.78% |
| VOR | Vor Biopharma | | Biotechnology | 1.70 | 5 | -3.95 | -23.42% |
| SMMT | Summit | | Biotechnology | 4.49 | 82 | -4.47 | 72.03% |
| GALT | Galectin | | Biotechnology | 3.33 | 36 | -4.86 | 100.60% |
| ATRA | Atara Bio | | Biotechnology | 0.65 | 10 | -5.01 | 26.79% |
| ADCT | ADC | | Biotechnology | 4.47 | 35 | -5.10 | 169.28% |
| LCTX | Lineage Cell | | Biotechnology | 1.07 | 36 | -5.31 | -1.83% |
| BCLI | Brainstorm Cell | | Biotechnology | 0.41 | 46 | -5.52 | 50.37% |
| MCRB | Seres | | Biotechnology | 1.02 | 64 | -5.56 | -27.14% |
| VAXX | Vaxxinity | | Biotechnology | 0.11 | 10 | -6.48 | -87.11% |
| SLGL | Sol-Gel Technologies | | Biotechnology | 0.73 | 10 | -6.52 | -33.85% |
| GLUE | Monte Rosa | | Biotechnology | 5.54 | 15 | -6.58 | -1.60% |
| LYRA | Lyra | | Biotechnology | 4.84 | 15 | -7.81 | -7.28% |
| SWTX | SpringWorks | | Biotechnology | 42.27 | 7 | -9.76 | 15.81% |
| CTMX | CytomX | | Biotechnology | 4.42 | 100 | -13.94 | 184.84% |
| To view more stocks, click on Next / Previous arrows or select different range: 0 - 25 , 25 - 50 , 50 - 75 , 75 - 100 , 100 - 125 , 125 - 150 , 150 - 175 , 175 - 200 , 200 - 225 , 225 - 250 , 250 - 275 , 275 - 300 , 300 - 325 , 325 - 350 , 350 - 375 | ||
 | Click To Change The Sort Order: By Market Cap or Company Size Performance: Year-to-date, Week and Day |  |
|
Get the most comprehensive stock market coverage daily at 12Stocks.com ➞ Best Stocks Today ➞ Best Stocks Weekly ➞ Best Stocks Year-to-Date ➞ Best Stocks Trends ➞  Best Stocks Today 12Stocks.com Best Nasdaq Stocks ➞ Best S&P 500 Stocks ➞ Best Tech Stocks ➞ Best Biotech Stocks ➞ |
| Detailed Overview of Biotech Stocks |
| Biotech Technical Overview, Leaders & Laggards, Top Biotech ETF Funds & Detailed Biotech Stocks List, Charts, Trends & More |
| Biotech Sector: Technical Analysis, Trends & YTD Performance | |
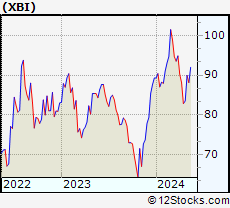
| Biotech sector, as represented by XBI, an exchange-traded fund [ETF] that holds basket of Biotech stocks (e.g, Amgen, Celgene) is down by -1.68% and is currently underperforming the overall market by -6.83% year-to-date. Below is a quick view of Technical charts and trends: | |
 XBI Weekly Chart |
|
| Long Term Trend: Not Good | |
| Medium Term Trend: Deteriorating | |
 XBI Daily Chart |
|
| Short Term Trend: Very Good | |
| Overall Trend Score: 50 | |
| YTD Performance: -1.68% | |
| **Trend Scores & Views Are Only For Educational Purposes And Not For Investing | |
| 12Stocks.com: Top Performing Biotech Sector Stocks | ||||||||||||||||||||||||||||||||||||||||||||||||
 The top performing Biotech sector stocks year to date are
Now, more recently, over last week, the top performing Biotech sector stocks on the move are


|
||||||||||||||||||||||||||||||||||||||||||||||||
| 12Stocks.com: Investing in Biotech Sector using Exchange Traded Funds | |
|
The following table shows list of key exchange traded funds (ETF) that
help investors track Biotech Index. For detailed view, check out our ETF Funds section of our website. Quick View: Move mouse or cursor over ETF symbol (ticker) to view short-term Technical chart and over ETF name to view long term chart. Click on ticker or stock name for detailed view. Click on to add stock symbol to your watchlist and to view watchlist. |
12Stocks.com List of ETFs that track Biotech Index
| Ticker | ETF Name | Watchlist | Recent Price | Market Intelligence Score | Change % | Week % | Year-to-date % |
| LABD | Biotech Bear 3X | | 8.94 | 44 | -1.00 | -15.02 | -7.74% |
| XBI | Biotech | | 87.79 | 50 | 0.53 | 5.15 | -1.68% |
| LABU | Biotech Bull 3X | | 100.63 | 42 | 0.82 | 14.99 | -17.5% |
| IBB | Biotechnology | | 130.00 | 57 | 0.39 | 2.77 | -4.31% |
| CURE | Healthcare Bull 3X | | 105.75 | 35 | -0.76 | 0.42 | 3.94% |
| IXJ | Global Healthcare | | 89.33 | 45 | -0.26 | 0.24 | 3.01% |
| IHF | Healthcare Providers | | 51.55 | 15 | 0.21 | -0.71 | -1.83% |
| BIB | Biotechnology | | 52.58 | 57 | 0.00 | 5.88 | -7.84% |
| BBH | Biotech | | 160.01 | 64 | 0.86 | 2.8 | -3.21% |
| 12Stocks.com: Charts, Trends, Fundamental Data and Performances of Biotech Stocks | |
|
We now take in-depth look at all Biotech stocks including charts, multi-period performances and overall trends (as measured by market intelligence score). One can sort Biotech stocks (click link to choose) by Daily, Weekly and by Year-to-Date performances. Also, one can sort by size of the company or by market capitalization. |
| Select Your Default Chart Type: | |||||
| |||||
| Click on stock symbol or name for detailed view. Click on to add stock symbol to your watchlist and to view watchlist. Quick View: Move mouse or cursor over "Daily" to quickly view daily Technical stock chart and over "Weekly" to view weekly Technical stock chart. | |||||

 | NBTX Nanobiotix S.A. |
| Sector: Health Care | |
| SubSector: Biotechnology | |
| MarketCap: 177 Millions | |
| Recent Price: 6.00 Market Intelligence Score: 37 | |
| Day Percent Change: -3.07% Day Change: -0.19 | |
| Week Change: 4.53% Year-to-date Change: -19.1% | |
| NBTX Links: Profile News Message Board | |
| Charts:- Daily , Weekly | |
| Add NBTX to Watchlist: View: Get Complete NBTX Trend Analysis ➞ | |
 | QSI Quantum-Si incorporated |
| Sector: Health Care | |
| SubSector: Biotechnology | |
| MarketCap: 256 Millions | |
| Recent Price: 1.74 Market Intelligence Score: 88 | |
| Day Percent Change: -3.07% Day Change: -0.05 | |
| Week Change: 5.15% Year-to-date Change: -13.7% | |
| QSI Links: Profile News Message Board | |
| Charts:- Daily , Weekly | |
| Add QSI to Watchlist: View: Get Complete QSI Trend Analysis ➞ | |
 | XNCR Xencor, Inc. |
| Sector: Health Care | |
| SubSector: Biotechnology | |
| MarketCap: 1744.35 Millions | |
| Recent Price: 23.19 Market Intelligence Score: 100 | |
| Day Percent Change: -3.09% Day Change: -0.74 | |
| Week Change: 16.07% Year-to-date Change: 9.2% | |
| XNCR Links: Profile News Message Board | |
| Charts:- Daily , Weekly | |
| Add XNCR to Watchlist: View: Get Complete XNCR Trend Analysis ➞ | |
 | GNLX Genelux Corporation |
| Sector: Health Care | |
| SubSector: Biotechnology | |
| MarketCap: 820 Millions | |
| Recent Price: 3.17 Market Intelligence Score: 30 | |
| Day Percent Change: -3.35% Day Change: -0.11 | |
| Week Change: -7.31% Year-to-date Change: -79.2% | |
| GNLX Links: Profile News Message Board | |
| Charts:- Daily , Weekly | |
| Add GNLX to Watchlist: View: Get Complete GNLX Trend Analysis ➞ | |
 | AFMD Affimed N.V. |
| Sector: Health Care | |
| SubSector: Biotechnology | |
| MarketCap: 161.385 Millions | |
| Recent Price: 5.17 Market Intelligence Score: 53 | |
| Day Percent Change: -3.46% Day Change: -0.18 | |
| Week Change: 2.68% Year-to-date Change: 726.4% | |
| AFMD Links: Profile News Message Board | |
| Charts:- Daily , Weekly | |
| Add AFMD to Watchlist: View: Get Complete AFMD Trend Analysis ➞ | |
 | ARQT Arcutis Biotherapeutics, Inc. |
| Sector: Health Care | |
| SubSector: Biotechnology | |
| MarketCap: 12787 Millions | |
| Recent Price: 8.53 Market Intelligence Score: 27 | |
| Day Percent Change: -3.56% Day Change: -0.31 | |
| Week Change: 0.65% Year-to-date Change: 163.9% | |
| ARQT Links: Profile News Message Board | |
| Charts:- Daily , Weekly | |
| Add ARQT to Watchlist: View: Get Complete ARQT Trend Analysis ➞ | |
 | GERN Geron Corporation |
| Sector: Health Care | |
| SubSector: Biotechnology | |
| MarketCap: 228.685 Millions | |
| Recent Price: 3.92 Market Intelligence Score: 70 | |
| Day Percent Change: -3.92% Day Change: -0.16 | |
| Week Change: 3.43% Year-to-date Change: 85.8% | |
| GERN Links: Profile News Message Board | |
| Charts:- Daily , Weekly | |
| Add GERN to Watchlist: View: Get Complete GERN Trend Analysis ➞ | |
 | VOR Vor Biopharma Inc. |
| Sector: Health Care | |
| SubSector: Biotechnology | |
| MarketCap: 224 Millions | |
| Recent Price: 1.70 Market Intelligence Score: 5 | |
| Day Percent Change: -3.95% Day Change: -0.07 | |
| Week Change: 0.59% Year-to-date Change: -23.4% | |
| VOR Links: Profile News Message Board | |
| Charts:- Daily , Weekly | |
| Add VOR to Watchlist: View: Get Complete VOR Trend Analysis ➞ | |
 | SMMT Summit Therapeutics plc |
| Sector: Health Care | |
| SubSector: Biotechnology | |
| MarketCap: 156.985 Millions | |
| Recent Price: 4.49 Market Intelligence Score: 82 | |
| Day Percent Change: -4.47% Day Change: -0.21 | |
| Week Change: 16.32% Year-to-date Change: 72.0% | |
| SMMT Links: Profile News Message Board | |
| Charts:- Daily , Weekly | |
| Add SMMT to Watchlist: View: Get Complete SMMT Trend Analysis ➞ | |
 | GALT Galectin Therapeutics, Inc. |
| Sector: Health Care | |
| SubSector: Biotechnology | |
| MarketCap: 114.185 Millions | |
| Recent Price: 3.33 Market Intelligence Score: 36 | |
| Day Percent Change: -4.86% Day Change: -0.17 | |
| Week Change: -3.48% Year-to-date Change: 100.6% | |
| GALT Links: Profile News Message Board | |
| Charts:- Daily , Weekly | |
| Add GALT to Watchlist: View: Get Complete GALT Trend Analysis ➞ | |
 | ATRA Atara Biotherapeutics, Inc. |
| Sector: Health Care | |
| SubSector: Biotechnology | |
| MarketCap: 579.185 Millions | |
| Recent Price: 0.65 Market Intelligence Score: 10 | |
| Day Percent Change: -5.01% Day Change: -0.03 | |
| Week Change: -5.77% Year-to-date Change: 26.8% | |
| ATRA Links: Profile News Message Board | |
| Charts:- Daily , Weekly | |
| Add ATRA to Watchlist: View: Get Complete ATRA Trend Analysis ➞ | |
 | ADCT ADC Therapeutics SA |
| Sector: Health Care | |
| SubSector: Biotechnology | |
| MarketCap: 26087 Millions | |
| Recent Price: 4.47 Market Intelligence Score: 35 | |
| Day Percent Change: -5.10% Day Change: -0.24 | |
| Week Change: 3% Year-to-date Change: 169.3% | |
| ADCT Links: Profile News Message Board | |
| Charts:- Daily , Weekly | |
| Add ADCT to Watchlist: View: Get Complete ADCT Trend Analysis ➞ | |
 | LCTX Lineage Cell Therapeutics, Inc. |
| Sector: Health Care | |
| SubSector: Biotechnology | |
| MarketCap: 141.285 Millions | |
| Recent Price: 1.07 Market Intelligence Score: 36 | |
| Day Percent Change: -5.31% Day Change: -0.06 | |
| Week Change: -6.14% Year-to-date Change: -1.8% | |
| LCTX Links: Profile News Message Board | |
| Charts:- Daily , Weekly | |
| Add LCTX to Watchlist: View: Get Complete LCTX Trend Analysis ➞ | |
 | BCLI Brainstorm Cell Therapeutics Inc. |
| Sector: Health Care | |
| SubSector: Biotechnology | |
| MarketCap: 141.285 Millions | |
| Recent Price: 0.41 Market Intelligence Score: 46 | |
| Day Percent Change: -5.52% Day Change: -0.02 | |
| Week Change: -23.2% Year-to-date Change: 50.4% | |
| BCLI Links: Profile News Message Board | |
| Charts:- Daily , Weekly | |
| Add BCLI to Watchlist: View: Get Complete BCLI Trend Analysis ➞ | |
 | MCRB Seres Therapeutics, Inc. |
| Sector: Health Care | |
| SubSector: Biotechnology | |
| MarketCap: 217.585 Millions | |
| Recent Price: 1.02 Market Intelligence Score: 64 | |
| Day Percent Change: -5.56% Day Change: -0.06 | |
| Week Change: 23.64% Year-to-date Change: -27.1% | |
| MCRB Links: Profile News Message Board | |
| Charts:- Daily , Weekly | |
| Add MCRB to Watchlist: View: Get Complete MCRB Trend Analysis ➞ | |
 | VAXX Vaxxinity, Inc. |
| Sector: Health Care | |
| SubSector: Biotechnology | |
| MarketCap: 320 Millions | |
| Recent Price: 0.11 Market Intelligence Score: 10 | |
| Day Percent Change: -6.48% Day Change: -0.01 | |
| Week Change: -7.12% Year-to-date Change: -87.1% | |
| VAXX Links: Profile News Message Board | |
| Charts:- Daily , Weekly | |
| Add VAXX to Watchlist: View: Get Complete VAXX Trend Analysis ➞ | |
 | SLGL Sol-Gel Technologies Ltd. |
| Sector: Health Care | |
| SubSector: Biotechnology | |
| MarketCap: 183.285 Millions | |
| Recent Price: 0.73 Market Intelligence Score: 10 | |
| Day Percent Change: -6.52% Day Change: -0.05 | |
| Week Change: -14.1% Year-to-date Change: -33.9% | |
| SLGL Links: Profile News Message Board | |
| Charts:- Daily , Weekly | |
| Add SLGL to Watchlist: View: Get Complete SLGL Trend Analysis ➞ | |
 | GLUE Monte Rosa Therapeutics, Inc. |
| Sector: Health Care | |
| SubSector: Biotechnology | |
| MarketCap: 346 Millions | |
| Recent Price: 5.54 Market Intelligence Score: 15 | |
| Day Percent Change: -6.58% Day Change: -0.39 | |
| Week Change: 3.94% Year-to-date Change: -1.6% | |
| GLUE Links: Profile News Message Board | |
| Charts:- Daily , Weekly | |
| Add GLUE to Watchlist: View: Get Complete GLUE Trend Analysis ➞ | |
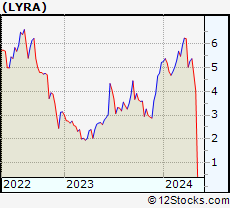 | LYRA Lyra Therapeutics, Inc. |
| Sector: Health Care | |
| SubSector: Biotechnology | |
| MarketCap: 12487 Millions | |
| Recent Price: 4.84 Market Intelligence Score: 15 | |
| Day Percent Change: -7.81% Day Change: -0.41 | |
| Week Change: 2.54% Year-to-date Change: -7.3% | |
| LYRA Links: Profile News Message Board | |
| Charts:- Daily , Weekly | |
| Add LYRA to Watchlist: View: Get Complete LYRA Trend Analysis ➞ | |
 | SWTX SpringWorks Therapeutics, Inc. |
| Sector: Health Care | |
| SubSector: Biotechnology | |
| MarketCap: 1311.85 Millions | |
| Recent Price: 42.27 Market Intelligence Score: 7 | |
| Day Percent Change: -9.76% Day Change: -4.57 | |
| Week Change: -7.16% Year-to-date Change: 15.8% | |
| SWTX Links: Profile News Message Board | |
| Charts:- Daily , Weekly | |
| Add SWTX to Watchlist: View: Get Complete SWTX Trend Analysis ➞ | |
 | CTMX CytomX Therapeutics, Inc. |
| Sector: Health Care | |
| SubSector: Biotechnology | |
| MarketCap: 264.885 Millions | |
| Recent Price: 4.42 Market Intelligence Score: 100 | |
| Day Percent Change: -13.94% Day Change: -0.71 | |
| Week Change: 177.67% Year-to-date Change: 184.8% | |
| CTMX Links: Profile News Message Board | |
| Charts:- Daily , Weekly | |
| Add CTMX to Watchlist: View: Get Complete CTMX Trend Analysis ➞ | |
| To view more stocks, click on Next / Previous arrows or select different range: 0 - 25 , 25 - 50 , 50 - 75 , 75 - 100 , 100 - 125 , 125 - 150 , 150 - 175 , 175 - 200 , 200 - 225 , 225 - 250 , 250 - 275 , 275 - 300 , 300 - 325 , 325 - 350 , 350 - 375 | ||
| Click To Change The Sort Order: By Market Cap or Company Size Performance: Year-to-date, Week and Day | |
| Select Chart Type: | ||
|
Best Stocks Today 12Stocks.com |
© 2024 12Stocks.com Terms & Conditions Privacy Contact Us
All Information Provided Only For Education And Not To Be Used For Investing or Trading. See Terms & Conditions


One More Thing ... Get Best Stocks Delivered Daily!
Never Ever Miss A Move With Our Top Ten Stocks Lists
Find Best Stocks In Any Market - Bull or Bear Market
Take A Peek At Our Top Ten Stocks Lists: Daily, Weekly, Year-to-Date & Top Trends
Find Best Stocks In Any Market - Bull or Bear Market
Take A Peek At Our Top Ten Stocks Lists: Daily, Weekly, Year-to-Date & Top Trends
Biotech Stocks With Best Up Trends [0-bearish to 100-bullish]: Emergent Bio[100], Blueprint Medicines[100], Sarepta [100], Corcept [100], Reneo [100], Agios [100], PMV [100], United [100], Anika [100], Bio-Techne [100], Nuvation Bio[100]
Best Biotech Stocks Year-to-Date:
Pieris [6191.21%], Avenue [2840.99%], Precision [2730.14%], Inovio [2166.67%], Agenus [1494.4%], Assembly [1491.27%], NuCana [1245.5%], Adverum nologies[1168.6%], Affimed N.V[726.4%], Corbus [550.66%], Mesoblast [550%] Best Biotech Stocks This Week:
CytomX [177.67%], Emergent Bio[110.94%], Cue Biopharma[35.9%], Poseida [34.98%], Exscientia [26.77%], Nektar [26.14%], Wave Life[24.89%], Seres [23.64%], Ventyx [23.6%], AnaptysBio [23.05%], Janux [22.31%] Best Biotech Stocks Daily:
Emergent Bio[109.84%], Blueprint Medicines[11.41%], Cellectis S.A[9.62%], iBio [9.19%], Ocular Therapeutix[8.96%], Repare [6.21%], Palatin Technologies[5.88%], Omeros [5.59%], Corbus [5.50%], Amylyx [5.45%], G1 [5.33%]