
 Login Sign Up


| |||||
 |  | ||||

| 12Stocks.com Market Intelligence |
Best Biotech Stocks
|
|
| Quick Read: Best Biotech Stocks List By Performances & Trends: Daily, Weekly, Year-to-Date, Market Cap (Size) & Technical Trends | |||
| Best Biotech Stocks Views: Quick Browse View, Summary & Slide Show View | |||
| 12Stocks.com Biotech Stocks Performances & Trends Daily | |||||||||
|
|  The overall market intelligence score is 32 (0-bearish to 100-bullish) which puts Biotech sector in short term bearish to neutral trend. The market intelligence score from previous trading session is 10 and hence an improvement of trend.
| ||||||||
Here are the market intelligence trend scores of the most requested Biotech stocks at 12Stocks.com (click stock name for detailed review):
|


| 12Stocks.com: Investing in Biotech sector with Stocks | |
|
The following table helps investors and traders sort through current performance and trends (as measured by market intelligence score) of various
stocks in the Biotech sector. Quick View: Move mouse or cursor over stock symbol (ticker) to view short-term Technical chart and over stock name to view long term chart. Click on  to add stock symbol to your watchlist and to add stock symbol to your watchlist and  to view watchlist. Click on any ticker or stock name for detailed market intelligence report for that stock. to view watchlist. Click on any ticker or stock name for detailed market intelligence report for that stock. |
12Stocks.com Performance of Stocks in Biotech Sector
| Ticker | Stock Name | Watchlist | Category | Recent Price | Market Intelligence Score | Change % | YTD Change% |
| ATAI | Atai Life |   | Biotechnology | 1.97 | 43 | 4.79 | 39.72% |
| IOVA | Iovance Bio | | Biotechnology | 11.86 | 63 | 4.77 | 45.88% |
| CGEN | Compugen | | Biotechnology | 1.98 | 32 | 4.76 | 0.00% |
| NUVL | Nuvalent | | Biotechnology | 67.56 | 49 | 4.76 | -8.07% |
| MRVI | Maravai Life | | Biotechnology | 7.72 | 68 | 4.75 | 17.86% |
| ACLX | Arcellx | | Biotechnology | 54.43 | 25 | 4.67 | -2.46% |
| CRON | Cronos | | Biotechnology | 2.47 | 68 | 4.66 | 18.18% |
| AVDL | Avadel | | Biotechnology | 18.09 | 100 | 4.57 | 28.12% |
| ZURA | Zura Bio | | Biotechnology | 3.46 | 73 | 4.53 | -26.15% |
| KALA | Kala | | Biotechnology | 6.61 | 27 | 4.42 | -5.57% |
| NKTR | Nektar | | Biotechnology | 1.42 | 95 | 4.41 | 151.33% |
| TARS | Tarsus | | Biotechnology | 33.71 | 63 | 4.40 | 66.22% |
| PMVP | PMV | | Biotechnology | 1.80 | 100 | 4.34 | -41.77% |
| ERAS | Erasca | | Biotechnology | 1.93 | 68 | 4.32 | -9.39% |
| MIST | Milestone | | Biotechnology | 1.70 | 68 | 4.29 | 1.80% |
| CDMO | Avid Bioservices | | Biotechnology | 6.68 | 62 | 4.21 | 2.77% |
| BTAI | BioXcel | | Biotechnology | 2.97 | 69 | 4.21 | 0.68% |
| RNA | Avidity | | Biotechnology | 25.14 | 90 | 4.06 | 178.10% |
| NRIX | Nurix | | Biotechnology | 14.13 | 68 | 4.05 | 36.79% |
| GNLX | Genelux | | Biotechnology | 3.48 | 20 | 4.03 | -77.10% |
| PHVS | Pharvaris N.V | | Biotechnology | 21.70 | 42 | 3.98 | -23.39% |
| KYMR | Kymera | | Biotechnology | 35.71 | 70 | 3.96 | 40.54% |
| IPHA | Innate Pharma | | Biotechnology | 2.37 | 10 | 3.95 | -15.36% |
| RLYB | Rallybio | | Biotechnology | 1.84 | 88 | 3.95 | -22.03% |
| VOR | Vor Biopharma | | Biotechnology | 1.89 | 37 | 3.85 | -14.86% |
| To view more stocks, click on Next / Previous arrows or select different range: 0 - 25 , 25 - 50 , 50 - 75 , 75 - 100 , 100 - 125 , 125 - 150 , 150 - 175 , 175 - 200 , 200 - 225 , 225 - 250 , 250 - 275 , 275 - 300 , 300 - 325 , 325 - 350 , 350 - 375 , 375 - 400 | ||
 | Click To Change The Sort Order: By Market Cap or Company Size Performance: Year-to-date, Week and Day |  |
|
Get the most comprehensive stock market coverage daily at 12Stocks.com ➞ Best Stocks Today ➞ Best Stocks Weekly ➞ Best Stocks Year-to-Date ➞ Best Stocks Trends ➞  Best Stocks Today 12Stocks.com Best Nasdaq Stocks ➞ Best S&P 500 Stocks ➞ Best Tech Stocks ➞ Best Biotech Stocks ➞ |
| Detailed Overview of Biotech Stocks |
| Biotech Technical Overview, Leaders & Laggards, Top Biotech ETF Funds & Detailed Biotech Stocks List, Charts, Trends & More |
| Biotech Sector: Technical Analysis, Trends & YTD Performance | |
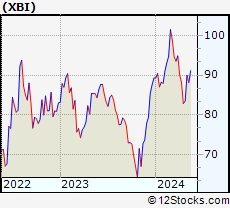
| Biotech sector, as represented by XBI, an exchange-traded fund [ETF] that holds basket of Biotech stocks (e.g, Amgen, Celgene) is down by -5.15% and is currently underperforming the overall market by -10.79% year-to-date. Below is a quick view of Technical charts and trends: | |
 XBI Weekly Chart |
|
| Long Term Trend: Not Good | |
| Medium Term Trend: Not Good | |
 XBI Daily Chart |
|
| Short Term Trend: Very Good | |
| Overall Trend Score: 32 | |
| YTD Performance: -5.15% | |
| **Trend Scores & Views Are Only For Educational Purposes And Not For Investing | |
| 12Stocks.com: Top Performing Biotech Sector Stocks | ||||||||||||||||||||||||||||||||||||||||||||||||
 The top performing Biotech sector stocks year to date are
Now, more recently, over last week, the top performing Biotech sector stocks on the move are


|
||||||||||||||||||||||||||||||||||||||||||||||||
| 12Stocks.com: Investing in Biotech Sector using Exchange Traded Funds | |
|
The following table shows list of key exchange traded funds (ETF) that
help investors track Biotech Index. For detailed view, check out our ETF Funds section of our website. Quick View: Move mouse or cursor over ETF symbol (ticker) to view short-term Technical chart and over ETF name to view long term chart. Click on ticker or stock name for detailed view. Click on to add stock symbol to your watchlist and to view watchlist. |
12Stocks.com List of ETFs that track Biotech Index
| Ticker | ETF Name | Watchlist | Recent Price | Market Intelligence Score | Change % | Week % | Year-to-date % |
| LABD | Biotech Bear 3X | | 10.07 | 55 | -6.33 | -6.76 | 3.92% |
| XBI | Biotech | | 84.69 | 32 | 2.28 | 2.25 | -5.15% |
| LABU | Biotech Bull 3X | | 91.98 | 32 | 6.42 | 6.89 | -24.59% |
| IBB | Biotechnology | | 128.02 | 32 | 1.51 | 2.65 | -5.76% |
| PBE | Biotech & Genome | | 61.14 | 39 | 0.82 | 2.16 | -7.14% |
| IXJ | Global Healthcare | | 89.62 | 65 | 1.37 | 2.13 | 3.34% |
| IYH | Healthcare | | 59.21 | 52 | 1.33 | 1.81 | 3.43% |
| IHF | Healthcare Providers | | 52.32 | 70 | 0.47 | 0.21 | -0.36% |
| CURE | Healthcare Bull 3X | | 108.12 | 39 | 3.52 | 4.64 | 6.27% |
| BIB | Biotechnology | | 50.33 | 39 | 2.51 | 4.42 | -11.78% |
| FBT | First NYSE | | 145.32 | 32 | 1.68 | 2.57 | -8.05% |
| BBH | Biotech | | 157.29 | 49 | 1.77 | 3.24 | -4.85% |
| BIS | Short Biotech | | 19.94 | 68 | -2.59 | -4.57 | 10.35% |
| PTH | DWA Healthcare Momentum | | 40.17 | 68 | 2.11 | 1.62 | 2.63% |
| BBP | Bio Biotechnology Products | | 52.39 | 42 | 1.87 | 3.89 | -9.81% |
| BTEC | Principal Healthcare Innovators | | 34.81 | 32 | 3.10 | 2.79 | -4.2% |
| BBC | Bio Biotechnology Clinical | | 25.67 | 51 | 3.26 | 3.89 | 4.98% |
| 12Stocks.com: Charts, Trends, Fundamental Data and Performances of Biotech Stocks | |
|
We now take in-depth look at all Biotech stocks including charts, multi-period performances and overall trends (as measured by market intelligence score). One can sort Biotech stocks (click link to choose) by Daily, Weekly and by Year-to-Date performances. Also, one can sort by size of the company or by market capitalization. |
| Select Your Default Chart Type: | |||||
| |||||
| Click on stock symbol or name for detailed view. Click on to add stock symbol to your watchlist and to view watchlist. Quick View: Move mouse or cursor over "Daily" to quickly view daily Technical stock chart and over "Weekly" to view weekly Technical stock chart. | |||||

 | ATAI Atai Life Sciences N.V. |
| Sector: Health Care | |
| SubSector: Biotechnology | |
| MarketCap: 287 Millions | |
| Recent Price: 1.97 Market Intelligence Score: 43 | |
| Day Percent Change: 4.79% Day Change: 0.09 | |
| Week Change: 6.49% Year-to-date Change: 39.7% | |
| ATAI Links: Profile News Message Board | |
| Charts:- Daily , Weekly | |
| Add ATAI to Watchlist: View: Get Complete ATAI Trend Analysis ➞ | |
 | IOVA Iovance Biotherapeutics, Inc. |
| Sector: Health Care | |
| SubSector: Biotechnology | |
| MarketCap: 3533.35 Millions | |
| Recent Price: 11.86 Market Intelligence Score: 63 | |
| Day Percent Change: 4.77% Day Change: 0.54 | |
| Week Change: 4.77% Year-to-date Change: 45.9% | |
| IOVA Links: Profile News Message Board | |
| Charts:- Daily , Weekly | |
| Add IOVA to Watchlist: View: Get Complete IOVA Trend Analysis ➞ | |
 | CGEN Compugen Ltd. |
| Sector: Health Care | |
| SubSector: Biotechnology | |
| MarketCap: 634.285 Millions | |
| Recent Price: 1.98 Market Intelligence Score: 32 | |
| Day Percent Change: 4.76% Day Change: 0.09 | |
| Week Change: 4.21% Year-to-date Change: 0.0% | |
| CGEN Links: Profile News Message Board | |
| Charts:- Daily , Weekly | |
| Add CGEN to Watchlist: View: Get Complete CGEN Trend Analysis ➞ | |
 | NUVL Nuvalent, Inc. |
| Sector: Health Care | |
| SubSector: Biotechnology | |
| MarketCap: 2400 Millions | |
| Recent Price: 67.56 Market Intelligence Score: 49 | |
| Day Percent Change: 4.76% Day Change: 3.07 | |
| Week Change: 7.65% Year-to-date Change: -8.1% | |
| NUVL Links: Profile News Message Board | |
| Charts:- Daily , Weekly | |
| Add NUVL to Watchlist: View: Get Complete NUVL Trend Analysis ➞ | |
 | MRVI Maravai LifeSciences Holdings, Inc. |
| Sector: Health Care | |
| SubSector: Biotechnology | |
| MarketCap: 67887 Millions | |
| Recent Price: 7.72 Market Intelligence Score: 68 | |
| Day Percent Change: 4.75% Day Change: 0.35 | |
| Week Change: 4.89% Year-to-date Change: 17.9% | |
| MRVI Links: Profile News Message Board | |
| Charts:- Daily , Weekly | |
| Add MRVI to Watchlist: View: Get Complete MRVI Trend Analysis ➞ | |
 | ACLX Arcellx, Inc. |
| Sector: Health Care | |
| SubSector: Biotechnology | |
| MarketCap: 1530 Millions | |
| Recent Price: 54.43 Market Intelligence Score: 25 | |
| Day Percent Change: 4.67% Day Change: 2.43 | |
| Week Change: 5.38% Year-to-date Change: -2.5% | |
| ACLX Links: Profile News Message Board | |
| Charts:- Daily , Weekly | |
| Add ACLX to Watchlist: View: Get Complete ACLX Trend Analysis ➞ | |
 | CRON Cronos Group Inc. |
| Sector: Health Care | |
| SubSector: Biotechnology | |
| MarketCap: 1935.95 Millions | |
| Recent Price: 2.47 Market Intelligence Score: 68 | |
| Day Percent Change: 4.66% Day Change: 0.11 | |
| Week Change: 4.22% Year-to-date Change: 18.2% | |
| CRON Links: Profile News Message Board | |
| Charts:- Daily , Weekly | |
| Add CRON to Watchlist: View: Get Complete CRON Trend Analysis ➞ | |
 | AVDL Avadel Pharmaceuticals plc |
| Sector: Health Care | |
| SubSector: Biotechnology | |
| MarketCap: 354.485 Millions | |
| Recent Price: 18.09 Market Intelligence Score: 100 | |
| Day Percent Change: 4.57% Day Change: 0.79 | |
| Week Change: 4.39% Year-to-date Change: 28.1% | |
| AVDL Links: Profile News Message Board | |
| Charts:- Daily , Weekly | |
| Add AVDL to Watchlist: View: Get Complete AVDL Trend Analysis ➞ | |
 | ZURA Zura Bio Limited |
| Sector: Health Care | |
| SubSector: Biotechnology | |
| MarketCap: 242 Millions | |
| Recent Price: 3.46 Market Intelligence Score: 73 | |
| Day Percent Change: 4.53% Day Change: 0.15 | |
| Week Change: 4.53% Year-to-date Change: -26.2% | |
| ZURA Links: Profile News Message Board | |
| Charts:- Daily , Weekly | |
| Add ZURA to Watchlist: View: Get Complete ZURA Trend Analysis ➞ | |
 | KALA Kala Pharmaceuticals, Inc. |
| Sector: Health Care | |
| SubSector: Biotechnology | |
| MarketCap: 276.485 Millions | |
| Recent Price: 6.61 Market Intelligence Score: 27 | |
| Day Percent Change: 4.42% Day Change: 0.28 | |
| Week Change: -2.94% Year-to-date Change: -5.6% | |
| KALA Links: Profile News Message Board | |
| Charts:- Daily , Weekly | |
| Add KALA to Watchlist: View: Get Complete KALA Trend Analysis ➞ | |
 | NKTR Nektar Therapeutics |
| Sector: Health Care | |
| SubSector: Biotechnology | |
| MarketCap: 2953.45 Millions | |
| Recent Price: 1.42 Market Intelligence Score: 95 | |
| Day Percent Change: 4.41% Day Change: 0.06 | |
| Week Change: 14.52% Year-to-date Change: 151.3% | |
| NKTR Links: Profile News Message Board | |
| Charts:- Daily , Weekly | |
| Add NKTR to Watchlist: View: Get Complete NKTR Trend Analysis ➞ | |
 | TARS Tarsus Pharmaceuticals, Inc. |
| Sector: Health Care | |
| SubSector: Biotechnology | |
| MarketCap: 74487 Millions | |
| Recent Price: 33.71 Market Intelligence Score: 63 | |
| Day Percent Change: 4.40% Day Change: 1.42 | |
| Week Change: 2.49% Year-to-date Change: 66.2% | |
| TARS Links: Profile News Message Board | |
| Charts:- Daily , Weekly | |
| Add TARS to Watchlist: View: Get Complete TARS Trend Analysis ➞ | |
 | PMVP PMV Pharmaceuticals, Inc. |
| Sector: Health Care | |
| SubSector: Biotechnology | |
| MarketCap: 20187 Millions | |
| Recent Price: 1.80 Market Intelligence Score: 100 | |
| Day Percent Change: 4.34% Day Change: 0.07 | |
| Week Change: 11.42% Year-to-date Change: -41.8% | |
| PMVP Links: Profile News Message Board | |
| Charts:- Daily , Weekly | |
| Add PMVP to Watchlist: View: Get Complete PMVP Trend Analysis ➞ | |
 | ERAS Erasca, Inc. |
| Sector: Health Care | |
| SubSector: Biotechnology | |
| MarketCap: 419 Millions | |
| Recent Price: 1.93 Market Intelligence Score: 68 | |
| Day Percent Change: 4.32% Day Change: 0.08 | |
| Week Change: 7.82% Year-to-date Change: -9.4% | |
| ERAS Links: Profile News Message Board | |
| Charts:- Daily , Weekly | |
| Add ERAS to Watchlist: View: Get Complete ERAS Trend Analysis ➞ | |
 | MIST Milestone Pharmaceuticals Inc. |
| Sector: Health Care | |
| SubSector: Biotechnology | |
| MarketCap: 342.685 Millions | |
| Recent Price: 1.70 Market Intelligence Score: 68 | |
| Day Percent Change: 4.29% Day Change: 0.07 | |
| Week Change: 3.66% Year-to-date Change: 1.8% | |
| MIST Links: Profile News Message Board | |
| Charts:- Daily , Weekly | |
| Add MIST to Watchlist: View: Get Complete MIST Trend Analysis ➞ | |
 | CDMO Avid Bioservices, Inc. |
| Sector: Health Care | |
| SubSector: Biotechnology | |
| MarketCap: 203.685 Millions | |
| Recent Price: 6.68 Market Intelligence Score: 62 | |
| Day Percent Change: 4.21% Day Change: 0.27 | |
| Week Change: 4.21% Year-to-date Change: 2.8% | |
| CDMO Links: Profile News Message Board | |
| Charts:- Daily , Weekly | |
| Add CDMO to Watchlist: View: Get Complete CDMO Trend Analysis ➞ | |
 | BTAI BioXcel Therapeutics, Inc. |
| Sector: Health Care | |
| SubSector: Biotechnology | |
| MarketCap: 487.485 Millions | |
| Recent Price: 2.97 Market Intelligence Score: 69 | |
| Day Percent Change: 4.21% Day Change: 0.12 | |
| Week Change: 7.22% Year-to-date Change: 0.7% | |
| BTAI Links: Profile News Message Board | |
| Charts:- Daily , Weekly | |
| Add BTAI to Watchlist: View: Get Complete BTAI Trend Analysis ➞ | |
 | RNA Avidity Biosciences, Inc. |
| Sector: Health Care | |
| SubSector: Biotechnology | |
| MarketCap: 12287 Millions | |
| Recent Price: 25.14 Market Intelligence Score: 90 | |
| Day Percent Change: 4.06% Day Change: 0.98 | |
| Week Change: 9.64% Year-to-date Change: 178.1% | |
| RNA Links: Profile News Message Board | |
| Charts:- Daily , Weekly | |
| Add RNA to Watchlist: View: Get Complete RNA Trend Analysis ➞ | |
 | NRIX Nurix Therapeutics, Inc. |
| Sector: Health Care | |
| SubSector: Biotechnology | |
| MarketCap: 16787 Millions | |
| Recent Price: 14.13 Market Intelligence Score: 68 | |
| Day Percent Change: 4.05% Day Change: 0.55 | |
| Week Change: -0.25% Year-to-date Change: 36.8% | |
| NRIX Links: Profile News Message Board | |
| Charts:- Daily , Weekly | |
| Add NRIX to Watchlist: View: Get Complete NRIX Trend Analysis ➞ | |
 | GNLX Genelux Corporation |
| Sector: Health Care | |
| SubSector: Biotechnology | |
| MarketCap: 820 Millions | |
| Recent Price: 3.48 Market Intelligence Score: 20 | |
| Day Percent Change: 4.03% Day Change: 0.13 | |
| Week Change: -15.62% Year-to-date Change: -77.1% | |
| GNLX Links: Profile News Message Board | |
| Charts:- Daily , Weekly | |
| Add GNLX to Watchlist: View: Get Complete GNLX Trend Analysis ➞ | |
 | PHVS Pharvaris N.V. |
| Sector: Health Care | |
| SubSector: Biotechnology | |
| MarketCap: 475 Millions | |
| Recent Price: 21.70 Market Intelligence Score: 42 | |
| Day Percent Change: 3.98% Day Change: 0.83 | |
| Week Change: 13.26% Year-to-date Change: -23.4% | |
| PHVS Links: Profile News Message Board | |
| Charts:- Daily , Weekly | |
| Add PHVS to Watchlist: View: Get Complete PHVS Trend Analysis ➞ | |
 | KYMR Kymera Therapeutics, Inc. |
| Sector: Health Care | |
| SubSector: Biotechnology | |
| MarketCap: 27087 Millions | |
| Recent Price: 35.71 Market Intelligence Score: 70 | |
| Day Percent Change: 3.96% Day Change: 1.36 | |
| Week Change: 3.09% Year-to-date Change: 40.5% | |
| KYMR Links: Profile News Message Board | |
| Charts:- Daily , Weekly | |
| Add KYMR to Watchlist: View: Get Complete KYMR Trend Analysis ➞ | |
 | IPHA Innate Pharma S.A. |
| Sector: Health Care | |
| SubSector: Biotechnology | |
| MarketCap: 309.485 Millions | |
| Recent Price: 2.37 Market Intelligence Score: 10 | |
| Day Percent Change: 3.95% Day Change: 0.09 | |
| Week Change: -4.44% Year-to-date Change: -15.4% | |
| IPHA Links: Profile News Message Board | |
| Charts:- Daily , Weekly | |
| Add IPHA to Watchlist: View: Get Complete IPHA Trend Analysis ➞ | |
 | RLYB Rallybio Corporation |
| Sector: Health Care | |
| SubSector: Biotechnology | |
| MarketCap: 226 Millions | |
| Recent Price: 1.84 Market Intelligence Score: 88 | |
| Day Percent Change: 3.95% Day Change: 0.07 | |
| Week Change: 4.55% Year-to-date Change: -22.0% | |
| RLYB Links: Profile News Message Board | |
| Charts:- Daily , Weekly | |
| Add RLYB to Watchlist: View: Get Complete RLYB Trend Analysis ➞ | |
 | VOR Vor Biopharma Inc. |
| Sector: Health Care | |
| SubSector: Biotechnology | |
| MarketCap: 224 Millions | |
| Recent Price: 1.89 Market Intelligence Score: 37 | |
| Day Percent Change: 3.85% Day Change: 0.07 | |
| Week Change: 10.53% Year-to-date Change: -14.9% | |
| VOR Links: Profile News Message Board | |
| Charts:- Daily , Weekly | |
| Add VOR to Watchlist: View: Get Complete VOR Trend Analysis ➞ | |
| To view more stocks, click on Next / Previous arrows or select different range: 0 - 25 , 25 - 50 , 50 - 75 , 75 - 100 , 100 - 125 , 125 - 150 , 150 - 175 , 175 - 200 , 200 - 225 , 225 - 250 , 250 - 275 , 275 - 300 , 300 - 325 , 325 - 350 , 350 - 375 , 375 - 400 | ||
| Click To Change The Sort Order: By Market Cap or Company Size Performance: Year-to-date, Week and Day | |
| Select Chart Type: | ||
|
Best Stocks Today 12Stocks.com |
© 2024 12Stocks.com Terms & Conditions Privacy Contact Us
All Information Provided Only For Education And Not To Be Used For Investing or Trading. See Terms & Conditions


One More Thing ... Get Best Stocks Delivered Daily!
Never Ever Miss A Move With Our Top Ten Stocks Lists
Find Best Stocks In Any Market - Bull or Bear Market
Take A Peek At Our Top Ten Stocks Lists: Daily, Weekly, Year-to-Date & Top Trends
Find Best Stocks In Any Market - Bull or Bear Market
Take A Peek At Our Top Ten Stocks Lists: Daily, Weekly, Year-to-Date & Top Trends
Biotech Stocks With Best Up Trends [0-bearish to 100-bullish]: Pieris [100], PureTech Health[100], Day One[100], Agios [100], Avadel [100], PMV [100], Annovis Bio[100], BioMarin [100], Mesoblast [95], Nektar [95], Moderna [95]
Best Biotech Stocks Year-to-Date:
Pieris [6493.41%], Precision [2702.74%], Inovio [1933.33%], Assembly [1518.1%], Adverum nologies[1361.21%], NuCana [1252.27%], Affimed N.V[756%], Agenus [680.29%], Corbus [524.83%], Mesoblast [445.45%], Janux [364.03%] Best Biotech Stocks This Week:
Pieris [8175.86%], Seres [35.74%], BeyondSpring [27.22%], ProKidney [24.75%], Agenus [21.66%], Annovis Bio[18.8%], Generation Bio[17.69%], Molecular Partners[16.87%], Adaptimmune [16.72%], Longboard [16.23%], Mesoblast [15.16%] Best Biotech Stocks Daily:
Pieris [8113.55%], Seres [21.68%], Generation Bio[16.01%], ChromaDex [14.86%], IGM [14.07%], Adaptimmune [12.87%], Agenus [11.96%], Galectin [10.64%], PureTech Health[10.55%], Personalis [9.52%], Esperion [9.42%]