
 Login Sign Up


| |||||
 |  | ||||

| 12Stocks.com Market Intelligence |
Best Biotech Stocks
|
|
| Quick Read: Best Biotech Stocks List By Performances & Trends: Daily, Weekly, Year-to-Date, Market Cap (Size) & Technical Trends | |||
| Best Biotech Stocks Views: Quick Browse View, Summary & Slide Show View | |||
| 12Stocks.com Biotech Stocks Performances & Trends Daily | |||||||||
|
|  The overall market intelligence score is 50 (0-bearish to 100-bullish) which puts Biotech sector in short term neutral trend. The market intelligence score from previous trading session is 49 and hence an improvement of trend.
| ||||||||
Here are the market intelligence trend scores of the most requested Biotech stocks at 12Stocks.com (click stock name for detailed review):
|


| 12Stocks.com: Investing in Biotech sector with Stocks | |
|
The following table helps investors and traders sort through current performance and trends (as measured by market intelligence score) of various
stocks in the Biotech sector. Quick View: Move mouse or cursor over stock symbol (ticker) to view short-term Technical chart and over stock name to view long term chart. Click on  to add stock symbol to your watchlist and to add stock symbol to your watchlist and  to view watchlist. Click on any ticker or stock name for detailed market intelligence report for that stock. to view watchlist. Click on any ticker or stock name for detailed market intelligence report for that stock. |
12Stocks.com Performance of Stocks in Biotech Sector
| Ticker | Stock Name | Watchlist | Category | Recent Price | Market Intelligence Score | Change % | YTD Change% |
| PRME | Prime Medicine |   | Biotechnology | 5.19 | 62 | -1.52 | -43.09% |
| CRON | Cronos | | Biotechnology | 2.67 | 73 | -1.66 | 27.51% |
| PTCT | PTC | | Biotechnology | 33.59 | 100 | -1.67 | 21.88% |
| VNDA | Vanda | | Biotechnology | 4.69 | 63 | -1.68 | 11.14% |
| TARA | ArTara | | Biotechnology | 2.88 | 17 | -1.71 | 53.59% |
| ALXO | ALX Oncology | | Biotechnology | 16.64 | 71 | -1.77 | 11.83% |
| SANA | Sana nology | | Biotechnology | 9.46 | 62 | -1.77 | 128.78% |
| ZNTL | Zentalis | | Biotechnology | 11.11 | 27 | -1.81 | -26.75% |
| AURA | Aura | | Biotechnology | 7.51 | 40 | -1.83 | -15.14% |
| AFMD | Affimed N.V | | Biotechnology | 5.25 | 53 | -1.87 | 740.00% |
| ANNX | Annexon | | Biotechnology | 4.66 | 24 | -1.89 | 2.19% |
| VIGL | Vigil Neuroscience | | Biotechnology | 2.60 | 28 | -1.89 | -24.34% |
| XOMA | XOMA | | Biotechnology | 25.33 | 54 | -1.90 | 36.92% |
| AKRO | Akero | | Biotechnology | 19.69 | 35 | -1.94 | -15.67% |
| CCCC | C4 | | Biotechnology | 6.41 | 32 | -1.99 | 13.65% |
| CGEM | Cullinan Oncology | | Biotechnology | 27.50 | 95 | -2.03 | 169.74% |
| MGNX | MacroGenics | | Biotechnology | 15.23 | 37 | -2.06 | 58.32% |
| ABCL | AbCellera Biologics | | Biotechnology | 3.70 | 15 | -2.12 | -34.51% |
| TYRA | Tyra | | Biotechnology | 17.90 | 62 | -2.16 | 34.25% |
| BCRX | BioCryst | | Biotechnology | 4.47 | 59 | -2.19 | -25.38% |
| TRDA | Entrada | | Biotechnology | 12.94 | 50 | -2.19 | -21.15% |
| ALLK | Allakos | | Biotechnology | 1.11 | 52 | -2.21 | -59.52% |
| NBIX | Neurocrine | | Biotechnology | 139.78 | 95 | -2.27 | 6.09% |
| IPSC | Century | | Biotechnology | 2.96 | 22 | -2.31 | -10.15% |
| CUE | Cue Biopharma | | Biotechnology | 1.86 | 69 | -2.36 | -29.55% |
| To view more stocks, click on Next / Previous arrows or select different range: 0 - 25 , 25 - 50 , 50 - 75 , 75 - 100 , 100 - 125 , 125 - 150 , 150 - 175 , 175 - 200 , 200 - 225 , 225 - 250 , 250 - 275 , 275 - 300 , 300 - 325 , 325 - 350 , 350 - 375 , 375 - 400 | ||
 | Click To Change The Sort Order: By Market Cap or Company Size Performance: Year-to-date, Week and Day |  |
|
Get the most comprehensive stock market coverage daily at 12Stocks.com ➞ Best Stocks Today ➞ Best Stocks Weekly ➞ Best Stocks Year-to-Date ➞ Best Stocks Trends ➞  Best Stocks Today 12Stocks.com Best Nasdaq Stocks ➞ Best S&P 500 Stocks ➞ Best Tech Stocks ➞ Best Biotech Stocks ➞ |
| Detailed Overview of Biotech Stocks |
| Biotech Technical Overview, Leaders & Laggards, Top Biotech ETF Funds & Detailed Biotech Stocks List, Charts, Trends & More |
| Biotech Sector: Technical Analysis, Trends & YTD Performance | |
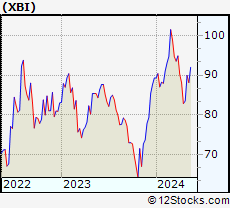
| Biotech sector, as represented by XBI, an exchange-traded fund [ETF] that holds basket of Biotech stocks (e.g, Amgen, Celgene) is down by -1.06% and is currently underperforming the overall market by -6.68% year-to-date. Below is a quick view of Technical charts and trends: | |
 XBI Weekly Chart |
|
| Long Term Trend: Not Good | |
| Medium Term Trend: Deteriorating | |
 XBI Daily Chart |
|
| Short Term Trend: Very Good | |
| Overall Trend Score: 50 | |
| YTD Performance: -1.06% | |
| **Trend Scores & Views Are Only For Educational Purposes And Not For Investing | |
| 12Stocks.com: Top Performing Biotech Sector Stocks | ||||||||||||||||||||||||||||||||||||||||||||||||
 The top performing Biotech sector stocks year to date are
Now, more recently, over last week, the top performing Biotech sector stocks on the move are


|
||||||||||||||||||||||||||||||||||||||||||||||||
| 12Stocks.com: Investing in Biotech Sector using Exchange Traded Funds | |
|
The following table shows list of key exchange traded funds (ETF) that
help investors track Biotech Index. For detailed view, check out our ETF Funds section of our website. Quick View: Move mouse or cursor over ETF symbol (ticker) to view short-term Technical chart and over ETF name to view long term chart. Click on ticker or stock name for detailed view. Click on to add stock symbol to your watchlist and to view watchlist. |
12Stocks.com List of ETFs that track Biotech Index
| Ticker | ETF Name | Watchlist | Recent Price | Market Intelligence Score | Change % | Week % | Year-to-date % |
| XBI | Biotech | | 88.34 | 50 | 1.16 | 5.81 | -1.06% |
| LABD | Biotech Bear 3X | | 8.76 | 44 | -2.99 | -16.73 | -9.6% |
| IBB | Biotechnology | | 130.64 | 64 | 0.89 | 3.28 | -3.84% |
| LABU | Biotech Bull 3X | | 102.99 | 42 | 3.19 | 17.69 | -15.56% |
| IYH | Healthcare | | 59.12 | 37 | -0.10 | 0.87 | 3.27% |
| IHF | Healthcare Providers | | 51.64 | 15 | 0.39 | -0.54 | -1.66% |
| IXJ | Global Healthcare | | 89.41 | 37 | -0.17 | 0.33 | 3.1% |
| CURE | Healthcare Bull 3X | | 105.11 | 40 | -1.36 | -0.19 | 3.31% |
| FBT | First NYSE | | 147.18 | 29 | 0.79 | 2.46 | -6.88% |
| BIB | Biotechnology | | 52.58 | 57 | 0.00 | 5.88 | -7.84% |
| PBE | Biotech & Genome | | 63.57 | 44 | 1.13 | 5.28 | -3.45% |
| PTH | DWA Healthcare Momentum | | 41.27 | 22 | 0.00 | 3.46 | 5.44% |
| BBH | Biotech | | 160.51 | 64 | 1.18 | 3.12 | -2.9% |
| BIS | Short Biotech | | 18.61 | 36 | -2.62 | -7.96 | 2.99% |
| BBC | Bio Biotechnology Clinical | | 27.15 | 42 | 0.20 | 6.35 | 11.03% |
| BTEC | Principal Healthcare Innovators | | 35.90 | 42 | 0.00 | 4.81 | -1.19% |
| BBP | Bio Biotechnology Products | | 54.35 | 45 | 0.00 | 5.56 | -6.45% |
| 12Stocks.com: Charts, Trends, Fundamental Data and Performances of Biotech Stocks | |
|
We now take in-depth look at all Biotech stocks including charts, multi-period performances and overall trends (as measured by market intelligence score). One can sort Biotech stocks (click link to choose) by Daily, Weekly and by Year-to-Date performances. Also, one can sort by size of the company or by market capitalization. |
| Select Your Default Chart Type: | |||||
| |||||
| Click on stock symbol or name for detailed view. Click on to add stock symbol to your watchlist and to view watchlist. Quick View: Move mouse or cursor over "Daily" to quickly view daily Technical stock chart and over "Weekly" to view weekly Technical stock chart. | |||||

 | PRME Prime Medicine, Inc. |
| Sector: Health Care | |
| SubSector: Biotechnology | |
| MarketCap: 1440 Millions | |
| Recent Price: 5.19 Market Intelligence Score: 62 | |
| Day Percent Change: -1.52% Day Change: -0.08 | |
| Week Change: 17.16% Year-to-date Change: -43.1% | |
| PRME Links: Profile News Message Board | |
| Charts:- Daily , Weekly | |
| Add PRME to Watchlist: View: Get Complete PRME Trend Analysis ➞ | |
 | CRON Cronos Group Inc. |
| Sector: Health Care | |
| SubSector: Biotechnology | |
| MarketCap: 1935.95 Millions | |
| Recent Price: 2.67 Market Intelligence Score: 73 | |
| Day Percent Change: -1.66% Day Change: -0.04 | |
| Week Change: 2.9% Year-to-date Change: 27.5% | |
| CRON Links: Profile News Message Board | |
| Charts:- Daily , Weekly | |
| Add CRON to Watchlist: View: Get Complete CRON Trend Analysis ➞ | |
 | PTCT PTC Therapeutics, Inc. |
| Sector: Health Care | |
| SubSector: Biotechnology | |
| MarketCap: 2795.85 Millions | |
| Recent Price: 33.59 Market Intelligence Score: 100 | |
| Day Percent Change: -1.67% Day Change: -0.57 | |
| Week Change: 17.57% Year-to-date Change: 21.9% | |
| PTCT Links: Profile News Message Board | |
| Charts:- Daily , Weekly | |
| Add PTCT to Watchlist: View: Get Complete PTCT Trend Analysis ➞ | |
 | VNDA Vanda Pharmaceuticals Inc. |
| Sector: Health Care | |
| SubSector: Biotechnology | |
| MarketCap: 464.585 Millions | |
| Recent Price: 4.69 Market Intelligence Score: 63 | |
| Day Percent Change: -1.68% Day Change: -0.08 | |
| Week Change: 1.52% Year-to-date Change: 11.1% | |
| VNDA Links: Profile News Message Board | |
| Charts:- Daily , Weekly | |
| Add VNDA to Watchlist: View: Get Complete VNDA Trend Analysis ➞ | |
 | TARA ArTara Therapeutics, Inc. |
| Sector: Health Care | |
| SubSector: Biotechnology | |
| MarketCap: 140.685 Millions | |
| Recent Price: 2.88 Market Intelligence Score: 17 | |
| Day Percent Change: -1.71% Day Change: -0.05 | |
| Week Change: -1.54% Year-to-date Change: 53.6% | |
| TARA Links: Profile News Message Board | |
| Charts:- Daily , Weekly | |
| Add TARA to Watchlist: View: Get Complete TARA Trend Analysis ➞ | |
 | ALXO ALX Oncology Holdings Inc. |
| Sector: Health Care | |
| SubSector: Biotechnology | |
| MarketCap: 41787 Millions | |
| Recent Price: 16.64 Market Intelligence Score: 71 | |
| Day Percent Change: -1.77% Day Change: -0.30 | |
| Week Change: -1.3% Year-to-date Change: 11.8% | |
| ALXO Links: Profile News Message Board | |
| Charts:- Daily , Weekly | |
| Add ALXO to Watchlist: View: Get Complete ALXO Trend Analysis ➞ | |
 | SANA Sana Biotechnology, Inc. |
| Sector: Health Care | |
| SubSector: Biotechnology | |
| MarketCap: 1210 Millions | |
| Recent Price: 9.46 Market Intelligence Score: 62 | |
| Day Percent Change: -1.77% Day Change: -0.17 | |
| Week Change: 8.61% Year-to-date Change: 128.8% | |
| SANA Links: Profile News Message Board | |
| Charts:- Daily , Weekly | |
| Add SANA to Watchlist: View: Get Complete SANA Trend Analysis ➞ | |
 | ZNTL Zentalis Pharmaceuticals, Inc. |
| Sector: Health Care | |
| SubSector: Biotechnology | |
| MarketCap: 22187 Millions | |
| Recent Price: 11.11 Market Intelligence Score: 27 | |
| Day Percent Change: -1.81% Day Change: -0.21 | |
| Week Change: 0.41% Year-to-date Change: -26.8% | |
| ZNTL Links: Profile News Message Board | |
| Charts:- Daily , Weekly | |
| Add ZNTL to Watchlist: View: Get Complete ZNTL Trend Analysis ➞ | |
 | AURA Aura Biosciences, Inc. |
| Sector: Health Care | |
| SubSector: Biotechnology | |
| MarketCap: 469 Millions | |
| Recent Price: 7.51 Market Intelligence Score: 40 | |
| Day Percent Change: -1.83% Day Change: -0.14 | |
| Week Change: 4.02% Year-to-date Change: -15.1% | |
| AURA Links: Profile News Message Board | |
| Charts:- Daily , Weekly | |
| Add AURA to Watchlist: View: Get Complete AURA Trend Analysis ➞ | |
 | AFMD Affimed N.V. |
| Sector: Health Care | |
| SubSector: Biotechnology | |
| MarketCap: 161.385 Millions | |
| Recent Price: 5.25 Market Intelligence Score: 53 | |
| Day Percent Change: -1.87% Day Change: -0.10 | |
| Week Change: 4.37% Year-to-date Change: 740.0% | |
| AFMD Links: Profile News Message Board | |
| Charts:- Daily , Weekly | |
| Add AFMD to Watchlist: View: Get Complete AFMD Trend Analysis ➞ | |
 | ANNX Annexon, Inc. |
| Sector: Health Care | |
| SubSector: Biotechnology | |
| MarketCap: 94487 Millions | |
| Recent Price: 4.66 Market Intelligence Score: 24 | |
| Day Percent Change: -1.89% Day Change: -0.09 | |
| Week Change: -0.85% Year-to-date Change: 2.2% | |
| ANNX Links: Profile News Message Board | |
| Charts:- Daily , Weekly | |
| Add ANNX to Watchlist: View: Get Complete ANNX Trend Analysis ➞ | |
 | VIGL Vigil Neuroscience, Inc. |
| Sector: Health Care | |
| SubSector: Biotechnology | |
| MarketCap: 339 Millions | |
| Recent Price: 2.60 Market Intelligence Score: 28 | |
| Day Percent Change: -1.89% Day Change: -0.05 | |
| Week Change: -4.24% Year-to-date Change: -24.3% | |
| VIGL Links: Profile News Message Board | |
| Charts:- Daily , Weekly | |
| Add VIGL to Watchlist: View: Get Complete VIGL Trend Analysis ➞ | |
 | XOMA XOMA Corporation |
| Sector: Health Care | |
| SubSector: Biotechnology | |
| MarketCap: 174.885 Millions | |
| Recent Price: 25.33 Market Intelligence Score: 54 | |
| Day Percent Change: -1.90% Day Change: -0.49 | |
| Week Change: -0.31% Year-to-date Change: 36.9% | |
| XOMA Links: Profile News Message Board | |
| Charts:- Daily , Weekly | |
| Add XOMA to Watchlist: View: Get Complete XOMA Trend Analysis ➞ | |
 | AKRO Akero Therapeutics, Inc. |
| Sector: Health Care | |
| SubSector: Biotechnology | |
| MarketCap: 675.085 Millions | |
| Recent Price: 19.69 Market Intelligence Score: 35 | |
| Day Percent Change: -1.94% Day Change: -0.39 | |
| Week Change: -0.25% Year-to-date Change: -15.7% | |
| AKRO Links: Profile News Message Board | |
| Charts:- Daily , Weekly | |
| Add AKRO to Watchlist: View: Get Complete AKRO Trend Analysis ➞ | |
 | CCCC C4 Therapeutics, Inc. |
| Sector: Health Care | |
| SubSector: Biotechnology | |
| MarketCap: 12587 Millions | |
| Recent Price: 6.41 Market Intelligence Score: 32 | |
| Day Percent Change: -1.99% Day Change: -0.13 | |
| Week Change: 3.89% Year-to-date Change: 13.7% | |
| CCCC Links: Profile News Message Board | |
| Charts:- Daily , Weekly | |
| Add CCCC to Watchlist: View: Get Complete CCCC Trend Analysis ➞ | |
 | CGEM Cullinan Oncology, Inc. |
| Sector: Health Care | |
| SubSector: Biotechnology | |
| MarketCap: 433 Millions | |
| Recent Price: 27.50 Market Intelligence Score: 95 | |
| Day Percent Change: -2.03% Day Change: -0.57 | |
| Week Change: 8.7% Year-to-date Change: 169.7% | |
| CGEM Links: Profile News Message Board | |
| Charts:- Daily , Weekly | |
| Add CGEM to Watchlist: View: Get Complete CGEM Trend Analysis ➞ | |
 | MGNX MacroGenics, Inc. |
| Sector: Health Care | |
| SubSector: Biotechnology | |
| MarketCap: 262.785 Millions | |
| Recent Price: 15.23 Market Intelligence Score: 37 | |
| Day Percent Change: -2.06% Day Change: -0.32 | |
| Week Change: 4.6% Year-to-date Change: 58.3% | |
| MGNX Links: Profile News Message Board | |
| Charts:- Daily , Weekly | |
| Add MGNX to Watchlist: View: Get Complete MGNX Trend Analysis ➞ | |
 | ABCL AbCellera Biologics Inc. |
| Sector: Health Care | |
| SubSector: Biotechnology | |
| MarketCap: 1870 Millions | |
| Recent Price: 3.70 Market Intelligence Score: 15 | |
| Day Percent Change: -2.12% Day Change: -0.08 | |
| Week Change: -1.6% Year-to-date Change: -34.5% | |
| ABCL Links: Profile News Message Board | |
| Charts:- Daily , Weekly | |
| Add ABCL to Watchlist: View: Get Complete ABCL Trend Analysis ➞ | |
 | TYRA Tyra Biosciences, Inc. |
| Sector: Health Care | |
| SubSector: Biotechnology | |
| MarketCap: 732 Millions | |
| Recent Price: 17.90 Market Intelligence Score: 62 | |
| Day Percent Change: -2.16% Day Change: -0.39 | |
| Week Change: 14.2% Year-to-date Change: 34.3% | |
| TYRA Links: Profile News Message Board | |
| Charts:- Daily , Weekly | |
| Add TYRA to Watchlist: View: Get Complete TYRA Trend Analysis ➞ | |
 | BCRX BioCryst Pharmaceuticals, Inc. |
| Sector: Health Care | |
| SubSector: Biotechnology | |
| MarketCap: 369.385 Millions | |
| Recent Price: 4.47 Market Intelligence Score: 59 | |
| Day Percent Change: -2.19% Day Change: -0.10 | |
| Week Change: 7.45% Year-to-date Change: -25.4% | |
| BCRX Links: Profile News Message Board | |
| Charts:- Daily , Weekly | |
| Add BCRX to Watchlist: View: Get Complete BCRX Trend Analysis ➞ | |
 | TRDA Entrada Therapeutics, Inc. |
| Sector: Health Care | |
| SubSector: Biotechnology | |
| MarketCap: 481 Millions | |
| Recent Price: 12.94 Market Intelligence Score: 50 | |
| Day Percent Change: -2.19% Day Change: -0.29 | |
| Week Change: 3.94% Year-to-date Change: -21.2% | |
| TRDA Links: Profile News Message Board | |
| Charts:- Daily , Weekly | |
| Add TRDA to Watchlist: View: Get Complete TRDA Trend Analysis ➞ | |
 | ALLK Allakos Inc. |
| Sector: Health Care | |
| SubSector: Biotechnology | |
| MarketCap: 3233.55 Millions | |
| Recent Price: 1.11 Market Intelligence Score: 52 | |
| Day Percent Change: -2.21% Day Change: -0.02 | |
| Week Change: 8.33% Year-to-date Change: -59.5% | |
| ALLK Links: Profile News Message Board | |
| Charts:- Daily , Weekly | |
| Add ALLK to Watchlist: View: Get Complete ALLK Trend Analysis ➞ | |
 | NBIX Neurocrine Biosciences, Inc. |
| Sector: Health Care | |
| SubSector: Biotechnology | |
| MarketCap: 7897.85 Millions | |
| Recent Price: 139.78 Market Intelligence Score: 95 | |
| Day Percent Change: -2.27% Day Change: -3.25 | |
| Week Change: 2.79% Year-to-date Change: 6.1% | |
| NBIX Links: Profile News Message Board | |
| Charts:- Daily , Weekly | |
| Add NBIX to Watchlist: View: Get Complete NBIX Trend Analysis ➞ | |
 | IPSC Century Therapeutics, Inc. |
| Sector: Health Care | |
| SubSector: Biotechnology | |
| MarketCap: 187 Millions | |
| Recent Price: 2.96 Market Intelligence Score: 22 | |
| Day Percent Change: -2.31% Day Change: -0.07 | |
| Week Change: 2.95% Year-to-date Change: -10.2% | |
| IPSC Links: Profile News Message Board | |
| Charts:- Daily , Weekly | |
| Add IPSC to Watchlist: View: Get Complete IPSC Trend Analysis ➞ | |
 | CUE Cue Biopharma, Inc. |
| Sector: Health Care | |
| SubSector: Biotechnology | |
| MarketCap: 352.785 Millions | |
| Recent Price: 1.86 Market Intelligence Score: 69 | |
| Day Percent Change: -2.36% Day Change: -0.04 | |
| Week Change: 36.26% Year-to-date Change: -29.6% | |
| CUE Links: Profile News Message Board | |
| Charts:- Daily , Weekly | |
| Add CUE to Watchlist: View: Get Complete CUE Trend Analysis ➞ | |
| To view more stocks, click on Next / Previous arrows or select different range: 0 - 25 , 25 - 50 , 50 - 75 , 75 - 100 , 100 - 125 , 125 - 150 , 150 - 175 , 175 - 200 , 200 - 225 , 225 - 250 , 250 - 275 , 275 - 300 , 300 - 325 , 325 - 350 , 350 - 375 , 375 - 400 | ||
| Click To Change The Sort Order: By Market Cap or Company Size Performance: Year-to-date, Week and Day | |
| Select Chart Type: | ||
|
Best Stocks Today 12Stocks.com |
© 2024 12Stocks.com Terms & Conditions Privacy Contact Us
All Information Provided Only For Education And Not To Be Used For Investing or Trading. See Terms & Conditions


One More Thing ... Get Best Stocks Delivered Daily!
Never Ever Miss A Move With Our Top Ten Stocks Lists
Find Best Stocks In Any Market - Bull or Bear Market
Take A Peek At Our Top Ten Stocks Lists: Daily, Weekly, Year-to-Date & Top Trends
Find Best Stocks In Any Market - Bull or Bear Market
Take A Peek At Our Top Ten Stocks Lists: Daily, Weekly, Year-to-Date & Top Trends
Biotech Stocks With Best Up Trends [0-bearish to 100-bullish]: Emergent Bio[100], Blueprint Medicines[100], Corcept [100], Anika [100], Bio-Techne [100], Agios [100], Reneo [100], United [100], Mesoblast [100], AnaptysBio [100], Revolution Medicines[100]
Best Biotech Stocks Year-to-Date:
Pieris [6064.83%], Avenue [2924.84%], Precision [2842.47%], Inovio [2249.02%], Assembly [1493.71%], Agenus [1414.68%], NuCana [1245.5%], Adverum nologies[1228.37%], Affimed N.V[740%], Mesoblast [562.73%], Corbus [533.61%] Best Biotech Stocks This Week:
CytomX [182.08%], Deciphera [73.17%], Emergent Bio[71.88%], Cue Biopharma[36.26%], Seres [33.33%], Poseida [31.22%], Exscientia [26.77%], Personalis [26.48%], Wave Life[26.18%], Nektar [26.14%], Codexis [25.56%] Best Biotech Stocks Daily:
Emergent Bio[70.98%], Orchestra BioMed[18.83%], Ocular Therapeutix[16.53%], Cellectis S.A[14.75%], Blueprint Medicines[12.75%], Moderna [12.70%], Mustang Bio[12.65%], Black Diamond[11.53%], EyePoint [10.53%], iBio [9.73%], Omeros [9.71%]