 | GLSI Greenwich LifeSciences, Inc. |
| Sector: Health Care |
| SubSector: Biotechnology |
| MarketCap: 86487 Millions |
Recent Price: 13.01
Market Intelligence Score: 36 |
Day Percent Change: -0.84%
Day Change: -0.11 |
Week Change: -16.87%
Year-to-date Change: 22.7% |
| GLSI Links: Profile News Message Board | |||||||||||||
| Charts:- Daily , Weekly |
Add GLSI to Watchlist:  View: View:  Get Complete GLSI Trend Analysis ➞ Get Complete GLSI Trend Analysis ➞ |
|
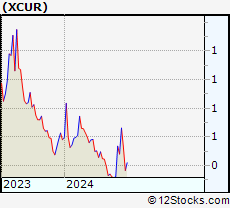 | XCUR Exicure, Inc. |
| Sector: Health Care |
| SubSector: Biotechnology |
| MarketCap: 113.785 Millions |
Recent Price: 0.58
Market Intelligence Score: 53 |
Day Percent Change: -0.86%
Day Change: -0.01 |
Week Change: -0.21%
Year-to-date Change: -0.3% |
| XCUR Links: Profile News Message Board | |||||||||||||
| Charts:- Daily , Weekly |
| Add XCUR to Watchlist: View: Get Complete XCUR Trend Analysis ➞ |
|
 | ITOS iTeos Therapeutics, Inc. |
| Sector: Health Care |
| SubSector: Biotechnology |
| MarketCap: 10487 Millions |
Recent Price: 10.24
Market Intelligence Score: 36 |
Day Percent Change: -0.87%
Day Change: -0.09 |
Week Change: -12.59%
Year-to-date Change: -6.4% |
| ITOS Links: Profile News Message Board | |||||||||||||
| Charts:- Daily , Weekly |
| Add ITOS to Watchlist: View: Get Complete ITOS Trend Analysis ➞ |
|
 | KROS Keros Therapeutics, Inc. |
| Sector: Health Care |
| SubSector: Biotechnology |
| MarketCap: 17887 Millions |
Recent Price: 58.56
Market Intelligence Score: 56 |
Day Percent Change: -0.88%
Day Change: -0.52 |
Week Change: -0.09%
Year-to-date Change: 47.0% |
| KROS Links: Profile News Message Board | |||||||||||||
| Charts:- Daily , Weekly |
| Add KROS to Watchlist: View: Get Complete KROS Trend Analysis ➞ |
|
 | APLS Apellis Pharmaceuticals, Inc. |
| Sector: Health Care |
| SubSector: Biotechnology |
| MarketCap: 2030.95 Millions |
Recent Price: 47.09
Market Intelligence Score: 0 |
Day Percent Change: -0.89%
Day Change: -0.42 |
Week Change: -9.08%
Year-to-date Change: -21.3% |
| APLS Links: Profile News Message Board | |||||||||||||
| Charts:- Daily , Weekly |
| Add APLS to Watchlist: View: Get Complete APLS Trend Analysis ➞ |
|
 | RCKT Rocket Pharmaceuticals, Inc. |
| Sector: Health Care |
| SubSector: Biotechnology |
| MarketCap: 899.585 Millions |
Recent Price: 23.27
Market Intelligence Score: 10 |
Day Percent Change: -0.92%
Day Change: -0.21 |
Week Change: -3.82%
Year-to-date Change: -22.4% |
| RCKT Links: Profile News Message Board | |||||||||||||
| Charts:- Daily , Weekly |
| Add RCKT to Watchlist: View: Get Complete RCKT Trend Analysis ➞ |
|
 | VRCA Verrica Pharmaceuticals Inc. |
| Sector: Health Care |
| SubSector: Biotechnology |
| MarketCap: 289.585 Millions |
Recent Price: 6.84
Market Intelligence Score: 61 |
Day Percent Change: -0.94%
Day Change: -0.07 |
Week Change: -0.36%
Year-to-date Change: -6.5% |
| VRCA Links: Profile News Message Board | |||||||||||||
| Charts:- Daily , Weekly |
| Add VRCA to Watchlist: View: Get Complete VRCA Trend Analysis ➞ |
|
 | NAMS NewAmsterdam Pharma Company N.V. |
| Sector: Health Care |
| SubSector: Biotechnology |
| MarketCap: 979 Millions |
Recent Price: 19.92
Market Intelligence Score: 30 |
Day Percent Change: -0.94%
Day Change: -0.19 |
Week Change: 1.12%
Year-to-date Change: 77.2% |
| NAMS Links: Profile News Message Board | |||||||||||||
| Charts:- Daily , Weekly |
| Add NAMS to Watchlist: View: Get Complete NAMS Trend Analysis ➞ |
|
 | CYTK Cytokinetics, Incorporated |
| Sector: Health Care |
| SubSector: Biotechnology |
| MarketCap: 654.285 Millions |
Recent Price: 66.36
Market Intelligence Score: 0 |
Day Percent Change: -0.95%
Day Change: -0.64 |
Week Change: -7.26%
Year-to-date Change: -20.5% |
| CYTK Links: Profile News Message Board | |||||||||||||
| Charts:- Daily , Weekly |
| Add CYTK to Watchlist: View: Get Complete CYTK Trend Analysis ➞ |
|
 | BBIO BridgeBio Pharma, Inc. |
| Sector: Health Care |
| SubSector: Biotechnology |
| MarketCap: 3879.35 Millions |
Recent Price: 24.71
Market Intelligence Score: 10 |
Day Percent Change: -0.96%
Day Change: -0.24 |
Week Change: -7.9%
Year-to-date Change: -38.8% |
| BBIO Links: Profile News Message Board | |||||||||||||
| Charts:- Daily , Weekly |
| Add BBIO to Watchlist: View: Get Complete BBIO Trend Analysis ➞ |
|
 | FULC Fulcrum Therapeutics, Inc. |
| Sector: Health Care |
| SubSector: Biotechnology |
| MarketCap: 274.785 Millions |
Recent Price: 6.99
Market Intelligence Score: 10 |
Day Percent Change: -0.99%
Day Change: -0.07 |
Week Change: -10.5%
Year-to-date Change: 3.6% |
| FULC Links: Profile News Message Board | |||||||||||||
| Charts:- Daily , Weekly |
| Add FULC to Watchlist: View: Get Complete FULC Trend Analysis ➞ |
|
 | OCS Oculis Holding AG |
| Sector: Health Care |
| SubSector: Biotechnology |
| MarketCap: 460 Millions |
Recent Price: 11.78
Market Intelligence Score: 0 |
Day Percent Change: -1.01%
Day Change: -0.12 |
Week Change: -1.46%
Year-to-date Change: 6.1% |
| OCS Links: Profile News Message Board | |||||||||||||
| Charts:- Daily , Weekly |
| Add OCS to Watchlist: View: Get Complete OCS Trend Analysis ➞ |
|
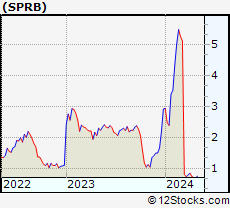 | SPRB Spruce Biosciences, Inc. |
| Sector: Health Care |
| SubSector: Biotechnology |
| MarketCap: 49487 Millions |
Recent Price: 0.70
Market Intelligence Score: 30 |
Day Percent Change: -1.06%
Day Change: -0.01 |
Week Change: -5.07%
Year-to-date Change: -76.1% |
| SPRB Links: Profile News Message Board | |||||||||||||
| Charts:- Daily , Weekly |
| Add SPRB to Watchlist: View: Get Complete SPRB Trend Analysis ➞ |
|
 | JANX Janux Therapeutics, Inc. |
| Sector: Health Care |
| SubSector: Biotechnology |
| MarketCap: 496 Millions |
Recent Price: 47.64
Market Intelligence Score: 51 |
Day Percent Change: -1.06%
Day Change: -0.51 |
Week Change: -9.52%
Year-to-date Change: 343.4% |
| JANX Links: Profile News Message Board | |||||||||||||
| Charts:- Daily , Weekly |
| Add JANX to Watchlist: View: Get Complete JANX Trend Analysis ➞ |
|
 | BMRN BioMarin Pharmaceutical Inc. |
| Sector: Health Care |
| SubSector: Biotechnology |
| MarketCap: 14887.5 Millions |
Recent Price: 89.11
Market Intelligence Score: 68 |
Day Percent Change: -1.07%
Day Change: -0.96 |
Week Change: -3.37%
Year-to-date Change: -7.6% |
| BMRN Links: Profile News Message Board | |||||||||||||
| Charts:- Daily , Weekly |
| Add BMRN to Watchlist: View: Get Complete BMRN Trend Analysis ➞ |
|
 | BGNE BeiGene, Ltd. |
| Sector: Health Care |
| SubSector: Biotechnology |
| MarketCap: 10838.5 Millions |
Recent Price: 130.55
Market Intelligence Score: 10 |
Day Percent Change: -1.07%
Day Change: -1.41 |
Week Change: -7.61%
Year-to-date Change: -27.6% |
| BGNE Links: Profile News Message Board | |||||||||||||
| Charts:- Daily , Weekly |
| Add BGNE to Watchlist: View: Get Complete BGNE Trend Analysis ➞ |
|
 | ROIV Roivant Sciences Ltd. |
| Sector: Health Care |
| SubSector: Biotechnology |
| MarketCap: 7780 Millions |
Recent Price: 10.34
Market Intelligence Score: 26 |
Day Percent Change: -1.10%
Day Change: -0.11 |
Week Change: -5.53%
Year-to-date Change: -6.9% |
| ROIV Links: Profile News Message Board | |||||||||||||
| Charts:- Daily , Weekly |
| Add ROIV to Watchlist: View: Get Complete ROIV Trend Analysis ➞ |
|
 | RGNX REGENXBIO Inc. |
| Sector: Health Care |
| SubSector: Biotechnology |
| MarketCap: 1232.85 Millions |
Recent Price: 15.93
Market Intelligence Score: 36 |
Day Percent Change: -1.12%
Day Change: -0.18 |
Week Change: -11.94%
Year-to-date Change: -11.3% |
| RGNX Links: Profile News Message Board | |||||||||||||
| Charts:- Daily , Weekly |
| Add RGNX to Watchlist: View: Get Complete RGNX Trend Analysis ➞ |
|
 | DRTS Alpha Tau Medical Ltd. |
| Sector: Health Care |
| SubSector: Biotechnology |
| MarketCap: 300 Millions |
Recent Price: 2.66
Market Intelligence Score: 15 |
Day Percent Change: -1.12%
Day Change: -0.03 |
Week Change: -5.67%
Year-to-date Change: -11.0% |
| DRTS Links: Profile News Message Board | |||||||||||||
| Charts:- Daily , Weekly |
| Add DRTS to Watchlist: View: Get Complete DRTS Trend Analysis ➞ |
|
 | RPHM Reneo Pharmaceuticals, Inc. |
| Sector: Health Care |
| SubSector: Biotechnology |
| MarketCap: 233 Millions |
Recent Price: 1.74
Market Intelligence Score: 86 |
Day Percent Change: -1.14%
Day Change: -0.02 |
Week Change: 0.58%
Year-to-date Change: 7.4% |
| RPHM Links: Profile News Message Board | |||||||||||||
| Charts:- Daily , Weekly |
| Add RPHM to Watchlist: View: Get Complete RPHM Trend Analysis ➞ |
|
 | GTHX G1 Therapeutics, Inc. |
| Sector: Health Care |
| SubSector: Biotechnology |
| MarketCap: 484.085 Millions |
Recent Price: 4.12
Market Intelligence Score: 44 |
Day Percent Change: -1.20%
Day Change: -0.05 |
Week Change: -9.45%
Year-to-date Change: 35.1% |
| GTHX Links: Profile News Message Board | |||||||||||||
| Charts:- Daily , Weekly |
| Add GTHX to Watchlist: View: Get Complete GTHX Trend Analysis ➞ |
|
 | DNLI Denali Therapeutics Inc. |
| Sector: Health Care |
| SubSector: Biotechnology |
| MarketCap: 2020.05 Millions |
Recent Price: 16.40
Market Intelligence Score: 36 |
Day Percent Change: -1.20%
Day Change: -0.20 |
Week Change: -10.19%
Year-to-date Change: -23.6% |
| DNLI Links: Profile News Message Board | |||||||||||||
| Charts:- Daily , Weekly |
| Add DNLI to Watchlist: View: Get Complete DNLI Trend Analysis ➞ |
|
 | AVRO AVROBIO, Inc. |
| Sector: Health Care |
| SubSector: Biotechnology |
| MarketCap: 626.185 Millions |
Recent Price: 1.23
Market Intelligence Score: 10 |
Day Percent Change: -1.21%
Day Change: -0.01 |
Week Change: -3.54%
Year-to-date Change: -9.9% |
| AVRO Links: Profile News Message Board | |||||||||||||
| Charts:- Daily , Weekly |
| Add AVRO to Watchlist: View: Get Complete AVRO Trend Analysis ➞ |
|
 | LGND Ligand Pharmaceuticals Incorporated |
| Sector: Health Care |
| SubSector: Biotechnology |
| MarketCap: 1344.45 Millions |
Recent Price: 71.55
Market Intelligence Score: 10 |
Day Percent Change: -1.34%
Day Change: -0.97 |
Week Change: -12.06%
Year-to-date Change: 0.2% |
| LGND Links: Profile News Message Board | |||||||||||||
| Charts:- Daily , Weekly |
| Add LGND to Watchlist: View: Get Complete LGND Trend Analysis ➞ |
|
 | RLMD Relmada Therapeutics, Inc. |
| Sector: Health Care |
| SubSector: Biotechnology |
| MarketCap: 499.685 Millions |
Recent Price: 4.24
Market Intelligence Score: 36 |
Day Percent Change: -1.40%
Day Change: -0.06 |
Week Change: -8.82%
Year-to-date Change: 2.4% |
| RLMD Links: Profile News Message Board | |||||||||||||
| Charts:- Daily , Weekly |
| Add RLMD to Watchlist: View: Get Complete RLMD Trend Analysis ➞ |
|

 Login Sign Up


 to add stock symbol to your watchlist and
  to view watchlist.


