
 Login Sign Up


| |||||
 |  | ||||

| 12Stocks.com Market Intelligence |
Best Biotech Stocks
|
|
| Quick Read: Best Biotech Stocks List By Performances & Trends: Daily, Weekly, Year-to-Date, Market Cap (Size) & Technical Trends | |||
| Best Biotech Stocks Views: Quick Browse View, Summary & Slide Show View | |||
| 12Stocks.com Biotech Stocks Performances & Trends Daily | |||||||||
|
|  The overall market intelligence score is 25 (0-bearish to 100-bullish) which puts Biotech sector in short term bearish to neutral trend. The market intelligence score from previous trading session is 32 and a deterioration of trend continues.
| ||||||||
Here are the market intelligence trend scores of the most requested Biotech stocks at 12Stocks.com (click stock name for detailed review):
|


| 12Stocks.com: Investing in Biotech sector with Stocks | |
|
The following table helps investors and traders sort through current performance and trends (as measured by market intelligence score) of various
stocks in the Biotech sector. Quick View: Move mouse or cursor over stock symbol (ticker) to view short-term Technical chart and over stock name to view long term chart. Click on  to add stock symbol to your watchlist and to add stock symbol to your watchlist and  to view watchlist. Click on any ticker or stock name for detailed market intelligence report for that stock. to view watchlist. Click on any ticker or stock name for detailed market intelligence report for that stock. |
12Stocks.com Performance of Stocks in Biotech Sector
| Ticker | Stock Name | Watchlist | Category | Recent Price | Market Intelligence Score | Change % | YTD Change% |
| ARQT | Arcutis Bio |   | Biotechnology | 8.61 | 46 | -1.60 | 166.56% |
| ALVR | AlloVir | | Biotechnology | 0.77 | 88 | -1.61 | 13.29% |
| BPMC | Blueprint Medicines | | Biotechnology | 90.73 | 81 | -1.66 | -1.64% |
| PCVX | Vaxcyte | | Biotechnology | 59.25 | 18 | -1.66 | -5.61% |
| LBPH | Longboard | | Biotechnology | 19.43 | 62 | -1.67 | 218.00% |
| ACAD | ACADIA | | Biotechnology | 16.31 | 10 | -1.69 | -47.91% |
| HALO | Halozyme | | Biotechnology | 38.46 | 68 | -1.69 | 4.06% |
| PSTX | Poseida | | Biotechnology | 2.03 | 25 | -1.69 | -39.67% |
| CERT | Certara | | Biotechnology | 16.16 | 33 | -1.70 | -8.21% |
| ARGX | argenx SE | | Biotechnology | 368.55 | 20 | -1.72 | -3.12% |
| STRO | Sutro Biopharma | | Biotechnology | 3.41 | 20 | -1.73 | -20.51% |
| REGN | Regeneron | | Biotechnology | 890.68 | 10 | -1.75 | 1.41% |
| VNDA | Vanda | | Biotechnology | 4.48 | 43 | -1.75 | 6.16% |
| TARS | Tarsus | | Biotechnology | 32.17 | 49 | -1.83 | 58.63% |
| CTMX | CytomX | | Biotechnology | 1.60 | 44 | -1.84 | 3.23% |
| ADAP | Adaptimmune | | Biotechnology | 1.06 | 56 | -1.85 | 33.67% |
| FULC | Fulcrum | | Biotechnology | 7.14 | 38 | -1.85 | 5.85% |
| ARDX | Ardelyx | | Biotechnology | 6.31 | 18 | -1.87 | 1.77% |
| VRCA | Verrica | | Biotechnology | 6.66 | 49 | -1.91 | -9.02% |
| CRBU | Caribou | | Biotechnology | 3.79 | 10 | -1.94 | -33.71% |
| VYGR | Voyager | | Biotechnology | 7.42 | 51 | -1.98 | -12.09% |
| ATRA | Atara Bio | | Biotechnology | 0.70 | 66 | -2.08 | 36.47% |
| ANAB | AnaptysBio | | Biotechnology | 18.87 | 0 | -2.08 | -11.90% |
| KRYS | Krystal | | Biotechnology | 155.74 | 41 | -2.08 | 25.53% |
| AMRN | Amarin | | Biotechnology | 0.86 | 33 | -2.11 | -1.14% |
| To view more stocks, click on Next / Previous arrows or select different range: 0 - 25 , 25 - 50 , 50 - 75 , 75 - 100 , 100 - 125 , 125 - 150 , 150 - 175 , 175 - 200 , 200 - 225 , 225 - 250 , 250 - 275 , 275 - 300 , 300 - 325 , 325 - 350 , 350 - 375 , 375 - 400 | ||
 | Click To Change The Sort Order: By Market Cap or Company Size Performance: Year-to-date, Week and Day |  |
|
Get the most comprehensive stock market coverage daily at 12Stocks.com ➞ Best Stocks Today ➞ Best Stocks Weekly ➞ Best Stocks Year-to-Date ➞ Best Stocks Trends ➞  Best Stocks Today 12Stocks.com Best Nasdaq Stocks ➞ Best S&P 500 Stocks ➞ Best Tech Stocks ➞ Best Biotech Stocks ➞ |
| Detailed Overview of Biotech Stocks |
| Biotech Technical Overview, Leaders & Laggards, Top Biotech ETF Funds & Detailed Biotech Stocks List, Charts, Trends & More |
| Biotech Sector: Technical Analysis, Trends & YTD Performance | |
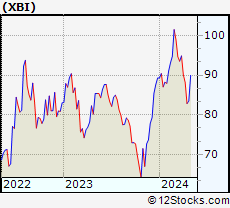
| Biotech sector, as represented by XBI, an exchange-traded fund [ETF] that holds basket of Biotech stocks (e.g, Amgen, Celgene) is down by -7.92% and is currently underperforming the overall market by -13.08% year-to-date. Below is a quick view of Technical charts and trends: | |
 XBI Weekly Chart |
|
| Long Term Trend: Not Good | |
| Medium Term Trend: Not Good | |
 XBI Daily Chart |
|
| Short Term Trend: Very Good | |
| Overall Trend Score: 25 | |
| YTD Performance: -7.92% | |
| **Trend Scores & Views Are Only For Educational Purposes And Not For Investing | |
| 12Stocks.com: Top Performing Biotech Sector Stocks | ||||||||||||||||||||||||||||||||||||||||||||||||
 The top performing Biotech sector stocks year to date are
Now, more recently, over last week, the top performing Biotech sector stocks on the move are


|
||||||||||||||||||||||||||||||||||||||||||||||||
| 12Stocks.com: Investing in Biotech Sector using Exchange Traded Funds | |
|
The following table shows list of key exchange traded funds (ETF) that
help investors track Biotech Index. For detailed view, check out our ETF Funds section of our website. Quick View: Move mouse or cursor over ETF symbol (ticker) to view short-term Technical chart and over ETF name to view long term chart. Click on ticker or stock name for detailed view. Click on to add stock symbol to your watchlist and to view watchlist. |
12Stocks.com List of ETFs that track Biotech Index
| Ticker | ETF Name | Watchlist | Recent Price | Market Intelligence Score | Change % | Week % | Year-to-date % |
| LABD | Biotech Bear 3X | | 11.03 | 75 | 6.36 | 2.13 | 13.83% |
| XBI | Biotech | | 82.22 | 25 | -2.05 | -0.74 | -7.92% |
| LABU | Biotech Bull 3X | | 83.72 | 25 | -6.35 | -2.71 | -31.36% |
| IBB | Biotechnology | | 125.67 | 18 | -1.64 | 0.76 | -7.49% |
| IYH | Healthcare | | 58.68 | 45 | -0.69 | 0.89 | 2.5% |
| IHF | Healthcare Providers | | 52.11 | 55 | -0.29 | -0.19 | -0.76% |
| IXJ | Global Healthcare | | 88.91 | 25 | -0.45 | 1.32 | 2.53% |
| BBH | Biotech | | 154.61 | 49 | -1.73 | 1.48 | -6.47% |
| FBT | First NYSE | | 142.59 | 25 | -1.93 | 0.64 | -9.78% |
| CURE | Healthcare Bull 3X | | 105.32 | 25 | -2.35 | 1.92 | 3.52% |
| BIB | Biotechnology | | 48.83 | 32 | -2.69 | 1.31 | -14.41% |
| BIS | Short Biotech | | 20.59 | 61 | 2.49 | -1.46 | 13.95% |
| PTH | DWA Healthcare Momentum | | 39.60 | 46 | -0.08 | 0.18 | 1.18% |
| PBE | Biotech & Genome | | 59.85 | 32 | -1.69 | 0 | -9.1% |
| BBC | Bio Biotechnology Clinical | | 24.70 | 36 | -3.62 | -0.04 | 1.01% |
| BTEC | Principal Healthcare Innovators | | 34.21 | 32 | 0.02 | 1.04 | -5.83% |
| BBP | Bio Biotechnology Products | | 51.14 | 35 | -2.40 | 1.41 | -11.96% |
| 12Stocks.com: Charts, Trends, Fundamental Data and Performances of Biotech Stocks | |
|
We now take in-depth look at all Biotech stocks including charts, multi-period performances and overall trends (as measured by market intelligence score). One can sort Biotech stocks (click link to choose) by Daily, Weekly and by Year-to-Date performances. Also, one can sort by size of the company or by market capitalization. |
| Select Your Default Chart Type: | |||||
| |||||
| Click on stock symbol or name for detailed view. Click on to add stock symbol to your watchlist and to view watchlist. Quick View: Move mouse or cursor over "Daily" to quickly view daily Technical stock chart and over "Weekly" to view weekly Technical stock chart. | |||||

 | ARQT Arcutis Biotherapeutics, Inc. |
| Sector: Health Care | |
| SubSector: Biotechnology | |
| MarketCap: 12787 Millions | |
| Recent Price: 8.61 Market Intelligence Score: 46 | |
| Day Percent Change: -1.60% Day Change: -0.14 | |
| Week Change: -5.28% Year-to-date Change: 166.6% | |
| ARQT Links: Profile News Message Board | |
| Charts:- Daily , Weekly | |
| Add ARQT to Watchlist: View: Get Complete ARQT Trend Analysis ➞ | |
 | ALVR AlloVir, Inc. |
| Sector: Health Care | |
| SubSector: Biotechnology | |
| MarketCap: 25787 Millions | |
| Recent Price: 0.77 Market Intelligence Score: 88 | |
| Day Percent Change: -1.61% Day Change: -0.01 | |
| Week Change: 2.43% Year-to-date Change: 13.3% | |
| ALVR Links: Profile News Message Board | |
| Charts:- Daily , Weekly | |
| Add ALVR to Watchlist: View: Get Complete ALVR Trend Analysis ➞ | |
 | BPMC Blueprint Medicines Corporation |
| Sector: Health Care | |
| SubSector: Biotechnology | |
| MarketCap: 3113.55 Millions | |
| Recent Price: 90.73 Market Intelligence Score: 81 | |
| Day Percent Change: -1.66% Day Change: -1.53 | |
| Week Change: 4.47% Year-to-date Change: -1.6% | |
| BPMC Links: Profile News Message Board | |
| Charts:- Daily , Weekly | |
| Add BPMC to Watchlist: View: Get Complete BPMC Trend Analysis ➞ | |
 | PCVX Vaxcyte, Inc. |
| Sector: Health Care | |
| SubSector: Biotechnology | |
| MarketCap: 13887 Millions | |
| Recent Price: 59.25 Market Intelligence Score: 18 | |
| Day Percent Change: -1.66% Day Change: -1.00 | |
| Week Change: -2.4% Year-to-date Change: -5.6% | |
| PCVX Links: Profile News Message Board | |
| Charts:- Daily , Weekly | |
| Add PCVX to Watchlist: View: Get Complete PCVX Trend Analysis ➞ | |
 | LBPH Longboard Pharmaceuticals, Inc. |
| Sector: Health Care | |
| SubSector: Biotechnology | |
| MarketCap: 169 Millions | |
| Recent Price: 19.43 Market Intelligence Score: 62 | |
| Day Percent Change: -1.67% Day Change: -0.33 | |
| Week Change: 11.41% Year-to-date Change: 218.0% | |
| LBPH Links: Profile News Message Board | |
| Charts:- Daily , Weekly | |
| Add LBPH to Watchlist: View: Get Complete LBPH Trend Analysis ➞ | |
 | ACAD ACADIA Pharmaceuticals Inc. |
| Sector: Health Care | |
| SubSector: Biotechnology | |
| MarketCap: 5400.35 Millions | |
| Recent Price: 16.31 Market Intelligence Score: 10 | |
| Day Percent Change: -1.69% Day Change: -0.28 | |
| Week Change: -3.03% Year-to-date Change: -47.9% | |
| ACAD Links: Profile News Message Board | |
| Charts:- Daily , Weekly | |
| Add ACAD to Watchlist: View: Get Complete ACAD Trend Analysis ➞ | |
 | HALO Halozyme Therapeutics, Inc. |
| Sector: Health Care | |
| SubSector: Biotechnology | |
| MarketCap: 2383.75 Millions | |
| Recent Price: 38.46 Market Intelligence Score: 68 | |
| Day Percent Change: -1.69% Day Change: -0.66 | |
| Week Change: -0.47% Year-to-date Change: 4.1% | |
| HALO Links: Profile News Message Board | |
| Charts:- Daily , Weekly | |
| Add HALO to Watchlist: View: Get Complete HALO Trend Analysis ➞ | |
 | PSTX Poseida Therapeutics, Inc. |
| Sector: Health Care | |
| SubSector: Biotechnology | |
| MarketCap: 64487 Millions | |
| Recent Price: 2.03 Market Intelligence Score: 25 | |
| Day Percent Change: -1.69% Day Change: -0.04 | |
| Week Change: -0.98% Year-to-date Change: -39.7% | |
| PSTX Links: Profile News Message Board | |
| Charts:- Daily , Weekly | |
| Add PSTX to Watchlist: View: Get Complete PSTX Trend Analysis ➞ | |
 | CERT Certara, Inc. |
| Sector: Health Care | |
| SubSector: Biotechnology | |
| MarketCap: 21487 Millions | |
| Recent Price: 16.16 Market Intelligence Score: 33 | |
| Day Percent Change: -1.70% Day Change: -0.28 | |
| Week Change: 1.41% Year-to-date Change: -8.2% | |
| CERT Links: Profile News Message Board | |
| Charts:- Daily , Weekly | |
| Add CERT to Watchlist: View: Get Complete CERT Trend Analysis ➞ | |
 | ARGX argenx SE |
| Sector: Health Care | |
| SubSector: Biotechnology | |
| MarketCap: 5077.05 Millions | |
| Recent Price: 368.55 Market Intelligence Score: 20 | |
| Day Percent Change: -1.72% Day Change: -6.45 | |
| Week Change: 2.34% Year-to-date Change: -3.1% | |
| ARGX Links: Profile News Message Board | |
| Charts:- Daily , Weekly | |
| Add ARGX to Watchlist: View: Get Complete ARGX Trend Analysis ➞ | |
 | STRO Sutro Biopharma, Inc. |
| Sector: Health Care | |
| SubSector: Biotechnology | |
| MarketCap: 196.485 Millions | |
| Recent Price: 3.41 Market Intelligence Score: 20 | |
| Day Percent Change: -1.73% Day Change: -0.06 | |
| Week Change: -6.19% Year-to-date Change: -20.5% | |
| STRO Links: Profile News Message Board | |
| Charts:- Daily , Weekly | |
| Add STRO to Watchlist: View: Get Complete STRO Trend Analysis ➞ | |
 | REGN Regeneron Pharmaceuticals, Inc. |
| Sector: Health Care | |
| SubSector: Biotechnology | |
| MarketCap: 51903.7 Millions | |
| Recent Price: 890.68 Market Intelligence Score: 10 | |
| Day Percent Change: -1.75% Day Change: -15.86 | |
| Week Change: -0.68% Year-to-date Change: 1.4% | |
| REGN Links: Profile News Message Board | |
| Charts:- Daily , Weekly | |
| Add REGN to Watchlist: View: Get Complete REGN Trend Analysis ➞ | |
 | VNDA Vanda Pharmaceuticals Inc. |
| Sector: Health Care | |
| SubSector: Biotechnology | |
| MarketCap: 464.585 Millions | |
| Recent Price: 4.48 Market Intelligence Score: 43 | |
| Day Percent Change: -1.75% Day Change: -0.08 | |
| Week Change: -12.33% Year-to-date Change: 6.2% | |
| VNDA Links: Profile News Message Board | |
| Charts:- Daily , Weekly | |
| Add VNDA to Watchlist: View: Get Complete VNDA Trend Analysis ➞ | |
 | TARS Tarsus Pharmaceuticals, Inc. |
| Sector: Health Care | |
| SubSector: Biotechnology | |
| MarketCap: 74487 Millions | |
| Recent Price: 32.17 Market Intelligence Score: 49 | |
| Day Percent Change: -1.83% Day Change: -0.60 | |
| Week Change: -2.19% Year-to-date Change: 58.6% | |
| TARS Links: Profile News Message Board | |
| Charts:- Daily , Weekly | |
| Add TARS to Watchlist: View: Get Complete TARS Trend Analysis ➞ | |
 | CTMX CytomX Therapeutics, Inc. |
| Sector: Health Care | |
| SubSector: Biotechnology | |
| MarketCap: 264.885 Millions | |
| Recent Price: 1.60 Market Intelligence Score: 44 | |
| Day Percent Change: -1.84% Day Change: -0.03 | |
| Week Change: -4.19% Year-to-date Change: 3.2% | |
| CTMX Links: Profile News Message Board | |
| Charts:- Daily , Weekly | |
| Add CTMX to Watchlist: View: Get Complete CTMX Trend Analysis ➞ | |
 | ADAP Adaptimmune Therapeutics plc |
| Sector: Health Care | |
| SubSector: Biotechnology | |
| MarketCap: 380.985 Millions | |
| Recent Price: 1.06 Market Intelligence Score: 56 | |
| Day Percent Change: -1.85% Day Change: -0.02 | |
| Week Change: 8.53% Year-to-date Change: 33.7% | |
| ADAP Links: Profile News Message Board | |
| Charts:- Daily , Weekly | |
| Add ADAP to Watchlist: View: Get Complete ADAP Trend Analysis ➞ | |
 | FULC Fulcrum Therapeutics, Inc. |
| Sector: Health Care | |
| SubSector: Biotechnology | |
| MarketCap: 274.785 Millions | |
| Recent Price: 7.14 Market Intelligence Score: 38 | |
| Day Percent Change: -1.85% Day Change: -0.14 | |
| Week Change: 4.15% Year-to-date Change: 5.9% | |
| FULC Links: Profile News Message Board | |
| Charts:- Daily , Weekly | |
| Add FULC to Watchlist: View: Get Complete FULC Trend Analysis ➞ | |
 | ARDX Ardelyx, Inc. |
| Sector: Health Care | |
| SubSector: Biotechnology | |
| MarketCap: 541.985 Millions | |
| Recent Price: 6.31 Market Intelligence Score: 18 | |
| Day Percent Change: -1.87% Day Change: -0.12 | |
| Week Change: -2.62% Year-to-date Change: 1.8% | |
| ARDX Links: Profile News Message Board | |
| Charts:- Daily , Weekly | |
| Add ARDX to Watchlist: View: Get Complete ARDX Trend Analysis ➞ | |
 | VRCA Verrica Pharmaceuticals Inc. |
| Sector: Health Care | |
| SubSector: Biotechnology | |
| MarketCap: 289.585 Millions | |
| Recent Price: 6.66 Market Intelligence Score: 49 | |
| Day Percent Change: -1.91% Day Change: -0.13 | |
| Week Change: -4.31% Year-to-date Change: -9.0% | |
| VRCA Links: Profile News Message Board | |
| Charts:- Daily , Weekly | |
| Add VRCA to Watchlist: View: Get Complete VRCA Trend Analysis ➞ | |
 | CRBU Caribou Biosciences, Inc. |
| Sector: Health Care | |
| SubSector: Biotechnology | |
| MarketCap: 258 Millions | |
| Recent Price: 3.79 Market Intelligence Score: 10 | |
| Day Percent Change: -1.94% Day Change: -0.07 | |
| Week Change: -1.69% Year-to-date Change: -33.7% | |
| CRBU Links: Profile News Message Board | |
| Charts:- Daily , Weekly | |
| Add CRBU to Watchlist: View: Get Complete CRBU Trend Analysis ➞ | |
 | VYGR Voyager Therapeutics, Inc. |
| Sector: Health Care | |
| SubSector: Biotechnology | |
| MarketCap: 321.085 Millions | |
| Recent Price: 7.42 Market Intelligence Score: 51 | |
| Day Percent Change: -1.98% Day Change: -0.15 | |
| Week Change: -1.07% Year-to-date Change: -12.1% | |
| VYGR Links: Profile News Message Board | |
| Charts:- Daily , Weekly | |
| Add VYGR to Watchlist: View: Get Complete VYGR Trend Analysis ➞ | |
 | ATRA Atara Biotherapeutics, Inc. |
| Sector: Health Care | |
| SubSector: Biotechnology | |
| MarketCap: 579.185 Millions | |
| Recent Price: 0.70 Market Intelligence Score: 66 | |
| Day Percent Change: -2.08% Day Change: -0.01 | |
| Week Change: 5.87% Year-to-date Change: 36.5% | |
| ATRA Links: Profile News Message Board | |
| Charts:- Daily , Weekly | |
| Add ATRA to Watchlist: View: Get Complete ATRA Trend Analysis ➞ | |
 | ANAB AnaptysBio, Inc. |
| Sector: Health Care | |
| SubSector: Biotechnology | |
| MarketCap: 405.985 Millions | |
| Recent Price: 18.87 Market Intelligence Score: 0 | |
| Day Percent Change: -2.08% Day Change: -0.40 | |
| Week Change: -5.03% Year-to-date Change: -11.9% | |
| ANAB Links: Profile News Message Board | |
| Charts:- Daily , Weekly | |
| Add ANAB to Watchlist: View: Get Complete ANAB Trend Analysis ➞ | |
 | KRYS Krystal Biotech, Inc. |
| Sector: Health Care | |
| SubSector: Biotechnology | |
| MarketCap: 874.085 Millions | |
| Recent Price: 155.74 Market Intelligence Score: 41 | |
| Day Percent Change: -2.08% Day Change: -3.31 | |
| Week Change: -1.83% Year-to-date Change: 25.5% | |
| KRYS Links: Profile News Message Board | |
| Charts:- Daily , Weekly | |
| Add KRYS to Watchlist: View: Get Complete KRYS Trend Analysis ➞ | |
 | AMRN Amarin Corporation plc |
| Sector: Health Care | |
| SubSector: Biotechnology | |
| MarketCap: 4197.45 Millions | |
| Recent Price: 0.86 Market Intelligence Score: 33 | |
| Day Percent Change: -2.11% Day Change: -0.02 | |
| Week Change: 0.09% Year-to-date Change: -1.1% | |
| AMRN Links: Profile News Message Board | |
| Charts:- Daily , Weekly | |
| Add AMRN to Watchlist: View: Get Complete AMRN Trend Analysis ➞ | |
| To view more stocks, click on Next / Previous arrows or select different range: 0 - 25 , 25 - 50 , 50 - 75 , 75 - 100 , 100 - 125 , 125 - 150 , 150 - 175 , 175 - 200 , 200 - 225 , 225 - 250 , 250 - 275 , 275 - 300 , 300 - 325 , 325 - 350 , 350 - 375 , 375 - 400 | ||
| Click To Change The Sort Order: By Market Cap or Company Size Performance: Year-to-date, Week and Day | |
| Select Chart Type: | ||
|
Best Stocks Today 12Stocks.com |
© 2024 12Stocks.com Terms & Conditions Privacy Contact Us
All Information Provided Only For Education And Not To Be Used For Investing or Trading. See Terms & Conditions


One More Thing ... Get Best Stocks Delivered Daily!
Never Ever Miss A Move With Our Top Ten Stocks Lists
Find Best Stocks In Any Market - Bull or Bear Market
Take A Peek At Our Top Ten Stocks Lists: Daily, Weekly, Year-to-Date & Top Trends
Find Best Stocks In Any Market - Bull or Bear Market
Take A Peek At Our Top Ten Stocks Lists: Daily, Weekly, Year-to-Date & Top Trends
Biotech Stocks With Best Up Trends [0-bearish to 100-bullish]: Annovis Bio[100], Agios [100], Agenus [95], Mesoblast [95], Cullinan Oncology[93], Avadel [93], Pieris [93], NewAmsterdam Pharma[93], PureTech Health[93], Exelixis [90], ALX Oncology[88]
Best Biotech Stocks Year-to-Date:
Pieris [6273.63%], Precision [2590.41%], Inovio [1885.29%], Assembly [1529.07%], NuCana [1198.17%], Adverum nologies[1147.34%], Agenus [902.54%], Affimed N.V[680.8%], Mesoblast [459.09%], Corbus [454.64%], Janux [338.34%] Best Biotech Stocks This Week:
Pieris [7900%], Agenus [56.31%], ProKidney [32.84%], Seres [32.65%], Annovis Bio[30%], BeyondSpring [26.11%], Cullinan Oncology[22.92%], Pharvaris N.V[18.84%], Mesoblast [18.04%], BeiGene [14.7%], Avid Bioservices[14.2%] Best Biotech Stocks Daily:
Galera [13.74%], Agenus [11.86%], ADiTx [10.57%], Apollomics [9.94%], Pharming [9.06%], Structure [8.13%], Pharvaris N.V[7.91%], ProKidney [7.75%], Avid Bioservices[7.17%], Merus N.V[7.05%], Zura Bio[6.75%]