
 Login Sign Up


| |||||
 |  | ||||

| 12Stocks.com Market Intelligence |
Best Biotech Stocks
|
|
| Quick Read: Best Biotech Stocks List By Performances & Trends: Daily, Weekly, Year-to-Date, Market Cap (Size) & Technical Trends | |||
| Best Biotech Stocks Views: Quick Browse View, Summary & Slide Show View | |||
| 12Stocks.com Biotech Stocks Performances & Trends Daily | |||||||||
|
|  The overall market intelligence score is 100 (0-bearish to 100-bullish) which puts Biotech sector in short term bullish trend. The market intelligence score from previous trading session is 60 and hence an improvement of trend.
| ||||||||
Here are the market intelligence trend scores of the most requested Biotech stocks at 12Stocks.com (click stock name for detailed review):
|


| 12Stocks.com: Investing in Biotech sector with Stocks | |
|
The following table helps investors and traders sort through current performance and trends (as measured by market intelligence score) of various
stocks in the Biotech sector. Quick View: Move mouse or cursor over stock symbol (ticker) to view short-term Technical chart and over stock name to view long term chart. Click on  to add stock symbol to your watchlist and to add stock symbol to your watchlist and  to view watchlist. Click on any ticker or stock name for detailed market intelligence report for that stock. to view watchlist. Click on any ticker or stock name for detailed market intelligence report for that stock. |
12Stocks.com Performance of Stocks in Biotech Sector
| Ticker | Stock Name | Watchlist | Category | Recent Price | Market Intelligence Score | Change % | YTD Change% |
| BCRX | BioCryst |   | Biotechnology | 8.31 | 0 | 0.00 | 11.44% |
| CDXS | Codexis | | Biotechnology | 2.73 | 20 | 0.00 | -40.88% |
| ASND | Ascendis Pharma | | Biotechnology | 194.27 | 100 | 0.00 | 40.05% |
| BOLD | Audentes | | Biotechnology | 1.12 | 70 | 0.00 | -60.69% |
| MTNB | Matinas BioPharma | | Biotechnology | 1.82 | 40 | 0.00 | 241.18% |
| IPHA | Innate Pharma | | Biotechnology | 2.16 | 20 | 0.00 | 21.20% |
| ARQT | Arcutis Bio | | Biotechnology | 15.52 | 50 | 0.00 | 13.35% |
| GLTO | Galecto | | Biotechnology | 3.18 | 20 | 0.00 | -27.31% |
| TSHA | Taysha Gene | | Biotechnology | 2.92 | 30 | 0.00 | 65.90% |
| SEER | Seer | | Biotechnology | 2.05 | 10 | 0.00 | -11.26% |
| FDMT | 4D Molecular | | Biotechnology | 6.16 | 40 | 0.00 | 22.98% |
| KRYS | Krystal | | Biotechnology | 147.70 | 60 | -0.11 | -7.00% |
| VKTX | Viking | | Biotechnology | 27.05 | 50 | -0.12 | -36.23% |
| BHVN | Biohaven | | Biotechnology | 15.39 | 70 | -0.14 | -60.70% |
| AMRN | Amarin | | Biotechnology | 15.04 | 10 | -0.19 | 63.09% |
| VCYT | Veracyte | | Biotechnology | 30.34 | 60 | -0.20 | -25.68% |
| GILD | Gilead | | Biotechnology | 112.71 | 20 | -0.23 | 17.60% |
| HLVX | HilleVax | | Biotechnology | 2.09 | 46 | -0.24 | -0.24% |
| AMGN | Amgen | | Biotechnology | 286.92 | 30 | -0.27 | 2.23% |
| LEGN | Legend | | Biotechnology | 34.73 | 10 | -0.28 | 9.19% |
| BEAM | Beam | | Biotechnology | 16.36 | 20 | -0.31 | -35.44% |
| ADCT | ADC | | Biotechnology | 3.07 | 30 | -0.32 | 55.78% |
| SIGA | SIGA Technologies | | Biotechnology | 8.39 | 80 | -0.34 | 60.78% |
| PTGX | Protagonist | | Biotechnology | 59.05 | 90 | -0.34 | 45.18% |
| NXTC | NextCure | | Biotechnology | 5.03 | 20 | -0.39 | -44.77% |
| To view more stocks, click on Next / Previous arrows or select different range: 0 - 25 , 25 - 50 , 50 - 75 , 75 - 100 , 100 - 125 , 125 - 150 , 150 - 175 , 175 - 200 , 200 - 225 , 225 - 250 , 250 - 275 , 275 - 300 , 300 - 325 | ||
 | Click To Change The Sort Order: By Market Cap or Company Size Performance: Year-to-date, Week and Day |  |
|
Get the most comprehensive stock market coverage daily at 12Stocks.com ➞ Best Stocks Today ➞ Best Stocks Weekly ➞ Best Stocks Year-to-Date ➞ Best Stocks Trends ➞  Best Stocks Today 12Stocks.com Best Nasdaq Stocks ➞ Best S&P 500 Stocks ➞ Best Tech Stocks ➞ Best Biotech Stocks ➞ |
| Detailed Overview of Biotech Stocks |
| Biotech Technical Overview, Leaders & Laggards, Top Biotech ETF Funds & Detailed Biotech Stocks List, Charts, Trends & More |
| Biotech Sector: Technical Analysis, Trends & YTD Performance | |
| Biotech sector, as represented by XBI, an exchange-traded fund [ETF] that holds basket of Biotech stocks (e.g, Amgen, Celgene) is up by 0.24% and is currently underperforming the overall market by -6.28% year-to-date. Below is a quick view of Technical charts and trends: | |
 XBI Weekly Chart |
|
| Long Term Trend: Very Good | |
| Medium Term Trend: Very Good | |
 XBI Daily Chart |
|
| Short Term Trend: Very Good | |
| Overall Trend Score: 100 | |
| YTD Performance: 0.24% | |
| **Trend Scores & Views Are Only For Educational Purposes And Not For Investing | |
| 12Stocks.com: Top Performing Biotech Sector Stocks | ||||||||||||||||||||||||||||||||||||||||||||||||
 The top performing Biotech sector stocks year to date are
Now, more recently, over last week, the top performing Biotech sector stocks on the move are


|
||||||||||||||||||||||||||||||||||||||||||||||||
| 12Stocks.com: Investing in Biotech Sector using Exchange Traded Funds | |
|
The following table shows list of key exchange traded funds (ETF) that
help investors track Biotech Index. For detailed view, check out our ETF Funds section of our website. Quick View: Move mouse or cursor over ETF symbol (ticker) to view short-term Technical chart and over ETF name to view long term chart. Click on ticker or stock name for detailed view. Click on to add stock symbol to your watchlist and to view watchlist. |
12Stocks.com List of ETFs that track Biotech Index
| Ticker | ETF Name | Watchlist | Recent Price | Market Intelligence Score | Change % | Week % | Year-to-date % |
| XBI | Biotech | | 92.88 | 100 | 3.37 | 3.37 | 0.24% |
| LABD | Biotech Bear 3X | | 5.75 | 10 | -2.55 | -1.37 | -19.84% |
| IBB | Biotechnology | | 138.22 | 100 | 0.73 | 0.73 | 0.89% |
| IHF | Healthcare Providers | | 47.35 | 80 | 0.25 | 0.25 | -10.02% |
| LABU | Biotech Bull 3X | | 69.35 | 100 | 2.38 | 0.61 | -22.08% |
| IYH | Healthcare | | 57.87 | 90 | -0.31 | 2.14 | -0.44% |
| CURE | Healthcare Bull 3X | | 80.67 | 80 | -1.02 | 6.93 | -12.21% |
| ZBIO | Short Biotech | | 16.00 | 100 | 3.74 | 1.01 | 106.72% |
| IXJ | Global Healthcare | | 87.66 | 70 | 0.82 | 1.4 | -2.62% |
| BBC | Bio Biotechnology Clinical | | 22.70 | 100 | 2.05 | 0.29 | -5.46% |
| FBT | First NYSE | | 171.98 | 90 | -0.15 | 0.66 | 4.14% |
| BIB | Biotechnology | | 55.26 | 100 | 1.03 | 2.47 | 11.53% |
| BBH | Biotech | | 165.18 | 70 | 0.61 | 0.53 | 1.51% |
| BIS | Short Biotech | | 14.42 | 0 | -0.99 | -2.37 | -20.83% |
| PBE | Biotech & Genome | | 68.45 | 100 | 0.31 | 1.64 | 2.9% |
| BBP | Bio Biotechnology Products | | 67.32 | 100 | 0.76 | 1.05 | 12.25% |
| PTH | DWA Healthcare Momentum | | 39.81 | 90 | 0.67 | 0.47 | -1.58% |
| 12Stocks.com: Charts, Trends, Fundamental Data and Performances of Biotech Stocks | |
|
We now take in-depth look at all Biotech stocks including charts, multi-period performances and overall trends (as measured by market intelligence score). One can sort Biotech stocks (click link to choose) by Daily, Weekly and by Year-to-Date performances. Also, one can sort by size of the company or by market capitalization. |
| Select Your Default Chart Type: | |||||
| |||||
| Click on stock symbol or name for detailed view. Click on to add stock symbol to your watchlist and to view watchlist. Quick View: Move mouse or cursor over "Daily" to quickly view daily Technical stock chart and over "Weekly" to view weekly Technical stock chart. | |||||

 | BCRX BioCryst Pharmaceuticals, Inc. |
| Sector: Health Care | |
| SubSector: Biotechnology | |
| MarketCap: 369.385 Millions | |
| Recent Price: 8.31 Market Intelligence Score: 0 | |
| Day Percent Change: 0% Day Change: 0 | |
| Week Change: -0.83% Year-to-date Change: 11.4% | |
| BCRX Links: Profile News Message Board | |
| Charts:- Daily , Weekly | |
| Add BCRX to Watchlist: View: Get Complete BCRX Trend Analysis ➞ | |
 | CDXS Codexis, Inc. |
| Sector: Health Care | |
| SubSector: Biotechnology | |
| MarketCap: 592.185 Millions | |
| Recent Price: 2.73 Market Intelligence Score: 20 | |
| Day Percent Change: 0% Day Change: 0 | |
| Week Change: -9.03% Year-to-date Change: -40.9% | |
| CDXS Links: Profile News Message Board | |
| Charts:- Daily , Weekly | |
| Add CDXS to Watchlist: View: Get Complete CDXS Trend Analysis ➞ | |
 | ASND Ascendis Pharma A/S |
| Sector: Health Care | |
| SubSector: Biotechnology | |
| MarketCap: 5470.35 Millions | |
| Recent Price: 194.27 Market Intelligence Score: 100 | |
| Day Percent Change: 0% Day Change: 0 | |
| Week Change: 0.4% Year-to-date Change: 40.1% | |
| ASND Links: Profile News Message Board | |
| Charts:- Daily , Weekly | |
| Add ASND to Watchlist: View: Get Complete ASND Trend Analysis ➞ | |
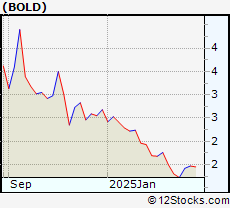 | BOLD Audentes Therapeutics, Inc. |
| Sector: Health Care | |
| SubSector: Biotechnology | |
| MarketCap: 336.2 Millions | |
| Recent Price: 1.12 Market Intelligence Score: 70 | |
| Day Percent Change: 0% Day Change: 0 | |
| Week Change: -2.56% Year-to-date Change: -60.7% | |
| BOLD Links: Profile News Message Board | |
| Charts:- Daily , Weekly | |
| Add BOLD to Watchlist: View: Get Complete BOLD Trend Analysis ➞ | |
 | MTNB Matinas BioPharma Holdings, Inc. |
| Sector: Health Care | |
| SubSector: Biotechnology | |
| MarketCap: 147.085 Millions | |
| Recent Price: 1.82 Market Intelligence Score: 40 | |
| Day Percent Change: 0% Day Change: 0 | |
| Week Change: 5.45% Year-to-date Change: 241.2% | |
| MTNB Links: Profile News Message Board | |
| Charts:- Daily , Weekly | |
| Add MTNB to Watchlist: View: Get Complete MTNB Trend Analysis ➞ | |
 | IPHA Innate Pharma S.A. |
| Sector: Health Care | |
| SubSector: Biotechnology | |
| MarketCap: 309.485 Millions | |
| Recent Price: 2.16 Market Intelligence Score: 20 | |
| Day Percent Change: 0% Day Change: 0 | |
| Week Change: 2.49% Year-to-date Change: 21.2% | |
| IPHA Links: Profile News Message Board | |
| Charts:- Daily , Weekly | |
| Add IPHA to Watchlist: View: Get Complete IPHA Trend Analysis ➞ | |
 | ARQT Arcutis Biotherapeutics, Inc. |
| Sector: Health Care | |
| SubSector: Biotechnology | |
| MarketCap: 12787 Millions | |
| Recent Price: 15.52 Market Intelligence Score: 50 | |
| Day Percent Change: 0% Day Change: 0 | |
| Week Change: -1.19% Year-to-date Change: 13.4% | |
| ARQT Links: Profile News Message Board | |
| Charts:- Daily , Weekly | |
| Add ARQT to Watchlist: View: Get Complete ARQT Trend Analysis ➞ | |
 | GLTO Galecto, Inc. |
| Sector: Health Care | |
| SubSector: Biotechnology | |
| MarketCap: 34487 Millions | |
| Recent Price: 3.18 Market Intelligence Score: 20 | |
| Day Percent Change: 0% Day Change: 0 | |
| Week Change: -1.55% Year-to-date Change: -27.3% | |
| GLTO Links: Profile News Message Board | |
| Charts:- Daily , Weekly | |
| Add GLTO to Watchlist: View: Get Complete GLTO Trend Analysis ➞ | |
 | TSHA Taysha Gene Therapies, Inc. |
| Sector: Health Care | |
| SubSector: Biotechnology | |
| MarketCap: 76487 Millions | |
| Recent Price: 2.92 Market Intelligence Score: 30 | |
| Day Percent Change: 0% Day Change: 0 | |
| Week Change: -2.38% Year-to-date Change: 65.9% | |
| TSHA Links: Profile News Message Board | |
| Charts:- Daily , Weekly | |
| Add TSHA to Watchlist: View: Get Complete TSHA Trend Analysis ➞ | |
 | SEER Seer, Inc. |
| Sector: Health Care | |
| SubSector: Biotechnology | |
| MarketCap: 48287 Millions | |
| Recent Price: 2.05 Market Intelligence Score: 10 | |
| Day Percent Change: 0% Day Change: 0 | |
| Week Change: -1.44% Year-to-date Change: -11.3% | |
| SEER Links: Profile News Message Board | |
| Charts:- Daily , Weekly | |
| Add SEER to Watchlist: View: Get Complete SEER Trend Analysis ➞ | |
 | FDMT 4D Molecular Therapeutics, Inc. |
| Sector: Health Care | |
| SubSector: Biotechnology | |
| MarketCap: 772 Millions | |
| Recent Price: 6.16 Market Intelligence Score: 40 | |
| Day Percent Change: 0% Day Change: 0 | |
| Week Change: -3.52% Year-to-date Change: 23.0% | |
| FDMT Links: Profile News Message Board | |
| Charts:- Daily , Weekly | |
| Add FDMT to Watchlist: View: Get Complete FDMT Trend Analysis ➞ | |
 | KRYS Krystal Biotech, Inc. |
| Sector: Health Care | |
| SubSector: Biotechnology | |
| MarketCap: 874.085 Millions | |
| Recent Price: 147.70 Market Intelligence Score: 60 | |
| Day Percent Change: -0.11% Day Change: -0.16 | |
| Week Change: -3.08% Year-to-date Change: -7.0% | |
| KRYS Links: Profile News Message Board | |
| Charts:- Daily , Weekly | |
| Add KRYS to Watchlist: View: Get Complete KRYS Trend Analysis ➞ | |
 | VKTX Viking Therapeutics, Inc. |
| Sector: Health Care | |
| SubSector: Biotechnology | |
| MarketCap: 388.585 Millions | |
| Recent Price: 27.05 Market Intelligence Score: 50 | |
| Day Percent Change: -0.12% Day Change: -0.03 | |
| Week Change: -36.23% Year-to-date Change: -36.2% | |
| VKTX Links: Profile News Message Board | |
| Charts:- Daily , Weekly | |
| Add VKTX to Watchlist: View: Get Complete VKTX Trend Analysis ➞ | |
 | BHVN Biohaven Pharmaceutical Holding Company Ltd. |
| Sector: Health Care | |
| SubSector: Biotechnology | |
| MarketCap: 2024.25 Millions | |
| Recent Price: 15.39 Market Intelligence Score: 70 | |
| Day Percent Change: -0.14% Day Change: -0.02 | |
| Week Change: 3.16% Year-to-date Change: -60.7% | |
| BHVN Links: Profile News Message Board | |
| Charts:- Daily , Weekly | |
| Add BHVN to Watchlist: View: Get Complete BHVN Trend Analysis ➞ | |
 | AMRN Amarin Corporation plc |
| Sector: Health Care | |
| SubSector: Biotechnology | |
| MarketCap: 4197.45 Millions | |
| Recent Price: 15.04 Market Intelligence Score: 10 | |
| Day Percent Change: -0.19% Day Change: -0.03 | |
| Week Change: 5.19% Year-to-date Change: 63.1% | |
| AMRN Links: Profile News Message Board | |
| Charts:- Daily , Weekly | |
| Add AMRN to Watchlist: View: Get Complete AMRN Trend Analysis ➞ | |
 | VCYT Veracyte, Inc. |
| Sector: Health Care | |
| SubSector: Biotechnology | |
| MarketCap: 1089.05 Millions | |
| Recent Price: 30.34 Market Intelligence Score: 60 | |
| Day Percent Change: -0.2% Day Change: -0.06 | |
| Week Change: -2.03% Year-to-date Change: -25.7% | |
| VCYT Links: Profile News Message Board | |
| Charts:- Daily , Weekly | |
| Add VCYT to Watchlist: View: Get Complete VCYT Trend Analysis ➞ | |
 | GILD Gilead Sciences, Inc. |
| Sector: Health Care | |
| SubSector: Biotechnology | |
| MarketCap: 99485.6 Millions | |
| Recent Price: 112.71 Market Intelligence Score: 20 | |
| Day Percent Change: -0.23% Day Change: -0.26 | |
| Week Change: -0.23% Year-to-date Change: 17.6% | |
| GILD Links: Profile News Message Board | |
| Charts:- Daily , Weekly | |
| Add GILD to Watchlist: View: Get Complete GILD Trend Analysis ➞ | |
 | HLVX HilleVax, Inc. |
| Sector: Health Care | |
| SubSector: Biotechnology | |
| MarketCap: 680 Millions | |
| Recent Price: 2.09 Market Intelligence Score: 46 | |
| Day Percent Change: -0.24% Day Change: 0 | |
| Week Change: -0.72% Year-to-date Change: -0.2% | |
| HLVX Links: Profile News Message Board | |
| Charts:- Daily , Weekly | |
| Add HLVX to Watchlist: View: Get Complete HLVX Trend Analysis ➞ | |
 | AMGN Amgen Inc. |
| Sector: Health Care | |
| SubSector: Biotechnology | |
| MarketCap: 121030 Millions | |
| Recent Price: 286.92 Market Intelligence Score: 30 | |
| Day Percent Change: -0.27% Day Change: -0.79 | |
| Week Change: -0.27% Year-to-date Change: 2.2% | |
| AMGN Links: Profile News Message Board | |
| Charts:- Daily , Weekly | |
| Add AMGN to Watchlist: View: Get Complete AMGN Trend Analysis ➞ | |
 | LEGN Legend Biotech Corporation |
| Sector: Health Care | |
| SubSector: Biotechnology | |
| MarketCap: 37387 Millions | |
| Recent Price: 34.73 Market Intelligence Score: 10 | |
| Day Percent Change: -0.28% Day Change: -0.1 | |
| Week Change: -5.78% Year-to-date Change: 9.2% | |
| LEGN Links: Profile News Message Board | |
| Charts:- Daily , Weekly | |
| Add LEGN to Watchlist: View: Get Complete LEGN Trend Analysis ➞ | |
 | BEAM Beam Therapeutics Inc. |
| Sector: Health Care | |
| SubSector: Biotechnology | |
| MarketCap: 44987 Millions | |
| Recent Price: 16.36 Market Intelligence Score: 20 | |
| Day Percent Change: -0.31% Day Change: -0.05 | |
| Week Change: -9.19% Year-to-date Change: -35.4% | |
| BEAM Links: Profile News Message Board | |
| Charts:- Daily , Weekly | |
| Add BEAM to Watchlist: View: Get Complete BEAM Trend Analysis ➞ | |
 | ADCT ADC Therapeutics SA |
| Sector: Health Care | |
| SubSector: Biotechnology | |
| MarketCap: 26087 Millions | |
| Recent Price: 3.07 Market Intelligence Score: 30 | |
| Day Percent Change: -0.32% Day Change: -0.01 | |
| Week Change: -2.82% Year-to-date Change: 55.8% | |
| ADCT Links: Profile News Message Board | |
| Charts:- Daily , Weekly | |
| Add ADCT to Watchlist: View: Get Complete ADCT Trend Analysis ➞ | |
 | SIGA SIGA Technologies, Inc. |
| Sector: Health Care | |
| SubSector: Biotechnology | |
| MarketCap: 424.285 Millions | |
| Recent Price: 8.39 Market Intelligence Score: 80 | |
| Day Percent Change: -0.34% Day Change: -0.03 | |
| Week Change: 1.98% Year-to-date Change: 60.8% | |
| SIGA Links: Profile News Message Board | |
| Charts:- Daily , Weekly | |
| Add SIGA to Watchlist: View: Get Complete SIGA Trend Analysis ➞ | |
 | PTGX Protagonist Therapeutics, Inc. |
| Sector: Health Care | |
| SubSector: Biotechnology | |
| MarketCap: 165.285 Millions | |
| Recent Price: 59.05 Market Intelligence Score: 90 | |
| Day Percent Change: -0.34% Day Change: -0.19 | |
| Week Change: 1.91% Year-to-date Change: 45.2% | |
| PTGX Links: Profile News Message Board | |
| Charts:- Daily , Weekly | |
| Add PTGX to Watchlist: View: Get Complete PTGX Trend Analysis ➞ | |
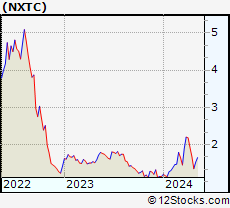 | NXTC NextCure, Inc. |
| Sector: Health Care | |
| SubSector: Biotechnology | |
| MarketCap: 1040.95 Millions | |
| Recent Price: 5.03 Market Intelligence Score: 20 | |
| Day Percent Change: -0.39% Day Change: -0.02 | |
| Week Change: -0.74% Year-to-date Change: -44.8% | |
| NXTC Links: Profile News Message Board | |
| Charts:- Daily , Weekly | |
| Add NXTC to Watchlist: View: Get Complete NXTC Trend Analysis ➞ | |
| To view more stocks, click on Next / Previous arrows or select different range: 0 - 25 , 25 - 50 , 50 - 75 , 75 - 100 , 100 - 125 , 125 - 150 , 150 - 175 , 175 - 200 , 200 - 225 , 225 - 250 , 250 - 275 , 275 - 300 , 300 - 325 | ||
| Click To Change The Sort Order: By Market Cap or Company Size Performance: Year-to-date, Week and Day | |
| Select Chart Type: | ||
|
Best Stocks Today 12Stocks.com |
© 2025 12Stocks.com Terms & Conditions Privacy Contact Us
All Information Provided Only For Education And Not To Be Used For Investing or Trading. See Terms & Conditions


One More Thing ... Get Best Stocks Delivered Daily!
Never Ever Miss A Move With Our Top Ten Stocks Lists
Find Best Stocks In Any Market - Bull or Bear Market
Take A Peek At Our Top Ten Stocks Lists: Daily, Weekly, Year-to-Date & Top Trends
Find Best Stocks In Any Market - Bull or Bear Market
Take A Peek At Our Top Ten Stocks Lists: Daily, Weekly, Year-to-Date & Top Trends
Biotech Stocks With Best Up Trends [0-bearish to 100-bullish]: Sol-Gel Technologies[100], Immuneering [100], Precigen [100], Gossamer Bio[100], Fortress [100], Design [100], Terns [100], Keros [100], Coherus [100], Kura Oncology[100], FibroGen [100]
Best Biotech Stocks Year-to-Date:
I Mab[454.12%], Matinas BioPharma[241.18%], Nanobiotix S.A[239.28%], Atai Life[230.08%], Precigen [225%], DBV Technologies[208.74%], Galectin [200.78%], Sol-Gel Technologies[177.39%], Rigel [149.64%], Gossamer Bio[139.89%], Lineage Cell[132.84%] Best Biotech Stocks This Week:
Precigen [96.76%], Sol-Gel Technologies[69.18%], ALX Oncology[57.25%], Immuneering [52.3%], Minerva Neuro[34.54%], Aligos [29.73%], Karyopharm [29.46%], CASI [27.32%], Zentalis [26.35%], Rocket [23.1%], Tenaya [22.51%] Best Biotech Stocks Daily:
Sol-Gel Technologies[40.22%], Immuneering [34.99%], ALX Oncology[23.8%], Tyra [14.26%], Nanobiotix S.A[14.15%], Zentalis [14.02%], Zura Bio[13.71%], X4 [13.57%], Precigen [13.4%], Gossamer Bio[11.28%], Mersana [11.25%]