
 Login Sign Up


| |||||
 |  | ||||

| 12Stocks.com Market Intelligence |
Best Tech Stocks
| In a hurry? Tech Stocks Lists: Performance & Trends, Stock Charts, FANG Stocks
Sort Tech stocks: Daily, Weekly, Year-to-Date, Market Cap & Trends. Filter Tech stocks list by size:All Tech Large Mid-Range Small and MicroCap |
| 12Stocks.com Tech Stocks Performances & Trends Daily | |||||||||
|
|  The overall Smart Investing & Trading Score is 10 (0-bearish to 100-bullish) which puts Technology sector in short term bearish trend. The Smart Investing & Trading Score from previous trading session is 0 and hence an improvement of trend.
| ||||||||
Here are the Smart Investing & Trading Scores of the most requested Technology stocks at 12Stocks.com (click stock name for detailed review):
|


| 12Stocks.com: Investing in Technology sector with Stocks | |
|
The following table helps investors and traders sort through current performance and trends (as measured by Smart Investing & Trading Score) of various
stocks in the Tech sector. Quick View: Move mouse or cursor over stock symbol (ticker) to view short-term technical chart and over stock name to view long term chart. Click on  to add stock symbol to your watchlist and to add stock symbol to your watchlist and  to view watchlist. Click on any ticker or stock name for detailed market intelligence report for that stock. to view watchlist. Click on any ticker or stock name for detailed market intelligence report for that stock. |
12Stocks.com Performance of Stocks in Tech Sector
| Ticker | Stock Name | Watchlist | Category | Recent Price | Smart Investing & Trading Score | Change % | YTD Change% |
| CHKP | Check Point |   | Security Software | 149.49 | 17 | 0.35% | -2.16% |
| TTWO | Take-Two Interactive | | Software | 143.07 | 17 | 0.23% | -11.11% |
| CRDO | Credo | | Communication | 17.25 | 17 | 0.15% | -11.78% |
| VLD | Velo3D | | Computer Hardware | 0.24 | 17 | -6.12% | -37.82% |
| TIXT | TELUS | | Software - Infrastructure | 8.20 | 17 | -0.85% | -4.09% |
| AMPL | Amplitude | | Software - | 9.73 | 17 | -0.71% | -23.75% |
| AEIS | Advanced Energy | | Electronics | 95.65 | 17 | -0.45% | -12.18% |
| WIT | Wipro | | IT | 5.37 | 17 | -0.19% | -3.59% |
| ZS | Zscaler | | Security Software | 176.35 | 15 | 2.35% | -20.40% |
| UIS | Unisys | | IT | 5.24 | 15 | 0.58% | -6.76% |
| TXG | 10x Genomics | | Healthcare Information | 26.29 | 15 | -2.34% | -53.02% |
| ADP | Automatic Data | | Software | 242.07 | 15 | -2.13% | 3.91% |
| UPLD | Upland Software | | Software | 2.02 | 15 | -1.22% | -52.13% |
| DDOG | Datadog | | Software | 125.47 | 15 | -0.75% | 3.37% |
| SAP | SAP SE | | Software | 180.64 | 15 | 0.32% | 16.85% |
| NVEC | NVE | | Semiconductor | 79.48 | 14 | -2.35% | 1.34% |
| COGT | Cogint | | Software | 7.30 | 12 | 5.34% | 24.15% |
| NOVT | Novanta | | Instruments | 159.73 | 12 | 1.88% | -5.15% |
| TRIP | TripAdvisor | | Internet | 26.54 | 12 | 0.84% | 23.27% |
| VZIO | VIZIO Holding | | Consumer Electronics | 10.57 | 12 | -0.89% | 37.03% |
| ICAD | iCAD | | Software | 1.50 | 10 | 4.55% | -15.54% |
| SQNS | Sequans | | Semiconductor | 0.51 | 10 | 3.68% | -81.98% |
| SGH | SMART Global | | Semiconductor- | 18.52 | 10 | 2.77% | -2.17% |
| XRX | Xerox | | IT | 13.40 | 10 | 2.60% | -26.90% |
| INFA | Informatica | | Software - Infrastructure | 31.15 | 10 | 2.42% | 9.59% |
| For chart view version of above stock list: Chart View ➞ 0 - 25 , 25 - 50 , 50 - 75 , 75 - 100 , 100 - 125 , 125 - 150 , 150 - 175 , 175 - 200 , 200 - 225 , 225 - 250 , 250 - 275 , 275 - 300 , 300 - 325 , 325 - 350 , 350 - 375 , 375 - 400 , 400 - 425 , 425 - 450 , 450 - 475 , 475 - 500 , 500 - 525 , 525 - 550 , 550 - 575 , 575 - 600 , 600 - 625 , 625 - 650 | ||
 | Click To Change The Sort Order: By Market Cap or Company Size Performance: Year-to-date, Week and Day |  |
|
Get the most comprehensive stock market coverage daily at 12Stocks.com ➞ Best Stocks Today ➞ Best Stocks Weekly ➞ Best Stocks Year-to-Date ➞ Best Stocks Trends ➞  Best Stocks Today 12Stocks.com Best Nasdaq Stocks ➞ Best S&P 500 Stocks ➞ Best Tech Stocks ➞ Best Biotech Stocks ➞ |
| Detailed Overview of Tech Stocks |
| Tech Technical Overview, Leaders & Laggards, Top Tech ETF Funds & Detailed Tech Stocks List, Charts, Trends & More |
| Tech Sector: Technical Analysis, Trends & YTD Performance | |
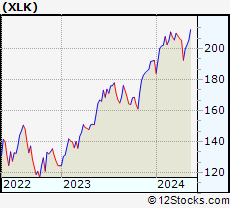
| Technology sector is composed of stocks
from semiconductors, software, web, social media
and services subsectors. Technology sector, as represented by XLK, an exchange-traded fund [ETF] that holds basket of tech stocks (e.g, Intel, Google) is up by 2.38% and is currently underperforming the overall market by -3.24% year-to-date. Below is a quick view of technical charts and trends: |
|
 XLK Weekly Chart |
|
| Long Term Trend: Not Good | |
| Medium Term Trend: Not Good | |
 XLK Daily Chart |
|
| Short Term Trend: Deteriorating | |
| Overall Trend Score: 10 | |
| YTD Performance: 2.38% | |
| **Trend Scores & Views Are Only For Educational Purposes And Not For Investing | |
| 12Stocks.com: Top Performing Technology Sector Stocks | ||||||||||||||||||||||||||||||||||||||||||||||||
 The top performing Technology sector stocks year to date are
Now, more recently, over last week, the top performing Technology sector stocks on the move are


|
||||||||||||||||||||||||||||||||||||||||||||||||
| 12Stocks.com: Investing in Tech Sector using Exchange Traded Funds | |
|
The following table shows list of key exchange traded funds (ETF) that
help investors track Tech Index. For detailed view, check out our ETF Funds section of our website. Quick View: Move mouse or cursor over ETF symbol (ticker) to view short-term technical chart and over ETF name to view long term chart. Click on ticker or stock name for detailed view. Click on to add stock symbol to your watchlist and to view watchlist. |
12Stocks.com List of ETFs that track Tech Index
| Ticker | ETF Name | Watchlist | Recent Price | Smart Investing & Trading Score | Change % | Week % | Year-to-date % |
| XLK | Technology | | 197.06 | 10 | 1.44 | -1.39 | 2.38% |
| QQQ | QQQ | | 426.92 | 17 | 1.28 | -0.95 | 4.25% |
| IYW | Technology | | 129.01 | 10 | 1.62 | -1.48 | 5.1% |
| VGT | Information Technology | | 496.06 | 17 | 1.37 | -1.56 | 2.49% |
| IXN | Global Tech | | 70.86 | 10 | 1.48 | -1.31 | 3.93% |
| IGV | Tech-Software | | 79.91 | 10 | 1.06 | -1.46 | -1.5% |
| XSD | Semiconductor | | 221.13 | 25 | 1.75 | -1.58 | -1.63% |
| TQQQ | QQQ | | 53.52 | 17 | 3.72 | -3.18 | 5.56% |
| SQQQ | Short QQQ | | 11.77 | 78 | -3.72 | 2.93 | -12.53% |
| SOXL | Semicondct Bull 3X | | 36.45 | 17 | 6.05 | -8.3 | 16.08% |
| SOXS | Semicondct Bear 3X | | 37.60 | 66 | -6.54 | 7.12 | 546.05% |
| SOXX | PHLX Semiconductor | | 211.32 | 7 | 2.21 | -2.57 | 10.04% |
| QTEC | First -100-Tech | | 180.08 | 10 | 1.55 | -2.13 | 2.63% |
| SMH | Semiconductor | | 212.14 | 30 | 2.06 | -2.53 | 21.31% |
| 12Stocks.com: Charts, Trends, Fundamental Data and Performances of Tech Stocks | |
|
We now take in-depth look at all Tech stocks including charts, multi-period performances and overall trends (as measured by Smart Investing & Trading Score). One can sort Tech stocks (click link to choose) by Daily, Weekly and by Year-to-Date performances. Also, one can sort by size of the company or by market capitalization. |
| Select Your Default Chart Type: | |||||
| |||||
| Click on stock symbol or name for detailed view. Click on to add stock symbol to your watchlist and to view watchlist. Quick View: Move mouse or cursor over "Daily" to quickly view daily technical stock chart and over "Weekly" to view weekly technical stock chart. | |||||


 | CHKP Check Point Software Technologies Ltd. |
| Sector: Technology | |
| SubSector: Security Software & Services | |
| MarketCap: 15112.2 Millions | |
| Recent Price: 149.49 Smart Investing & Trading Score: 17 | |
| Day Percent Change: 0.35% Day Change: 0.52 | |
| Week Change: -1.13% Year-to-date Change: -2.2% | |
| CHKP Links: Profile News Message Board | |
| Charts:- Daily , Weekly | |
| Add CHKP to Watchlist: View: Get Complete CHKP Trend Analysis ➞ | |
 | TTWO Take-Two Interactive Software, Inc. |
| Sector: Technology | |
| SubSector: Multimedia & Graphics Software | |
| MarketCap: 12479.6 Millions | |
| Recent Price: 143.07 Smart Investing & Trading Score: 17 | |
| Day Percent Change: 0.23% Day Change: 0.32 | |
| Week Change: -0.97% Year-to-date Change: -11.1% | |
| TTWO Links: Profile News Message Board | |
| Charts:- Daily , Weekly | |
| Add TTWO to Watchlist: View: Get Complete TTWO Trend Analysis ➞ | |
 | CRDO Credo Technology Group Holding Ltd |
| Sector: Technology | |
| SubSector: Communication Equipment | |
| MarketCap: 2590 Millions | |
| Recent Price: 17.25 Smart Investing & Trading Score: 17 | |
| Day Percent Change: 0.15% Day Change: 0.02 | |
| Week Change: -7.01% Year-to-date Change: -11.8% | |
| CRDO Links: Profile News Message Board | |
| Charts:- Daily , Weekly | |
| Add CRDO to Watchlist: View: Get Complete CRDO Trend Analysis ➞ | |
 | VLD Velo3D, Inc. |
| Sector: Technology | |
| SubSector: Computer Hardware | |
| MarketCap: 404 Millions | |
| Recent Price: 0.24 Smart Investing & Trading Score: 17 | |
| Day Percent Change: -6.12% Day Change: -0.02 | |
| Week Change: 1.75% Year-to-date Change: -37.8% | |
| VLD Links: Profile News Message Board | |
| Charts:- Daily , Weekly | |
| Add VLD to Watchlist: View: Get Complete VLD Trend Analysis ➞ | |
 | TIXT TELUS International (Cda) Inc. |
| Sector: Technology | |
| SubSector: Software - Infrastructure | |
| MarketCap: 1470 Millions | |
| Recent Price: 8.20 Smart Investing & Trading Score: 17 | |
| Day Percent Change: -0.85% Day Change: -0.07 | |
| Week Change: -0.85% Year-to-date Change: -4.1% | |
| TIXT Links: Profile News Message Board | |
| Charts:- Daily , Weekly | |
| Add TIXT to Watchlist: View: Get Complete TIXT Trend Analysis ➞ | |
 | AMPL Amplitude, Inc. |
| Sector: Technology | |
| SubSector: Software - Application | |
| MarketCap: 1320 Millions | |
| Recent Price: 9.73 Smart Investing & Trading Score: 17 | |
| Day Percent Change: -0.71% Day Change: -0.07 | |
| Week Change: -1.92% Year-to-date Change: -23.8% | |
| AMPL Links: Profile News Message Board | |
| Charts:- Daily , Weekly | |
| Add AMPL to Watchlist: View: Get Complete AMPL Trend Analysis ➞ | |
 | AEIS Advanced Energy Industries, Inc. |
| Sector: Technology | |
| SubSector: Diversified Electronics | |
| MarketCap: 1641.86 Millions | |
| Recent Price: 95.65 Smart Investing & Trading Score: 17 | |
| Day Percent Change: -0.45% Day Change: -0.43 | |
| Week Change: -0.32% Year-to-date Change: -12.2% | |
| AEIS Links: Profile News Message Board | |
| Charts:- Daily , Weekly | |
| Add AEIS to Watchlist: View: Get Complete AEIS Trend Analysis ➞ | |
 | WIT Wipro Limited |
| Sector: Technology | |
| SubSector: Information Technology Services | |
| MarketCap: 15101.3 Millions | |
| Recent Price: 5.37 Smart Investing & Trading Score: 17 | |
| Day Percent Change: -0.19% Day Change: -0.01 | |
| Week Change: -1.65% Year-to-date Change: -3.6% | |
| WIT Links: Profile News Message Board | |
| Charts:- Daily , Weekly | |
| Add WIT to Watchlist: View: Get Complete WIT Trend Analysis ➞ | |
 | ZS Zscaler, Inc. |
| Sector: Technology | |
| SubSector: Security Software & Services | |
| MarketCap: 7532.17 Millions | |
| Recent Price: 176.35 Smart Investing & Trading Score: 15 | |
| Day Percent Change: 2.35% Day Change: 4.04 | |
| Week Change: -0.39% Year-to-date Change: -20.4% | |
| ZS Links: Profile News Message Board | |
| Charts:- Daily , Weekly | |
| Add ZS to Watchlist: View: Get Complete ZS Trend Analysis ➞ | |
 | UIS Unisys Corporation |
| Sector: Technology | |
| SubSector: Information Technology Services | |
| MarketCap: 803.868 Millions | |
| Recent Price: 5.24 Smart Investing & Trading Score: 15 | |
| Day Percent Change: 0.58% Day Change: 0.03 | |
| Week Change: -4.03% Year-to-date Change: -6.8% | |
| UIS Links: Profile News Message Board | |
| Charts:- Daily , Weekly | |
| Add UIS to Watchlist: View: Get Complete UIS Trend Analysis ➞ | |
 | TXG 10x Genomics, Inc. |
| Sector: Technology | |
| SubSector: Healthcare Information Services | |
| MarketCap: 5490.45 Millions | |
| Recent Price: 26.29 Smart Investing & Trading Score: 15 | |
| Day Percent Change: -2.34% Day Change: -0.63 | |
| Week Change: -4.71% Year-to-date Change: -53.0% | |
| TXG Links: Profile News Message Board | |
| Charts:- Daily , Weekly | |
| Add TXG to Watchlist: View: Get Complete TXG Trend Analysis ➞ | |
 | ADP Automatic Data Processing, Inc. |
| Sector: Technology | |
| SubSector: Business Software & Services | |
| MarketCap: 54966.5 Millions | |
| Recent Price: 242.07 Smart Investing & Trading Score: 15 | |
| Day Percent Change: -2.13% Day Change: -5.26 | |
| Week Change: -0.41% Year-to-date Change: 3.9% | |
| ADP Links: Profile News Message Board | |
| Charts:- Daily , Weekly | |
| Add ADP to Watchlist: View: Get Complete ADP Trend Analysis ➞ | |
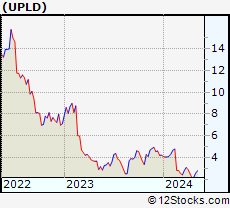 | UPLD Upland Software, Inc. |
| Sector: Technology | |
| SubSector: Application Software | |
| MarketCap: 654.562 Millions | |
| Recent Price: 2.02 Smart Investing & Trading Score: 15 | |
| Day Percent Change: -1.22% Day Change: -0.02 | |
| Week Change: -7.95% Year-to-date Change: -52.1% | |
| UPLD Links: Profile News Message Board | |
| Charts:- Daily , Weekly | |
| Add UPLD to Watchlist: View: Get Complete UPLD Trend Analysis ➞ | |
 | DDOG Datadog, Inc. |
| Sector: Technology | |
| SubSector: Application Software | |
| MarketCap: 10653.2 Millions | |
| Recent Price: 125.47 Smart Investing & Trading Score: 15 | |
| Day Percent Change: -0.75% Day Change: -0.95 | |
| Week Change: -4.55% Year-to-date Change: 3.4% | |
| DDOG Links: Profile News Message Board | |
| Charts:- Daily , Weekly | |
| Add DDOG to Watchlist: View: Get Complete DDOG Trend Analysis ➞ | |
 | SAP SAP SE |
| Sector: Technology | |
| SubSector: Application Software | |
| MarketCap: 129635 Millions | |
| Recent Price: 180.64 Smart Investing & Trading Score: 15 | |
| Day Percent Change: 0.32% Day Change: 0.57 | |
| Week Change: -2.98% Year-to-date Change: 16.9% | |
| SAP Links: Profile News Message Board | |
| Charts:- Daily , Weekly | |
| Add SAP to Watchlist: View: Get Complete SAP Trend Analysis ➞ | |
 | NVEC NVE Corporation |
| Sector: Technology | |
| SubSector: Semiconductor - Specialized | |
| MarketCap: 231.26 Millions | |
| Recent Price: 79.48 Smart Investing & Trading Score: 14 | |
| Day Percent Change: -2.35% Day Change: -1.91 | |
| Week Change: -1.13% Year-to-date Change: 1.3% | |
| NVEC Links: Profile News Message Board | |
| Charts:- Daily , Weekly | |
| Add NVEC to Watchlist: View: Get Complete NVEC Trend Analysis ➞ | |
 | COGT Cogint, Inc. |
| Sector: Technology | |
| SubSector: Business Software & Services | |
| MarketCap: 214.55 Millions | |
| Recent Price: 7.30 Smart Investing & Trading Score: 12 | |
| Day Percent Change: 5.34% Day Change: 0.37 | |
| Week Change: 21.26% Year-to-date Change: 24.2% | |
| COGT Links: Profile News Message Board | |
| Charts:- Daily , Weekly | |
| Add COGT to Watchlist: View: Get Complete COGT Trend Analysis ➞ | |
 | NOVT Novanta Inc. |
| Sector: Technology | |
| SubSector: Scientific & Technical Instruments | |
| MarketCap: 2680.83 Millions | |
| Recent Price: 159.73 Smart Investing & Trading Score: 12 | |
| Day Percent Change: 1.88% Day Change: 2.95 | |
| Week Change: 0.2% Year-to-date Change: -5.2% | |
| NOVT Links: Profile News Message Board | |
| Charts:- Daily , Weekly | |
| Add NOVT to Watchlist: View: Get Complete NOVT Trend Analysis ➞ | |
 | TRIP TripAdvisor, Inc. |
| Sector: Technology | |
| SubSector: Internet Information Providers | |
| MarketCap: 2633.9 Millions | |
| Recent Price: 26.54 Smart Investing & Trading Score: 12 | |
| Day Percent Change: 0.84% Day Change: 0.22 | |
| Week Change: -3.32% Year-to-date Change: 23.3% | |
| TRIP Links: Profile News Message Board | |
| Charts:- Daily , Weekly | |
| Add TRIP to Watchlist: View: Get Complete TRIP Trend Analysis ➞ | |
 | VZIO VIZIO Holding Corp. |
| Sector: Technology | |
| SubSector: Consumer Electronics | |
| MarketCap: 1300 Millions | |
| Recent Price: 10.57 Smart Investing & Trading Score: 12 | |
| Day Percent Change: -0.89% Day Change: -0.10 | |
| Week Change: -1.72% Year-to-date Change: 37.0% | |
| VZIO Links: Profile News Message Board | |
| Charts:- Daily , Weekly | |
| Add VZIO to Watchlist: View: Get Complete VZIO Trend Analysis ➞ | |
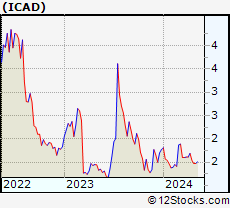 | ICAD iCAD, Inc. |
| Sector: Technology | |
| SubSector: Technical & System Software | |
| MarketCap: 174.8 Millions | |
| Recent Price: 1.50 Smart Investing & Trading Score: 10 | |
| Day Percent Change: 4.55% Day Change: 0.07 | |
| Week Change: 1.7% Year-to-date Change: -15.5% | |
| ICAD Links: Profile News Message Board | |
| Charts:- Daily , Weekly | |
| Add ICAD to Watchlist: View: Get Complete ICAD Trend Analysis ➞ | |
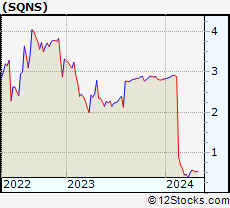 | SQNS Sequans Communications S.A. |
| Sector: Technology | |
| SubSector: Semiconductor - Integrated Circuits | |
| MarketCap: 113.61 Millions | |
| Recent Price: 0.51 Smart Investing & Trading Score: 10 | |
| Day Percent Change: 3.68% Day Change: 0.02 | |
| Week Change: -2.89% Year-to-date Change: -82.0% | |
| SQNS Links: Profile News Message Board | |
| Charts:- Daily , Weekly | |
| Add SQNS to Watchlist: View: Get Complete SQNS Trend Analysis ➞ | |
 | SGH SMART Global Holdings, Inc. |
| Sector: Technology | |
| SubSector: Semiconductor- Memory Chips | |
| MarketCap: 657.8 Millions | |
| Recent Price: 18.52 Smart Investing & Trading Score: 10 | |
| Day Percent Change: 2.77% Day Change: 0.50 | |
| Week Change: 0.98% Year-to-date Change: -2.2% | |
| SGH Links: Profile News Message Board | |
| Charts:- Daily , Weekly | |
| Add SGH to Watchlist: View: Get Complete SGH Trend Analysis ➞ | |
 | XRX Xerox Holdings Corporation |
| Sector: Technology | |
| SubSector: Information Technology Services | |
| MarketCap: 4077.48 Millions | |
| Recent Price: 13.40 Smart Investing & Trading Score: 10 | |
| Day Percent Change: 2.60% Day Change: 0.34 | |
| Week Change: -4.29% Year-to-date Change: -26.9% | |
| XRX Links: Profile News Message Board | |
| Charts:- Daily , Weekly | |
| Add XRX to Watchlist: View: Get Complete XRX Trend Analysis ➞ | |
 | INFA Informatica Inc. |
| Sector: Technology | |
| SubSector: Software - Infrastructure | |
| MarketCap: 5340 Millions | |
| Recent Price: 31.15 Smart Investing & Trading Score: 10 | |
| Day Percent Change: 2.42% Day Change: 0.73 | |
| Week Change: -2.37% Year-to-date Change: 9.6% | |
| INFA Links: Profile News Message Board | |
| Charts:- Daily , Weekly | |
| Add INFA to Watchlist: View: Get Complete INFA Trend Analysis ➞ | |
| For tabular summary view of above stock list: Summary View ➞ 0 - 25 , 25 - 50 , 50 - 75 , 75 - 100 , 100 - 125 , 125 - 150 , 150 - 175 , 175 - 200 , 200 - 225 , 225 - 250 , 250 - 275 , 275 - 300 , 300 - 325 , 325 - 350 , 350 - 375 , 375 - 400 , 400 - 425 , 425 - 450 , 450 - 475 , 475 - 500 , 500 - 525 , 525 - 550 , 550 - 575 , 575 - 600 , 600 - 625 , 625 - 650 | ||
| Click To Change The Sort Order: By Market Cap or Company Size Performance: Year-to-date, Week and Day | |
| Select Chart Type: | ||
|
Best Stocks Today 12Stocks.com |
© 2024 12Stocks.com Terms & Conditions Privacy Contact Us
All Information Provided Only For Education And Not To Be Used For Investing or Trading. See Terms & Conditions


One More Thing ... Get Best Stocks Delivered Daily!
Never Ever Miss A Move With Our Top Ten Stocks Lists
Find Best Stocks In Any Market - Bull or Bear Market
Take A Peek At Our Top Ten Stocks Lists: Daily, Weekly, Year-to-Date & Top Trends
Find Best Stocks In Any Market - Bull or Bear Market
Take A Peek At Our Top Ten Stocks Lists: Daily, Weekly, Year-to-Date & Top Trends
Technology Stocks With Best Up Trends [0-bearish to 100-bullish]: Benchmark Electronics[100], FormFactor [100], Q2 [100], TTM [100], JD.com [100], 21Vianet [100], QUALCOMM [100], Itron [100], Baidu [100], Cognex [100], Conduent [100]
Best Technology Stocks Year-to-Date:
MediaCo Holding[402.35%], Bakkt [187.89%], Smith Micro[179.66%], Uxin [178.17%], Super Micro[168.13%], CXApp [164.09%], SoundHound AI[113.32%], NextNav [108.76%], CuriosityStream [105.52%], MediaAlpha [98.56%], GigaCloud [89.46%] Best Technology Stocks This Week:
Bakkt [1506.2%], SYLA [79.9%], Mitcham Industries[28.24%], Koninklijke Philips[26.06%], MediaCo Holding[23.7%], Cogint [21.26%], 21Vianet [21.2%], Harmonic [20.65%], Conduent [20.42%], Phoenix New[20%], Viomi [17.87%] Best Technology Stocks Daily:
CommScope Holding[20.38%], Benchmark Electronics[18.06%], FormFactor [17.64%], Bilibili [15.63%], Maxeon Solar[15.46%], Q2 [15.17%], TTM [12.59%], IAC/InterActiveCorp [12.29%], LivePerson [11.98%], ANGI Homeservices[11.70%], JD.com [11.62%]