
 Login Sign Up


| |||||
 |  | ||||

| 12Stocks.com Market Intelligence |
Best Tech Stocks
| In a hurry? Tech Stocks Lists: Performance & Trends, Stock Charts, FANG Stocks
Sort Tech stocks: Daily, Weekly, Year-to-Date, Market Cap & Trends. Filter Tech stocks list by size:All Tech Large Mid-Range Small and MicroCap |
| 12Stocks.com Tech Stocks Performances & Trends Daily | |||||||||
|
|  The overall Smart Investing & Trading Score is 10 (0-bearish to 100-bullish) which puts Technology sector in short term bearish trend. The Smart Investing & Trading Score from previous trading session is 0 and hence an improvement of trend.
| ||||||||
Here are the Smart Investing & Trading Scores of the most requested Technology stocks at 12Stocks.com (click stock name for detailed review):
|


| 12Stocks.com: Investing in Technology sector with Stocks | |
|
The following table helps investors and traders sort through current performance and trends (as measured by Smart Investing & Trading Score) of various
stocks in the Tech sector. Quick View: Move mouse or cursor over stock symbol (ticker) to view short-term technical chart and over stock name to view long term chart. Click on  to add stock symbol to your watchlist and to add stock symbol to your watchlist and  to view watchlist. Click on any ticker or stock name for detailed market intelligence report for that stock. to view watchlist. Click on any ticker or stock name for detailed market intelligence report for that stock. |
12Stocks.com Performance of Stocks in Tech Sector
| Ticker | Stock Name | Watchlist | Category | Recent Price | Smart Investing & Trading Score | Change % | YTD Change% |
| DUOL | Duolingo |   | Software - | 219.24 | 32 | -0.37% | -3.79% |
| TDC | Teradata | | IT | 37.26 | 32 | -0.29% | -14.36% |
| PANW | Palo Alto | | Networking | 286.82 | 32 | -0.18% | -2.73% |
| TSEM | Tower Semiconductor | | Semiconductor | 32.30 | 32 | -0.03% | 5.83% |
| STX | Seagate | | Data Storage | 85.20 | 32 | -0.71% | -0.20% |
| UMC | United Microelectronics | | Semiconductor | 7.65 | 30 | 1.32% | -9.57% |
| RUN | Sunrun | | Semiconductor | 10.16 | 30 | 0.94% | -48.22% |
| CALX | Calix | | Communication | 27.91 | 30 | 0.09% | -36.13% |
| WIMI | WiMi Hologram | | Advertising Agencies | 0.93 | 30 | 0.00% | 15.78% |
| ALIT | Alight | | Software - | 9.04 | 30 | 0.00% | 6.29% |
| SPOK | Spok | | Wireless | 13.70 | 30 | -12.85% | -11.50% |
| EXFY | Expensify | | Software - | 1.60 | 30 | -1.85% | -36.71% |
| AUDC | AudioCodes | | Communication | 11.03 | 30 | 0.55% | -8.62% |
| RDWR | Radware | | IT | 16.65 | 30 | 0.15% | -0.21% |
| VZIO | VIZIO Holding | | Consumer Electronics | 10.59 | 30 | -0.70% | 37.29% |
| AMPL | Amplitude | | Software - | 9.80 | 29 | 0.00% | -23.20% |
| CTSH | Cognizant | | IT | 66.07 | 28 | 1.07% | -12.52% |
| FSLY | Fastly | | Software | 8.27 | 28 | -36.04% | -53.54% |
| ADI | Analog Devices | | Semiconductor | 193.18 | 28 | -0.37% | -2.71% |
| AIXI | Xiao-I | | Software - | 1.33 | 27 | 8.57% | -40.89% |
| WALD | Waldencast | | Software - | 5.20 | 27 | 3.90% | -54.01% |
| CCSI | Consensus Cloud | | Software - Infrastructure | 12.11 | 27 | 2.71% | -54.53% |
| PERF | Perfect | | Software - | 2.36 | 27 | 2.61% | -23.87% |
| EXLS | ExlService | | IT | 29.75 | 27 | 2.36% | -3.55% |
| MKTW | MarketWise | | Software - | 1.61 | 27 | 1.26% | -40.37% |
| For chart view version of above stock list: Chart View ➞ 0 - 25 , 25 - 50 , 50 - 75 , 75 - 100 , 100 - 125 , 125 - 150 , 150 - 175 , 175 - 200 , 200 - 225 , 225 - 250 , 250 - 275 , 275 - 300 , 300 - 325 , 325 - 350 , 350 - 375 , 375 - 400 , 400 - 425 , 425 - 450 , 450 - 475 , 475 - 500 , 500 - 525 , 525 - 550 , 550 - 575 | ||
 | Click To Change The Sort Order: By Market Cap or Company Size Performance: Year-to-date, Week and Day |  |
|
Get the most comprehensive stock market coverage daily at 12Stocks.com ➞ Best Stocks Today ➞ Best Stocks Weekly ➞ Best Stocks Year-to-Date ➞ Best Stocks Trends ➞  Best Stocks Today 12Stocks.com Best Nasdaq Stocks ➞ Best S&P 500 Stocks ➞ Best Tech Stocks ➞ Best Biotech Stocks ➞ |
| Detailed Overview of Tech Stocks |
| Tech Technical Overview, Leaders & Laggards, Top Tech ETF Funds & Detailed Tech Stocks List, Charts, Trends & More |
| Tech Sector: Technical Analysis, Trends & YTD Performance | |
| Technology sector is composed of stocks
from semiconductors, software, web, social media
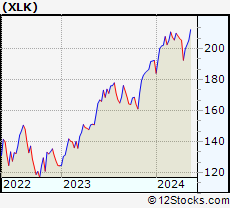
and services subsectors. Technology sector, as represented by XLK, an exchange-traded fund [ETF] that holds basket of tech stocks (e.g, Intel, Google) is up by 1.33% and is currently underperforming the overall market by -3.48% year-to-date. Below is a quick view of technical charts and trends: |
|
 XLK Weekly Chart |
|
| Long Term Trend: Not Good | |
| Medium Term Trend: Not Good | |
 XLK Daily Chart |
|
| Short Term Trend: Not Good | |
| Overall Trend Score: 10 | |
| YTD Performance: 1.33% | |
| **Trend Scores & Views Are Only For Educational Purposes And Not For Investing | |
| 12Stocks.com: Top Performing Technology Sector Stocks | ||||||||||||||||||||||||||||||||||||||||||||||||
 The top performing Technology sector stocks year to date are
Now, more recently, over last week, the top performing Technology sector stocks on the move are


|
||||||||||||||||||||||||||||||||||||||||||||||||
| 12Stocks.com: Investing in Tech Sector using Exchange Traded Funds | |
|
The following table shows list of key exchange traded funds (ETF) that
help investors track Tech Index. For detailed view, check out our ETF Funds section of our website. Quick View: Move mouse or cursor over ETF symbol (ticker) to view short-term technical chart and over ETF name to view long term chart. Click on ticker or stock name for detailed view. Click on to add stock symbol to your watchlist and to view watchlist. |
12Stocks.com List of ETFs that track Tech Index
| Ticker | ETF Name | Watchlist | Recent Price | Smart Investing & Trading Score | Change % | Week % | Year-to-date % |
| XLK | Technology | | 195.04 | 10 | 0.40 | -2.4 | 1.33% |
| TQQQ | QQQ | | 51.84 | 7 | 0.47 | -6.22 | 2.25% |
| SQQQ | Short QQQ | | 12.20 | 88 | -0.20 | 6.69 | -9.33% |
| SOXL | Semicondct Bull 3X | | 34.62 | 7 | 0.71 | -12.92 | 10.24% |
| SMH | Semiconductor | | 208.38 | 7 | 0.25 | -4.25 | 19.16% |
| 12Stocks.com: Charts, Trends, Fundamental Data and Performances of Tech Stocks | |
|
We now take in-depth look at all Tech stocks including charts, multi-period performances and overall trends (as measured by Smart Investing & Trading Score). One can sort Tech stocks (click link to choose) by Daily, Weekly and by Year-to-Date performances. Also, one can sort by size of the company or by market capitalization. |
| Select Your Default Chart Type: | |||||
| |||||
| Click on stock symbol or name for detailed view. Click on to add stock symbol to your watchlist and to view watchlist. Quick View: Move mouse or cursor over "Daily" to quickly view daily technical stock chart and over "Weekly" to view weekly technical stock chart. | |||||


 | DUOL Duolingo, Inc. |
| Sector: Technology | |
| SubSector: Software - Application | |
| MarketCap: 6070 Millions | |
| Recent Price: 219.24 Smart Investing & Trading Score: 32 | |
| Day Percent Change: -0.37% Day Change: -0.81 | |
| Week Change: -1.48% Year-to-date Change: -3.8% | |
| DUOL Links: Profile News Message Board | |
| Charts:- Daily , Weekly | |
| Add DUOL to Watchlist: View: Get Complete DUOL Trend Analysis ➞ | |
 | TDC Teradata Corporation |
| Sector: Technology | |
| SubSector: Information Technology Services | |
| MarketCap: 2229.48 Millions | |
| Recent Price: 37.26 Smart Investing & Trading Score: 32 | |
| Day Percent Change: -0.29% Day Change: -0.11 | |
| Week Change: -1.09% Year-to-date Change: -14.4% | |
| TDC Links: Profile News Message Board | |
| Charts:- Daily , Weekly | |
| Add TDC to Watchlist: View: Get Complete TDC Trend Analysis ➞ | |
 | PANW Palo Alto Networks, Inc. |
| Sector: Technology | |
| SubSector: Networking & Communication Devices | |
| MarketCap: 16039.4 Millions | |
| Recent Price: 286.82 Smart Investing & Trading Score: 32 | |
| Day Percent Change: -0.18% Day Change: -0.52 | |
| Week Change: -1.58% Year-to-date Change: -2.7% | |
| PANW Links: Profile News Message Board | |
| Charts:- Daily , Weekly | |
| Add PANW to Watchlist: View: Get Complete PANW Trend Analysis ➞ | |
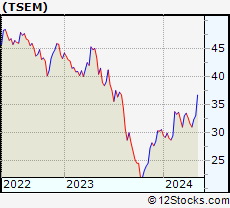 | TSEM Tower Semiconductor Ltd. |
| Sector: Technology | |
| SubSector: Semiconductor - Integrated Circuits | |
| MarketCap: 1745.1 Millions | |
| Recent Price: 32.30 Smart Investing & Trading Score: 32 | |
| Day Percent Change: -0.03% Day Change: -0.01 | |
| Week Change: -0.19% Year-to-date Change: 5.8% | |
| TSEM Links: Profile News Message Board | |
| Charts:- Daily , Weekly | |
| Add TSEM to Watchlist: View: Get Complete TSEM Trend Analysis ➞ | |
 | STX Seagate Technology plc |
| Sector: Technology | |
| SubSector: Data Storage Devices | |
| MarketCap: 10814.7 Millions | |
| Recent Price: 85.20 Smart Investing & Trading Score: 32 | |
| Day Percent Change: -0.71% Day Change: -0.61 | |
| Week Change: -0.98% Year-to-date Change: -0.2% | |
| STX Links: Profile News Message Board | |
| Charts:- Daily , Weekly | |
| Add STX to Watchlist: View: Get Complete STX Trend Analysis ➞ | |
 | UMC United Microelectronics Corporation |
| Sector: Technology | |
| SubSector: Semiconductor Equipment & Materials | |
| MarketCap: 5672.78 Millions | |
| Recent Price: 7.65 Smart Investing & Trading Score: 30 | |
| Day Percent Change: 1.32% Day Change: 0.10 | |
| Week Change: -1.8% Year-to-date Change: -9.6% | |
| UMC Links: Profile News Message Board | |
| Charts:- Daily , Weekly | |
| Add UMC to Watchlist: View: Get Complete UMC Trend Analysis ➞ | |
 | RUN Sunrun Inc. |
| Sector: Technology | |
| SubSector: Semiconductor - Specialized | |
| MarketCap: 1286.2 Millions | |
| Recent Price: 10.16 Smart Investing & Trading Score: 30 | |
| Day Percent Change: 0.94% Day Change: 0.09 | |
| Week Change: -1.21% Year-to-date Change: -48.2% | |
| RUN Links: Profile News Message Board | |
| Charts:- Daily , Weekly | |
| Add RUN to Watchlist: View: Get Complete RUN Trend Analysis ➞ | |
 | CALX Calix, Inc. |
| Sector: Technology | |
| SubSector: Communication Equipment | |
| MarketCap: 390.039 Millions | |
| Recent Price: 27.91 Smart Investing & Trading Score: 30 | |
| Day Percent Change: 0.09% Day Change: 0.03 | |
| Week Change: -1.74% Year-to-date Change: -36.1% | |
| CALX Links: Profile News Message Board | |
| Charts:- Daily , Weekly | |
| Add CALX to Watchlist: View: Get Complete CALX Trend Analysis ➞ | |
 | WIMI WiMi Hologram Cloud Inc. |
| Sector: Technology | |
| SubSector: Advertising Agencies | |
| MarketCap: 41837 Millions | |
| Recent Price: 0.93 Smart Investing & Trading Score: 30 | |
| Day Percent Change: 0.00% Day Change: 0.00 | |
| Week Change: -8.63% Year-to-date Change: 15.8% | |
| WIMI Links: Profile News Message Board | |
| Charts:- Daily , Weekly | |
| Add WIMI to Watchlist: View: Get Complete WIMI Trend Analysis ➞ | |
 | ALIT Alight, Inc. |
| Sector: Technology | |
| SubSector: Software - Application | |
| MarketCap: 5130 Millions | |
| Recent Price: 9.04 Smart Investing & Trading Score: 30 | |
| Day Percent Change: 0.00% Day Change: 0.00 | |
| Week Change: -0.71% Year-to-date Change: 6.3% | |
| ALIT Links: Profile News Message Board | |
| Charts:- Daily , Weekly | |
| Add ALIT to Watchlist: View: Get Complete ALIT Trend Analysis ➞ | |
 | SPOK Spok Holdings, Inc. |
| Sector: Technology | |
| SubSector: Wireless Communications | |
| MarketCap: 220.827 Millions | |
| Recent Price: 13.70 Smart Investing & Trading Score: 30 | |
| Day Percent Change: -12.85% Day Change: -2.02 | |
| Week Change: -13.62% Year-to-date Change: -11.5% | |
| SPOK Links: Profile News Message Board | |
| Charts:- Daily , Weekly | |
| Add SPOK to Watchlist: View: Get Complete SPOK Trend Analysis ➞ | |
 | EXFY Expensify, Inc. |
| Sector: Technology | |
| SubSector: Software - Application | |
| MarketCap: 678 Millions | |
| Recent Price: 1.60 Smart Investing & Trading Score: 30 | |
| Day Percent Change: -1.85% Day Change: -0.03 | |
| Week Change: -2.15% Year-to-date Change: -36.7% | |
| EXFY Links: Profile News Message Board | |
| Charts:- Daily , Weekly | |
| Add EXFY to Watchlist: View: Get Complete EXFY Trend Analysis ➞ | |
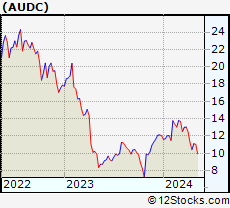 | AUDC AudioCodes Ltd. |
| Sector: Technology | |
| SubSector: Communication Equipment | |
| MarketCap: 642.239 Millions | |
| Recent Price: 11.03 Smart Investing & Trading Score: 30 | |
| Day Percent Change: 0.55% Day Change: 0.06 | |
| Week Change: -0.72% Year-to-date Change: -8.6% | |
| AUDC Links: Profile News Message Board | |
| Charts:- Daily , Weekly | |
| Add AUDC to Watchlist: View: Get Complete AUDC Trend Analysis ➞ | |
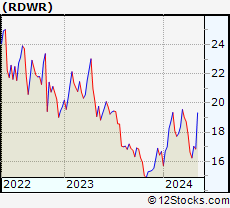 | RDWR Radware Ltd. |
| Sector: Technology | |
| SubSector: Information Technology Services | |
| MarketCap: 974.168 Millions | |
| Recent Price: 16.65 Smart Investing & Trading Score: 30 | |
| Day Percent Change: 0.15% Day Change: 0.02 | |
| Week Change: -2.26% Year-to-date Change: -0.2% | |
| RDWR Links: Profile News Message Board | |
| Charts:- Daily , Weekly | |
| Add RDWR to Watchlist: View: Get Complete RDWR Trend Analysis ➞ | |
 | VZIO VIZIO Holding Corp. |
| Sector: Technology | |
| SubSector: Consumer Electronics | |
| MarketCap: 1300 Millions | |
| Recent Price: 10.59 Smart Investing & Trading Score: 30 | |
| Day Percent Change: -0.70% Day Change: -0.07 | |
| Week Change: -1.53% Year-to-date Change: 37.3% | |
| VZIO Links: Profile News Message Board | |
| Charts:- Daily , Weekly | |
| Add VZIO to Watchlist: View: Get Complete VZIO Trend Analysis ➞ | |
 | AMPL Amplitude, Inc. |
| Sector: Technology | |
| SubSector: Software - Application | |
| MarketCap: 1320 Millions | |
| Recent Price: 9.80 Smart Investing & Trading Score: 29 | |
| Day Percent Change: 0.00% Day Change: 0.00 | |
| Week Change: -1.21% Year-to-date Change: -23.2% | |
| AMPL Links: Profile News Message Board | |
| Charts:- Daily , Weekly | |
| Add AMPL to Watchlist: View: Get Complete AMPL Trend Analysis ➞ | |
 | CTSH Cognizant Technology Solutions Corporation |
| Sector: Technology | |
| SubSector: Information Technology Services | |
| MarketCap: 26249.7 Millions | |
| Recent Price: 66.07 Smart Investing & Trading Score: 28 | |
| Day Percent Change: 1.07% Day Change: 0.70 | |
| Week Change: -1.3% Year-to-date Change: -12.5% | |
| CTSH Links: Profile News Message Board | |
| Charts:- Daily , Weekly | |
| Add CTSH to Watchlist: View: Get Complete CTSH Trend Analysis ➞ | |
 | FSLY Fastly, Inc. |
| Sector: Technology | |
| SubSector: Application Software | |
| MarketCap: 1973.72 Millions | |
| Recent Price: 8.27 Smart Investing & Trading Score: 28 | |
| Day Percent Change: -36.04% Day Change: -4.66 | |
| Week Change: -36.14% Year-to-date Change: -53.5% | |
| FSLY Links: Profile News Message Board | |
| Charts:- Daily , Weekly | |
| Add FSLY to Watchlist: View: Get Complete FSLY Trend Analysis ➞ | |
 | ADI Analog Devices, Inc. |
| Sector: Technology | |
| SubSector: Semiconductor - Integrated Circuits | |
| MarketCap: 32859 Millions | |
| Recent Price: 193.18 Smart Investing & Trading Score: 28 | |
| Day Percent Change: -0.37% Day Change: -0.71 | |
| Week Change: -4.35% Year-to-date Change: -2.7% | |
| ADI Links: Profile News Message Board | |
| Charts:- Daily , Weekly | |
| Add ADI to Watchlist: View: Get Complete ADI Trend Analysis ➞ | |
 | AIXI Xiao-I Corporation |
| Sector: Technology | |
| SubSector: Software - Application | |
| MarketCap: 431 Millions | |
| Recent Price: 1.33 Smart Investing & Trading Score: 27 | |
| Day Percent Change: 8.57% Day Change: 0.10 | |
| Week Change: 3.91% Year-to-date Change: -40.9% | |
| AIXI Links: Profile News Message Board | |
| Charts:- Daily , Weekly | |
| Add AIXI to Watchlist: View: Get Complete AIXI Trend Analysis ➞ | |
 | WALD Waldencast plc |
| Sector: Technology | |
| SubSector: Software - Application | |
| MarketCap: 897 Millions | |
| Recent Price: 5.20 Smart Investing & Trading Score: 27 | |
| Day Percent Change: 3.90% Day Change: 0.20 | |
| Week Change: 0.87% Year-to-date Change: -54.0% | |
| WALD Links: Profile News Message Board | |
| Charts:- Daily , Weekly | |
| Add WALD to Watchlist: View: Get Complete WALD Trend Analysis ➞ | |
 | CCSI Consensus Cloud Solutions, Inc. |
| Sector: Technology | |
| SubSector: Software - Infrastructure | |
| MarketCap: 609 Millions | |
| Recent Price: 12.11 Smart Investing & Trading Score: 27 | |
| Day Percent Change: 2.71% Day Change: 0.32 | |
| Week Change: -1.3% Year-to-date Change: -54.5% | |
| CCSI Links: Profile News Message Board | |
| Charts:- Daily , Weekly | |
| Add CCSI to Watchlist: View: Get Complete CCSI Trend Analysis ➞ | |
 | PERF Perfect Corp. |
| Sector: Technology | |
| SubSector: Software - Application | |
| MarketCap: 582 Millions | |
| Recent Price: 2.36 Smart Investing & Trading Score: 27 | |
| Day Percent Change: 2.61% Day Change: 0.06 | |
| Week Change: 0% Year-to-date Change: -23.9% | |
| PERF Links: Profile News Message Board | |
| Charts:- Daily , Weekly | |
| Add PERF to Watchlist: View: Get Complete PERF Trend Analysis ➞ | |
 | EXLS ExlService Holdings, Inc. |
| Sector: Technology | |
| SubSector: Information Technology Services | |
| MarketCap: 1781.78 Millions | |
| Recent Price: 29.75 Smart Investing & Trading Score: 27 | |
| Day Percent Change: 2.36% Day Change: 0.68 | |
| Week Change: 1.35% Year-to-date Change: -3.6% | |
| EXLS Links: Profile News Message Board | |
| Charts:- Daily , Weekly | |
| Add EXLS to Watchlist: View: Get Complete EXLS Trend Analysis ➞ | |
 | MKTW MarketWise, Inc. |
| Sector: Technology | |
| SubSector: Software - Application | |
| MarketCap: 646 Millions | |
| Recent Price: 1.61 Smart Investing & Trading Score: 27 | |
| Day Percent Change: 1.26% Day Change: 0.02 | |
| Week Change: 0.31% Year-to-date Change: -40.4% | |
| MKTW Links: Profile News Message Board | |
| Charts:- Daily , Weekly | |
| Add MKTW to Watchlist: View: Get Complete MKTW Trend Analysis ➞ | |
| For tabular summary view of above stock list: Summary View ➞ 0 - 25 , 25 - 50 , 50 - 75 , 75 - 100 , 100 - 125 , 125 - 150 , 150 - 175 , 175 - 200 , 200 - 225 , 225 - 250 , 250 - 275 , 275 - 300 , 300 - 325 , 325 - 350 , 350 - 375 , 375 - 400 , 400 - 425 , 425 - 450 , 450 - 475 , 475 - 500 , 500 - 525 , 525 - 550 , 550 - 575 | ||
| Click To Change The Sort Order: By Market Cap or Company Size Performance: Year-to-date, Week and Day | |
| Select Chart Type: | ||
|
Best Stocks Today 12Stocks.com |
© 2024 12Stocks.com Terms & Conditions Privacy Contact Us
All Information Provided Only For Education And Not To Be Used For Investing or Trading. See Terms & Conditions


One More Thing ... Get Best Stocks Delivered Daily!
Never Ever Miss A Move With Our Top Ten Stocks Lists
Find Best Stocks In Any Market - Bull or Bear Market
Take A Peek At Our Top Ten Stocks Lists: Daily, Weekly, Year-to-Date & Top Trends
Find Best Stocks In Any Market - Bull or Bear Market
Take A Peek At Our Top Ten Stocks Lists: Daily, Weekly, Year-to-Date & Top Trends
Technology Stocks With Best Up Trends [0-bearish to 100-bullish]: QUALCOMM [100], 21Vianet [100], Baidu [100], GDS [100], Liberty Latin[100], Liberty Latin[100], CTS [100], Plexus [100], Silicom [100], Universal Electronics[100], Snap [100]
Best Technology Stocks Year-to-Date:
MediaCo Holding[439.91%], Uxin [183.88%], Bakkt [169.51%], CXApp [163.71%], Super Micro[150.63%], MediaAlpha [115.2%], SoundHound AI[108.41%], NextNav [107.42%], CuriosityStream [105.52%], Cheetah Mobile[81.36%], AppLovin [79.65%] Best Technology Stocks This Week:
Bakkt [1403.63%], SYLA [67.53%], MediaCo Holding[32.95%], MediaAlpha [26.88%], Koninklijke Philips[26.29%], Mitcham Industries[24.94%], Phoenix New[21.71%], Harmonic [19.35%], 21Vianet [18.67%], Cogint [16.28%], Quantum [15.48%] Best Technology Stocks Daily:
Benchmark Electronics[17.86%], MediaAlpha [13.63%], FormFactor [13.18%], TTM [11.44%], Kingsoft Cloud[10.74%], QUALCOMM [8.83%], Xiao-I [8.57%], Intchains [8.40%], Criteo S.A[8.21%], 21Vianet [7.76%], Cognex [7.52%]