
 Login Sign Up


| |||||
 |  | ||||

| 12Stocks.com Market Intelligence |
Best Tech Stocks
| In a hurry? Tech Stocks Lists: Performance & Trends, Stock Charts, FANG Stocks
Sort Tech stocks: Daily, Weekly, Year-to-Date, Market Cap & Trends. Filter Tech stocks list by size:All Tech Large Mid-Range Small and MicroCap |
| 12Stocks.com Tech Stocks Performances & Trends Daily | |||||||||
|
|  The overall Smart Investing & Trading Score is 10 (0-bearish to 100-bullish) which puts Technology sector in short term bearish trend. The Smart Investing & Trading Score from previous trading session is 0 and hence an improvement of trend.
| ||||||||
Here are the Smart Investing & Trading Scores of the most requested Technology stocks at 12Stocks.com (click stock name for detailed review):
|


| 12Stocks.com: Investing in Technology sector with Stocks | |
|
The following table helps investors and traders sort through current performance and trends (as measured by Smart Investing & Trading Score) of various
stocks in the Tech sector. Quick View: Move mouse or cursor over stock symbol (ticker) to view short-term technical chart and over stock name to view long term chart. Click on  to add stock symbol to your watchlist and to add stock symbol to your watchlist and  to view watchlist. Click on any ticker or stock name for detailed market intelligence report for that stock. to view watchlist. Click on any ticker or stock name for detailed market intelligence report for that stock. |
12Stocks.com Performance of Stocks in Tech Sector
| Ticker | Stock Name | Watchlist | Category | Recent Price | Smart Investing & Trading Score | Change % | YTD Change% |
| EPAM | EPAM Systems |   | IT | 238.18 | 35 | 1.36% | -19.90% |
| BR | Broadridge Financial | | IT | 195.35 | 35 | 0.99% | -5.05% |
| PRGS | Progress Software | | Software | 50.44 | 35 | 0.66% | -7.11% |
| INFY | Infosys | | IT | 16.87 | 35 | 0.60% | -8.22% |
| GSAT | Globalstar | | Wireless | 1.29 | 35 | 0.00% | -33.51% |
| PDFS | | Software | 31.13 | 34 | 3.56% | -3.14% | |
| SYT | SYLA | | Software - | 3.49 | 34 | 3.56% | -38.88% |
| MEI | Methode Electronics | | Electronics | 12.27 | 34 | 3.46% | -46.02% |
| BIGC | BigCommerce | | Software | 5.99 | 34 | 2.74% | -38.50% |
| APPF | AppFolio | | Software | 236.05 | 34 | 2.58% | 36.26% |
| SCSC | ScanSource | | Software | 42.44 | 34 | 2.34% | 7.14% |
| PATH | UiPath | | Software - Infrastructure | 19.23 | 34 | 0.97% | -22.63% |
| NABL | N-able | | IT | 12.39 | 34 | 0.65% | -6.88% |
| VMEO | Vimeo | | Software - | 3.64 | 34 | 0.14% | -7.26% |
| MTSI | MACOM | | Semiconductor | 98.98 | 33 | -0.14% | 6.49% |
| BLND | Blend Labs | | Software - | 2.42 | 32 | 5.22% | -5.47% |
| ATNI | ATN | | Telecom | 21.03 | 32 | 4.32% | -46.04% |
| PCOR | Procore | | Software - | 71.52 | 32 | 4.03% | 2.35% |
| NFLX | Netflix | | CATV | 565.15 | 32 | 2.44% | 16.08% |
| AGMH | AGM | | Software | 1.08 | 32 | 1.89% | -40.33% |
| ON | ON Semiconductor | | Semiconductor | 70.01 | 32 | 1.45% | -16.19% |
| GRPN | on | | Internet | 11.28 | 32 | 1.44% | -12.15% |
| MORN | Morningstar | | IT | 290.98 | 32 | 1.27% | 1.66% |
| VTEX | VTEX | | Software - | 7.49 | 32 | 1.08% | 9.42% |
| SANM | Sanmina | | Electronics | 61.49 | 32 | 0.94% | 19.70% |
| For chart view version of above stock list: Chart View ➞ 0 - 25 , 25 - 50 , 50 - 75 , 75 - 100 , 100 - 125 , 125 - 150 , 150 - 175 , 175 - 200 , 200 - 225 , 225 - 250 , 250 - 275 , 275 - 300 , 300 - 325 , 325 - 350 , 350 - 375 , 375 - 400 , 400 - 425 , 425 - 450 , 450 - 475 , 475 - 500 , 500 - 525 , 525 - 550 , 550 - 575 , 575 - 600 , 600 - 625 , 625 - 650 | ||
 | Click To Change The Sort Order: By Market Cap or Company Size Performance: Year-to-date, Week and Day |  |
|
Get the most comprehensive stock market coverage daily at 12Stocks.com ➞ Best Stocks Today ➞ Best Stocks Weekly ➞ Best Stocks Year-to-Date ➞ Best Stocks Trends ➞  Best Stocks Today 12Stocks.com Best Nasdaq Stocks ➞ Best S&P 500 Stocks ➞ Best Tech Stocks ➞ Best Biotech Stocks ➞ |
| Detailed Overview of Tech Stocks |
| Tech Technical Overview, Leaders & Laggards, Top Tech ETF Funds & Detailed Tech Stocks List, Charts, Trends & More |
| Tech Sector: Technical Analysis, Trends & YTD Performance | |
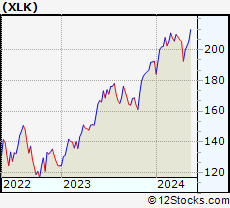
| Technology sector is composed of stocks
from semiconductors, software, web, social media
and services subsectors. Technology sector, as represented by XLK, an exchange-traded fund [ETF] that holds basket of tech stocks (e.g, Intel, Google) is up by 2.38% and is currently underperforming the overall market by -3.24% year-to-date. Below is a quick view of technical charts and trends: |
|
 XLK Weekly Chart |
|
| Long Term Trend: Not Good | |
| Medium Term Trend: Not Good | |
 XLK Daily Chart |
|
| Short Term Trend: Deteriorating | |
| Overall Trend Score: 10 | |
| YTD Performance: 2.38% | |
| **Trend Scores & Views Are Only For Educational Purposes And Not For Investing | |
| 12Stocks.com: Top Performing Technology Sector Stocks | ||||||||||||||||||||||||||||||||||||||||||||||||
 The top performing Technology sector stocks year to date are
Now, more recently, over last week, the top performing Technology sector stocks on the move are


|
||||||||||||||||||||||||||||||||||||||||||||||||
| 12Stocks.com: Investing in Tech Sector using Exchange Traded Funds | |
|
The following table shows list of key exchange traded funds (ETF) that
help investors track Tech Index. For detailed view, check out our ETF Funds section of our website. Quick View: Move mouse or cursor over ETF symbol (ticker) to view short-term technical chart and over ETF name to view long term chart. Click on ticker or stock name for detailed view. Click on to add stock symbol to your watchlist and to view watchlist. |
12Stocks.com List of ETFs that track Tech Index
| Ticker | ETF Name | Watchlist | Recent Price | Smart Investing & Trading Score | Change % | Week % | Year-to-date % |
| XLK | Technology | | 197.06 | 10 | 1.44 | -1.39 | 2.38% |
| QQQ | QQQ | | 426.90 | 17 | 1.28 | -0.95 | 4.24% |
| IYW | Technology | | 129.01 | 10 | 1.62 | -1.48 | 5.1% |
| VGT | Information Technology | | 496.06 | 17 | 1.37 | -1.56 | 2.49% |
| IXN | Global Tech | | 70.86 | 10 | 1.48 | -1.31 | 3.93% |
| IGV | Tech-Software | | 79.91 | 10 | 1.06 | -1.46 | -1.5% |
| XSD | Semiconductor | | 221.13 | 25 | 1.75 | -1.58 | -1.63% |
| TQQQ | QQQ | | 53.53 | 17 | 3.74 | -3.17 | 5.58% |
| SQQQ | Short QQQ | | 11.78 | 78 | -3.60 | 3.06 | -12.42% |
| SOXL | Semicondct Bull 3X | | 36.45 | 17 | 6.05 | -8.3 | 16.08% |
| SOXS | Semicondct Bear 3X | | 37.60 | 66 | -6.54 | 7.12 | 546.05% |
| SOXX | PHLX Semiconductor | | 211.41 | 7 | 2.25 | -2.53 | 10.09% |
| QTEC | First -100-Tech | | 180.14 | 10 | 1.58 | -2.09 | 2.66% |
| SMH | Semiconductor | | 212.03 | 30 | 2.01 | -2.58 | 21.25% |
| 12Stocks.com: Charts, Trends, Fundamental Data and Performances of Tech Stocks | |
|
We now take in-depth look at all Tech stocks including charts, multi-period performances and overall trends (as measured by Smart Investing & Trading Score). One can sort Tech stocks (click link to choose) by Daily, Weekly and by Year-to-Date performances. Also, one can sort by size of the company or by market capitalization. |
| Select Your Default Chart Type: | |||||
| |||||
| Click on stock symbol or name for detailed view. Click on to add stock symbol to your watchlist and to view watchlist. Quick View: Move mouse or cursor over "Daily" to quickly view daily technical stock chart and over "Weekly" to view weekly technical stock chart. | |||||


 | EPAM EPAM Systems, Inc. |
| Sector: Technology | |
| SubSector: Information Technology Services | |
| MarketCap: 11519.6 Millions | |
| Recent Price: 238.18 Smart Investing & Trading Score: 35 | |
| Day Percent Change: 1.36% Day Change: 3.20 | |
| Week Change: 0.18% Year-to-date Change: -19.9% | |
| EPAM Links: Profile News Message Board | |
| Charts:- Daily , Weekly | |
| Add EPAM to Watchlist: View: Get Complete EPAM Trend Analysis ➞ | |
 | BR Broadridge Financial Solutions, Inc. |
| Sector: Technology | |
| SubSector: Information Technology Services | |
| MarketCap: 10633.8 Millions | |
| Recent Price: 195.35 Smart Investing & Trading Score: 35 | |
| Day Percent Change: 0.99% Day Change: 1.92 | |
| Week Change: 0.62% Year-to-date Change: -5.1% | |
| BR Links: Profile News Message Board | |
| Charts:- Daily , Weekly | |
| Add BR to Watchlist: View: Get Complete BR Trend Analysis ➞ | |
 | PRGS Progress Software Corporation |
| Sector: Technology | |
| SubSector: Application Software | |
| MarketCap: 1407.22 Millions | |
| Recent Price: 50.44 Smart Investing & Trading Score: 35 | |
| Day Percent Change: 0.66% Day Change: 0.33 | |
| Week Change: 0.2% Year-to-date Change: -7.1% | |
| PRGS Links: Profile News Message Board | |
| Charts:- Daily , Weekly | |
| Add PRGS to Watchlist: View: Get Complete PRGS Trend Analysis ➞ | |
 | INFY Infosys Limited |
| Sector: Technology | |
| SubSector: Information Technology Services | |
| MarketCap: 33819.1 Millions | |
| Recent Price: 16.87 Smart Investing & Trading Score: 35 | |
| Day Percent Change: 0.60% Day Change: 0.10 | |
| Week Change: -0.41% Year-to-date Change: -8.2% | |
| INFY Links: Profile News Message Board | |
| Charts:- Daily , Weekly | |
| Add INFY to Watchlist: View: Get Complete INFY Trend Analysis ➞ | |
 | GSAT Globalstar, Inc. |
| Sector: Technology | |
| SubSector: Wireless Communications | |
| MarketCap: 485.127 Millions | |
| Recent Price: 1.29 Smart Investing & Trading Score: 35 | |
| Day Percent Change: 0.00% Day Change: 0.00 | |
| Week Change: 0% Year-to-date Change: -33.5% | |
| GSAT Links: Profile News Message Board | |
| Charts:- Daily , Weekly | |
| Add GSAT to Watchlist: View: Get Complete GSAT Trend Analysis ➞ | |
 | PDFS PDF Solutions, Inc. |
| Sector: Technology | |
| SubSector: Technical & System Software | |
| MarketCap: 345.1 Millions | |
| Recent Price: 31.13 Smart Investing & Trading Score: 34 | |
| Day Percent Change: 3.56% Day Change: 1.07 | |
| Week Change: 0.29% Year-to-date Change: -3.1% | |
| PDFS Links: Profile News Message Board | |
| Charts:- Daily , Weekly | |
| Add PDFS to Watchlist: View: Get Complete PDFS Trend Analysis ➞ | |
 | SYT SYLA Technologies Co., Ltd. |
| Sector: Technology | |
| SubSector: Software - Application | |
| MarketCap: 187 Millions | |
| Recent Price: 3.49 Smart Investing & Trading Score: 34 | |
| Day Percent Change: 3.56% Day Change: 0.12 | |
| Week Change: 79.9% Year-to-date Change: -38.9% | |
| SYT Links: Profile News Message Board | |
| Charts:- Daily , Weekly | |
| Add SYT to Watchlist: View: Get Complete SYT Trend Analysis ➞ | |
 | MEI Methode Electronics, Inc. |
| Sector: Technology | |
| SubSector: Diversified Electronics | |
| MarketCap: 941.896 Millions | |
| Recent Price: 12.27 Smart Investing & Trading Score: 34 | |
| Day Percent Change: 3.46% Day Change: 0.41 | |
| Week Change: 0.41% Year-to-date Change: -46.0% | |
| MEI Links: Profile News Message Board | |
| Charts:- Daily , Weekly | |
| Add MEI to Watchlist: View: Get Complete MEI Trend Analysis ➞ | |
 | BIGC BigCommerce Holdings, Inc. |
| Sector: Technology | |
| SubSector: Software Application | |
| MarketCap: 47587 Millions | |
| Recent Price: 5.99 Smart Investing & Trading Score: 34 | |
| Day Percent Change: 2.74% Day Change: 0.16 | |
| Week Change: 1.53% Year-to-date Change: -38.5% | |
| BIGC Links: Profile News Message Board | |
| Charts:- Daily , Weekly | |
| Add BIGC to Watchlist: View: Get Complete BIGC Trend Analysis ➞ | |
 | APPF AppFolio, Inc. |
| Sector: Technology | |
| SubSector: Application Software | |
| MarketCap: 3412.02 Millions | |
| Recent Price: 236.05 Smart Investing & Trading Score: 34 | |
| Day Percent Change: 2.58% Day Change: 5.94 | |
| Week Change: -2.76% Year-to-date Change: 36.3% | |
| APPF Links: Profile News Message Board | |
| Charts:- Daily , Weekly | |
| Add APPF to Watchlist: View: Get Complete APPF Trend Analysis ➞ | |
 | SCSC ScanSource, Inc. |
| Sector: Technology | |
| SubSector: Technical & System Software | |
| MarketCap: 541 Millions | |
| Recent Price: 42.44 Smart Investing & Trading Score: 34 | |
| Day Percent Change: 2.34% Day Change: 0.97 | |
| Week Change: 1.12% Year-to-date Change: 7.1% | |
| SCSC Links: Profile News Message Board | |
| Charts:- Daily , Weekly | |
| Add SCSC to Watchlist: View: Get Complete SCSC Trend Analysis ➞ | |
 | PATH UiPath Inc. |
| Sector: Technology | |
| SubSector: Software - Infrastructure | |
| MarketCap: 9580 Millions | |
| Recent Price: 19.23 Smart Investing & Trading Score: 34 | |
| Day Percent Change: 0.97% Day Change: 0.18 | |
| Week Change: -1.18% Year-to-date Change: -22.6% | |
| PATH Links: Profile News Message Board | |
| Charts:- Daily , Weekly | |
| Add PATH to Watchlist: View: Get Complete PATH Trend Analysis ➞ | |
 | NABL N-able, Inc. |
| Sector: Technology | |
| SubSector: Information Technology Services | |
| MarketCap: 2590 Millions | |
| Recent Price: 12.39 Smart Investing & Trading Score: 34 | |
| Day Percent Change: 0.65% Day Change: 0.08 | |
| Week Change: -0.08% Year-to-date Change: -6.9% | |
| NABL Links: Profile News Message Board | |
| Charts:- Daily , Weekly | |
| Add NABL to Watchlist: View: Get Complete NABL Trend Analysis ➞ | |
 | VMEO Vimeo, Inc. |
| Sector: Technology | |
| SubSector: Software - Application | |
| MarketCap: 678 Millions | |
| Recent Price: 3.64 Smart Investing & Trading Score: 34 | |
| Day Percent Change: 0.14% Day Change: 0.01 | |
| Week Change: -1.36% Year-to-date Change: -7.3% | |
| VMEO Links: Profile News Message Board | |
| Charts:- Daily , Weekly | |
| Add VMEO to Watchlist: View: Get Complete VMEO Trend Analysis ➞ | |
 | MTSI MACOM Technology Solutions Holdings, Inc. |
| Sector: Technology | |
| SubSector: Semiconductor - Broad Line | |
| MarketCap: 1214.42 Millions | |
| Recent Price: 98.98 Smart Investing & Trading Score: 33 | |
| Day Percent Change: -0.14% Day Change: -0.14 | |
| Week Change: -2.68% Year-to-date Change: 6.5% | |
| MTSI Links: Profile News Message Board | |
| Charts:- Daily , Weekly | |
| Add MTSI to Watchlist: View: Get Complete MTSI Trend Analysis ➞ | |
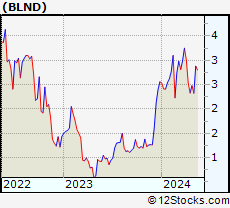 | BLND Blend Labs, Inc. |
| Sector: Technology | |
| SubSector: Software - Application | |
| MarketCap: 210 Millions | |
| Recent Price: 2.42 Smart Investing & Trading Score: 32 | |
| Day Percent Change: 5.22% Day Change: 0.12 | |
| Week Change: -2.42% Year-to-date Change: -5.5% | |
| BLND Links: Profile News Message Board | |
| Charts:- Daily , Weekly | |
| Add BLND to Watchlist: View: Get Complete BLND Trend Analysis ➞ | |
 | ATNI ATN International, Inc. |
| Sector: Technology | |
| SubSector: Telecom Services - Domestic | |
| MarketCap: 1014.77 Millions | |
| Recent Price: 21.03 Smart Investing & Trading Score: 32 | |
| Day Percent Change: 4.32% Day Change: 0.87 | |
| Week Change: 7.74% Year-to-date Change: -46.0% | |
| ATNI Links: Profile News Message Board | |
| Charts:- Daily , Weekly | |
| Add ATNI to Watchlist: View: Get Complete ATNI Trend Analysis ➞ | |
 | PCOR Procore Technologies, Inc. |
| Sector: Technology | |
| SubSector: Software - Application | |
| MarketCap: 9180 Millions | |
| Recent Price: 71.52 Smart Investing & Trading Score: 32 | |
| Day Percent Change: 4.03% Day Change: 2.77 | |
| Week Change: 2.04% Year-to-date Change: 2.4% | |
| PCOR Links: Profile News Message Board | |
| Charts:- Daily , Weekly | |
| Add PCOR to Watchlist: View: Get Complete PCOR Trend Analysis ➞ | |
 | NFLX Netflix, Inc. |
| Sector: Technology | |
| SubSector: CATV Systems | |
| MarketCap: 162108 Millions | |
| Recent Price: 565.15 Smart Investing & Trading Score: 32 | |
| Day Percent Change: 2.44% Day Change: 13.44 | |
| Week Change: 0.7% Year-to-date Change: 16.1% | |
| NFLX Links: Profile News Message Board | |
| Charts:- Daily , Weekly | |
| Add NFLX to Watchlist: View: Get Complete NFLX Trend Analysis ➞ | |
 | AGMH AGM Group Holdings Inc. |
| Sector: Technology | |
| SubSector: Application Software | |
| MarketCap: 320.362 Millions | |
| Recent Price: 1.08 Smart Investing & Trading Score: 32 | |
| Day Percent Change: 1.89% Day Change: 0.02 | |
| Week Change: 1.89% Year-to-date Change: -40.3% | |
| AGMH Links: Profile News Message Board | |
| Charts:- Daily , Weekly | |
| Add AGMH to Watchlist: View: Get Complete AGMH Trend Analysis ➞ | |
 | ON ON Semiconductor Corporation |
| Sector: Technology | |
| SubSector: Semiconductor - Broad Line | |
| MarketCap: 5183.82 Millions | |
| Recent Price: 70.01 Smart Investing & Trading Score: 32 | |
| Day Percent Change: 1.45% Day Change: 1.00 | |
| Week Change: 2.87% Year-to-date Change: -16.2% | |
| ON Links: Profile News Message Board | |
| Charts:- Daily , Weekly | |
| Add ON to Watchlist: View: Get Complete ON Trend Analysis ➞ | |
 | GRPN Groupon, Inc. |
| Sector: Technology | |
| SubSector: Internet Information Providers | |
| MarketCap: 363.18 Millions | |
| Recent Price: 11.28 Smart Investing & Trading Score: 32 | |
| Day Percent Change: 1.44% Day Change: 0.16 | |
| Week Change: -3.34% Year-to-date Change: -12.2% | |
| GRPN Links: Profile News Message Board | |
| Charts:- Daily , Weekly | |
| Add GRPN to Watchlist: View: Get Complete GRPN Trend Analysis ➞ | |
 | MORN Morningstar, Inc. |
| Sector: Technology | |
| SubSector: Information & Delivery Services | |
| MarketCap: 4997.87 Millions | |
| Recent Price: 290.98 Smart Investing & Trading Score: 32 | |
| Day Percent Change: 1.27% Day Change: 3.64 | |
| Week Change: 1.64% Year-to-date Change: 1.7% | |
| MORN Links: Profile News Message Board | |
| Charts:- Daily , Weekly | |
| Add MORN to Watchlist: View: Get Complete MORN Trend Analysis ➞ | |
 | VTEX VTEX |
| Sector: Technology | |
| SubSector: Software - Application | |
| MarketCap: 919 Millions | |
| Recent Price: 7.49 Smart Investing & Trading Score: 32 | |
| Day Percent Change: 1.08% Day Change: 0.08 | |
| Week Change: 0.4% Year-to-date Change: 9.4% | |
| VTEX Links: Profile News Message Board | |
| Charts:- Daily , Weekly | |
| Add VTEX to Watchlist: View: Get Complete VTEX Trend Analysis ➞ | |
 | SANM Sanmina Corporation |
| Sector: Technology | |
| SubSector: Diversified Electronics | |
| MarketCap: 1790.36 Millions | |
| Recent Price: 61.49 Smart Investing & Trading Score: 32 | |
| Day Percent Change: 0.94% Day Change: 0.57 | |
| Week Change: -2.35% Year-to-date Change: 19.7% | |
| SANM Links: Profile News Message Board | |
| Charts:- Daily , Weekly | |
| Add SANM to Watchlist: View: Get Complete SANM Trend Analysis ➞ | |
| For tabular summary view of above stock list: Summary View ➞ 0 - 25 , 25 - 50 , 50 - 75 , 75 - 100 , 100 - 125 , 125 - 150 , 150 - 175 , 175 - 200 , 200 - 225 , 225 - 250 , 250 - 275 , 275 - 300 , 300 - 325 , 325 - 350 , 350 - 375 , 375 - 400 , 400 - 425 , 425 - 450 , 450 - 475 , 475 - 500 , 500 - 525 , 525 - 550 , 550 - 575 , 575 - 600 , 600 - 625 , 625 - 650 | ||
| Click To Change The Sort Order: By Market Cap or Company Size Performance: Year-to-date, Week and Day | |
| Select Chart Type: | ||
|
Best Stocks Today 12Stocks.com |
© 2024 12Stocks.com Terms & Conditions Privacy Contact Us
All Information Provided Only For Education And Not To Be Used For Investing or Trading. See Terms & Conditions


One More Thing ... Get Best Stocks Delivered Daily!
Never Ever Miss A Move With Our Top Ten Stocks Lists
Find Best Stocks In Any Market - Bull or Bear Market
Take A Peek At Our Top Ten Stocks Lists: Daily, Weekly, Year-to-Date & Top Trends
Find Best Stocks In Any Market - Bull or Bear Market
Take A Peek At Our Top Ten Stocks Lists: Daily, Weekly, Year-to-Date & Top Trends
Technology Stocks With Best Up Trends [0-bearish to 100-bullish]: Benchmark Electronics[100], FormFactor [100], Q2 [100], TTM [100], JD.com [100], 21Vianet [100], QUALCOMM [100], Itron [100], Baidu [100], Cognex [100], Conduent [100]
Best Technology Stocks Year-to-Date:
MediaCo Holding[402.35%], Bakkt [187.89%], Smith Micro[178.45%], Uxin [176.75%], Super Micro[168.25%], CXApp [164.09%], SoundHound AI[113.32%], NextNav [108.76%], CuriosityStream [105.52%], MediaAlpha [98.56%], GigaCloud [89.46%] Best Technology Stocks This Week:
Bakkt [1506.2%], SYLA [79.9%], Mitcham Industries[29.66%], Koninklijke Philips[26.06%], MediaCo Holding[23.7%], Cogint [21.1%], 21Vianet [20.89%], Harmonic [20.65%], Conduent [20.26%], Phoenix New[20%], MediaAlpha [17.07%] Best Technology Stocks Daily:
CommScope Holding[20.95%], Benchmark Electronics[18.06%], FormFactor [17.64%], Bilibili [15.63%], Maxeon Solar[15.46%], Q2 [15.17%], TTM [12.73%], IAC/InterActiveCorp [12.14%], ANGI Homeservices[11.93%], Kingsoft Cloud[11.54%], JD.com [11.51%]