
 Login Sign Up


| |||||
 |  | ||||

| 12Stocks.com Market Intelligence |
Best Tech Stocks
| In a hurry? Tech Stocks Lists: Performance & Trends, Stock Charts, FANG Stocks
Sort Tech stocks: Daily, Weekly, Year-to-Date, Market Cap & Trends. Filter Tech stocks list by size:All Tech Large Mid-Range Small and MicroCap |
| 12Stocks.com Tech Stocks Performances & Trends Daily | |||||||||
|
|  The overall Smart Investing & Trading Score is 100 (0-bearish to 100-bullish) which puts Technology sector in short term bullish trend. The Smart Investing & Trading Score from previous trading session is 80 and an improvement of trend continues.
| ||||||||
Here are the Smart Investing & Trading Scores of the most requested Technology stocks at 12Stocks.com (click stock name for detailed review):
|


| 12Stocks.com: Investing in Technology sector with Stocks | |
|
The following table helps investors and traders sort through current performance and trends (as measured by Smart Investing & Trading Score) of various
stocks in the Tech sector. Quick View: Move mouse or cursor over stock symbol (ticker) to view short-term technical chart and over stock name to view long term chart. Click on  to add stock symbol to your watchlist and to add stock symbol to your watchlist and  to view watchlist. Click on any ticker or stock name for detailed market intelligence report for that stock. to view watchlist. Click on any ticker or stock name for detailed market intelligence report for that stock. |
12Stocks.com Performance of Stocks in Tech Sector
| Ticker | Stock Name | Watchlist | Category | Recent Price | Smart Investing & Trading Score | Change % | YTD Change% |
| SMCI | Super Micro |   | Networking | 774.74 | 25 | 0.93% | 172.55% |
| RCM | R1 RCM | | Healthcare Information | 12.41 | 25 | 0.73% | 17.41% |
| QNST | QuinStreet | | Internet | 16.88 | 25 | 0.60% | 31.63% |
| BR | Broadridge Financial | | IT | 196.96 | 25 | 0.15% | -4.27% |
| ENFN | Enfusion | | Software - | 8.56 | 25 | 0.00% | -13.17% |
| CSCO | Cisco Systems | | Communication | 45.62 | 25 | -0.33% | -9.70% |
| DLB | Dolby | | Electronics | 79.02 | 25 | -0.27% | -8.31% |
| MLNK | MeridianLink | | Software - | 21.02 | 24 | 1.59% | -15.14% |
| TXG | 10x Genomics | | Healthcare Information | 21.35 | 24 | -1.07% | -61.85% |
| UPLD | Upland Software | | Software | 2.48 | 22 | 2.90% | -41.37% |
| FLYW | Flywire | | Software - Infrastructure | 16.90 | 22 | 2.58% | -27.87% |
| LPSN | LivePerson | | Software | 0.60 | 22 | -4.29% | -84.06% |
| MYNA | Mynaric AG | | Communication | 4.58 | 22 | -0.43% | -26.01% |
| BIDU | Baidu | | Internet | 94.38 | 20 | 0.46% | -20.75% |
| SYT | SYLA | | Software - | 2.31 | 20 | 0.00% | -59.54% |
| VLD | Velo3D | | Computer Hardware | 0.12 | 20 | -4.75% | -68.36% |
| DLO | DLocal | | Software - Infrastructure | 7.67 | 20 | -3.28% | -56.67% |
| WDAY | Workday | | Software | 210.93 | 20 | -1.49% | -23.59% |
| NTCT | NetScout Systems | | Software | 18.60 | 20 | -1.17% | -15.26% |
| VHC | VirnetX Holding | | Internet | 3.60 | 20 | -0.55% | -48.57% |
| COGT | Cogint | | Software | 9.04 | 19 | 2.49% | 53.74% |
| SOUN | SoundHound AI | | Software - | 4.66 | 18 | 0.11% | 117.52% |
| RGTI | Rigetti Computing | | Computer Hardware | 1.01 | 18 | -3.33% | 3.56% |
| ROKU | Roku | | CATV | 56.36 | 18 | -3.11% | -38.51% |
| BLND | Blend Labs | | Software - | 2.64 | 17 | 6.45% | 3.13% |
| For chart view version of above stock list: Chart View ➞ 0 - 25 , 25 - 50 , 50 - 75 , 75 - 100 , 100 - 125 , 125 - 150 , 150 - 175 , 175 - 200 , 200 - 225 , 225 - 250 , 250 - 275 , 275 - 300 , 300 - 325 , 325 - 350 , 350 - 375 , 375 - 400 , 400 - 425 , 425 - 450 , 450 - 475 , 475 - 500 , 500 - 525 , 525 - 550 , 550 - 575 , 575 - 600 , 600 - 625 , 625 - 650 | ||
 | Click To Change The Sort Order: By Market Cap or Company Size Performance: Year-to-date, Week and Day |  |
|
Get the most comprehensive stock market coverage daily at 12Stocks.com ➞ Best Stocks Today ➞ Best Stocks Weekly ➞ Best Stocks Year-to-Date ➞ Best Stocks Trends ➞  Best Stocks Today 12Stocks.com Best Nasdaq Stocks ➞ Best S&P 500 Stocks ➞ Best Tech Stocks ➞ Best Biotech Stocks ➞ |
| Detailed Overview of Tech Stocks |
| Tech Technical Overview, Leaders & Laggards, Top Tech ETF Funds & Detailed Tech Stocks List, Charts, Trends & More |
| Tech Sector: Technical Analysis, Trends & YTD Performance | |
| Technology sector is composed of stocks
from semiconductors, software, web, social media
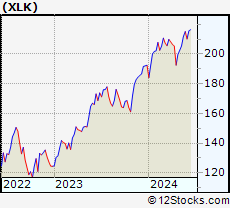
and services subsectors. Technology sector, as represented by XLK, an exchange-traded fund [ETF] that holds basket of tech stocks (e.g, Intel, Google) is up by 16.92% and is currently outperforming the overall market by 4.46% year-to-date. Below is a quick view of technical charts and trends: |
|
 XLK Weekly Chart |
|
| Long Term Trend: Very Good | |
| Medium Term Trend: Very Good | |
 XLK Daily Chart |
|
| Short Term Trend: Very Good | |
| Overall Trend Score: 100 | |
| YTD Performance: 16.92% | |
| **Trend Scores & Views Are Only For Educational Purposes And Not For Investing | |
| 12Stocks.com: Top Performing Technology Sector Stocks | ||||||||||||||||||||||||||||||||||||||||||||||||
 The top performing Technology sector stocks year to date are
Now, more recently, over last week, the top performing Technology sector stocks on the move are


|
||||||||||||||||||||||||||||||||||||||||||||||||
| 12Stocks.com: Investing in Tech Sector using Exchange Traded Funds | |
|
The following table shows list of key exchange traded funds (ETF) that
help investors track Tech Index. For detailed view, check out our ETF Funds section of our website. Quick View: Move mouse or cursor over ETF symbol (ticker) to view short-term technical chart and over ETF name to view long term chart. Click on ticker or stock name for detailed view. Click on to add stock symbol to your watchlist and to view watchlist. |
12Stocks.com List of ETFs that track Tech Index
| Ticker | ETF Name | Watchlist | Recent Price | Smart Investing & Trading Score | Change % | Week % | Year-to-date % |
| XLK | Technology | | 225.04 | 100 | 2.21 | 4.38 | 16.92% |
| QQQ | QQQ | | 474.15 | 100 | 1.32 | 2.45 | 15.78% |
| IYW | Technology | | 149.26 | 100 | 2.25 | 4.2 | 21.6% |
| VGT | Information Technology | | 571.52 | 100 | 2.15 | 4.36 | 18.08% |
| IXN | Global Tech | | 82.49 | 95 | 2.69 | 4.19 | 20.99% |
| IGV | Tech-Software | | 82.72 | 57 | 2.27 | 3.08 | 1.96% |
| XSD | Semiconductor | | 256.17 | 100 | 2.76 | 4.82 | 13.96% |
| TQQQ | QQQ | | 71.98 | 100 | 3.97 | 7.24 | 41.97% |
| SQQQ | Short QQQ | | 8.68 | 0 | -3.88 | -6.87 | -35.46% |
| SOXL | Semicondct Bull 3X | | 58.72 | 100 | 8.40 | 13.21 | 87.01% |
| SOXS | Semicondct Bear 3X | | 22.10 | 26 | -8.26 | -12.96 | 279.73% |
| SOXX | PHLX Semiconductor | | 250.23 | 100 | 2.82 | 4.46 | 30.31% |
| QTEC | First -100-Tech | | 196.13 | 95 | 1.88 | 3.5 | 11.77% |
| SMH | Semiconductor | | 263.09 | 100 | 2.98 | 4.31 | 50.45% |
| 12Stocks.com: Charts, Trends, Fundamental Data and Performances of Tech Stocks | |
|
We now take in-depth look at all Tech stocks including charts, multi-period performances and overall trends (as measured by Smart Investing & Trading Score). One can sort Tech stocks (click link to choose) by Daily, Weekly and by Year-to-Date performances. Also, one can sort by size of the company or by market capitalization. |
| Select Your Default Chart Type: | |||||
| |||||
| Click on stock symbol or name for detailed view. Click on to add stock symbol to your watchlist and to view watchlist. Quick View: Move mouse or cursor over "Daily" to quickly view daily technical stock chart and over "Weekly" to view weekly technical stock chart. | |||||


 | SMCI Super Micro Computer, Inc. |
| Sector: Technology | |
| SubSector: Networking & Communication Devices | |
| MarketCap: 1200.02 Millions | |
| Recent Price: 774.74 Smart Investing & Trading Score: 25 | |
| Day Percent Change: 0.93% Day Change: 7.13 | |
| Week Change: 0.73% Year-to-date Change: 172.6% | |
| SMCI Links: Profile News Message Board | |
| Charts:- Daily , Weekly | |
| Add SMCI to Watchlist: View: Get Complete SMCI Trend Analysis ➞ | |
 | RCM R1 RCM Inc. |
| Sector: Technology | |
| SubSector: Healthcare Information Services | |
| MarketCap: 1082.15 Millions | |
| Recent Price: 12.41 Smart Investing & Trading Score: 25 | |
| Day Percent Change: 0.73% Day Change: 0.09 | |
| Week Change: -3.27% Year-to-date Change: 17.4% | |
| RCM Links: Profile News Message Board | |
| Charts:- Daily , Weekly | |
| Add RCM to Watchlist: View: Get Complete RCM Trend Analysis ➞ | |
 | QNST QuinStreet, Inc. |
| Sector: Technology | |
| SubSector: Internet Software & Services | |
| MarketCap: 411.791 Millions | |
| Recent Price: 16.88 Smart Investing & Trading Score: 25 | |
| Day Percent Change: 0.60% Day Change: 0.10 | |
| Week Change: -0.56% Year-to-date Change: 31.6% | |
| QNST Links: Profile News Message Board | |
| Charts:- Daily , Weekly | |
| Add QNST to Watchlist: View: Get Complete QNST Trend Analysis ➞ | |
 | BR Broadridge Financial Solutions, Inc. |
| Sector: Technology | |
| SubSector: Information Technology Services | |
| MarketCap: 10633.8 Millions | |
| Recent Price: 196.96 Smart Investing & Trading Score: 25 | |
| Day Percent Change: 0.15% Day Change: 0.29 | |
| Week Change: -0.55% Year-to-date Change: -4.3% | |
| BR Links: Profile News Message Board | |
| Charts:- Daily , Weekly | |
| Add BR to Watchlist: View: Get Complete BR Trend Analysis ➞ | |
 | ENFN Enfusion, Inc. |
| Sector: Technology | |
| SubSector: Software - Application | |
| MarketCap: 1290 Millions | |
| Recent Price: 8.56 Smart Investing & Trading Score: 25 | |
| Day Percent Change: 0.00% Day Change: 0.00 | |
| Week Change: -0.7% Year-to-date Change: -13.2% | |
| ENFN Links: Profile News Message Board | |
| Charts:- Daily , Weekly | |
| Add ENFN to Watchlist: View: Get Complete ENFN Trend Analysis ➞ | |
 | CSCO Cisco Systems, Inc. |
| Sector: Technology | |
| SubSector: Communication Equipment | |
| MarketCap: 168483 Millions | |
| Recent Price: 45.62 Smart Investing & Trading Score: 25 | |
| Day Percent Change: -0.33% Day Change: -0.15 | |
| Week Change: -0.48% Year-to-date Change: -9.7% | |
| CSCO Links: Profile News Message Board | |
| Charts:- Daily , Weekly | |
| Add CSCO to Watchlist: View: Get Complete CSCO Trend Analysis ➞ | |
 | DLB Dolby Laboratories, Inc. |
| Sector: Technology | |
| SubSector: Diversified Electronics | |
| MarketCap: 5618.16 Millions | |
| Recent Price: 79.02 Smart Investing & Trading Score: 25 | |
| Day Percent Change: -0.27% Day Change: -0.21 | |
| Week Change: -0.42% Year-to-date Change: -8.3% | |
| DLB Links: Profile News Message Board | |
| Charts:- Daily , Weekly | |
| Add DLB to Watchlist: View: Get Complete DLB Trend Analysis ➞ | |
 | MLNK MeridianLink, Inc. |
| Sector: Technology | |
| SubSector: Software - Application | |
| MarketCap: 1630 Millions | |
| Recent Price: 21.02 Smart Investing & Trading Score: 24 | |
| Day Percent Change: 1.59% Day Change: 0.33 | |
| Week Change: 5.58% Year-to-date Change: -15.1% | |
| MLNK Links: Profile News Message Board | |
| Charts:- Daily , Weekly | |
| Add MLNK to Watchlist: View: Get Complete MLNK Trend Analysis ➞ | |
 | TXG 10x Genomics, Inc. |
| Sector: Technology | |
| SubSector: Healthcare Information Services | |
| MarketCap: 5490.45 Millions | |
| Recent Price: 21.35 Smart Investing & Trading Score: 24 | |
| Day Percent Change: -1.07% Day Change: -0.23 | |
| Week Change: -2.38% Year-to-date Change: -61.9% | |
| TXG Links: Profile News Message Board | |
| Charts:- Daily , Weekly | |
| Add TXG to Watchlist: View: Get Complete TXG Trend Analysis ➞ | |
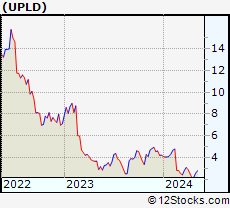 | UPLD Upland Software, Inc. |
| Sector: Technology | |
| SubSector: Application Software | |
| MarketCap: 654.562 Millions | |
| Recent Price: 2.48 Smart Investing & Trading Score: 22 | |
| Day Percent Change: 2.90% Day Change: 0.07 | |
| Week Change: -1.59% Year-to-date Change: -41.4% | |
| UPLD Links: Profile News Message Board | |
| Charts:- Daily , Weekly | |
| Add UPLD to Watchlist: View: Get Complete UPLD Trend Analysis ➞ | |
 | FLYW Flywire Corporation |
| Sector: Technology | |
| SubSector: Software - Infrastructure | |
| MarketCap: 3390 Millions | |
| Recent Price: 16.90 Smart Investing & Trading Score: 22 | |
| Day Percent Change: 2.58% Day Change: 0.42 | |
| Week Change: -1.05% Year-to-date Change: -27.9% | |
| FLYW Links: Profile News Message Board | |
| Charts:- Daily , Weekly | |
| Add FLYW to Watchlist: View: Get Complete FLYW Trend Analysis ➞ | |
 | LPSN LivePerson, Inc. |
| Sector: Technology | |
| SubSector: Business Software & Services | |
| MarketCap: 1070.58 Millions | |
| Recent Price: 0.60 Smart Investing & Trading Score: 22 | |
| Day Percent Change: -4.29% Day Change: -0.03 | |
| Week Change: -6.4% Year-to-date Change: -84.1% | |
| LPSN Links: Profile News Message Board | |
| Charts:- Daily , Weekly | |
| Add LPSN to Watchlist: View: Get Complete LPSN Trend Analysis ➞ | |
 | MYNA Mynaric AG |
| Sector: Technology | |
| SubSector: Communication Equipment | |
| MarketCap: 152 Millions | |
| Recent Price: 4.58 Smart Investing & Trading Score: 22 | |
| Day Percent Change: -0.43% Day Change: -0.02 | |
| Week Change: -2.14% Year-to-date Change: -26.0% | |
| MYNA Links: Profile News Message Board | |
| Charts:- Daily , Weekly | |
| Add MYNA to Watchlist: View: Get Complete MYNA Trend Analysis ➞ | |
 | BIDU Baidu, Inc. |
| Sector: Technology | |
| SubSector: Internet Information Providers | |
| MarketCap: 33525.9 Millions | |
| Recent Price: 94.38 Smart Investing & Trading Score: 20 | |
| Day Percent Change: 0.46% Day Change: 0.44 | |
| Week Change: -1.57% Year-to-date Change: -20.8% | |
| BIDU Links: Profile News Message Board | |
| Charts:- Daily , Weekly | |
| Add BIDU to Watchlist: View: Get Complete BIDU Trend Analysis ➞ | |
 | SYT SYLA Technologies Co., Ltd. |
| Sector: Technology | |
| SubSector: Software - Application | |
| MarketCap: 187 Millions | |
| Recent Price: 2.31 Smart Investing & Trading Score: 20 | |
| Day Percent Change: 0.00% Day Change: 0.00 | |
| Week Change: -2.94% Year-to-date Change: -59.5% | |
| SYT Links: Profile News Message Board | |
| Charts:- Daily , Weekly | |
| Add SYT to Watchlist: View: Get Complete SYT Trend Analysis ➞ | |
 | VLD Velo3D, Inc. |
| Sector: Technology | |
| SubSector: Computer Hardware | |
| MarketCap: 404 Millions | |
| Recent Price: 0.12 Smart Investing & Trading Score: 20 | |
| Day Percent Change: -4.75% Day Change: -0.01 | |
| Week Change: -13.15% Year-to-date Change: -68.4% | |
| VLD Links: Profile News Message Board | |
| Charts:- Daily , Weekly | |
| Add VLD to Watchlist: View: Get Complete VLD Trend Analysis ➞ | |
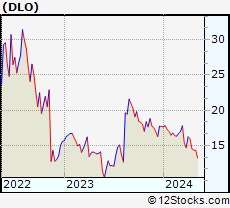 | DLO DLocal Limited |
| Sector: Technology | |
| SubSector: Software - Infrastructure | |
| MarketCap: 3620 Millions | |
| Recent Price: 7.67 Smart Investing & Trading Score: 20 | |
| Day Percent Change: -3.28% Day Change: -0.26 | |
| Week Change: -5.31% Year-to-date Change: -56.7% | |
| DLO Links: Profile News Message Board | |
| Charts:- Daily , Weekly | |
| Add DLO to Watchlist: View: Get Complete DLO Trend Analysis ➞ | |
 | WDAY Workday, Inc. |
| Sector: Technology | |
| SubSector: Application Software | |
| MarketCap: 31372.1 Millions | |
| Recent Price: 210.93 Smart Investing & Trading Score: 20 | |
| Day Percent Change: -1.49% Day Change: -3.20 | |
| Week Change: -2.15% Year-to-date Change: -23.6% | |
| WDAY Links: Profile News Message Board | |
| Charts:- Daily , Weekly | |
| Add WDAY to Watchlist: View: Get Complete WDAY Trend Analysis ➞ | |
 | NTCT NetScout Systems, Inc. |
| Sector: Technology | |
| SubSector: Business Software & Services | |
| MarketCap: 1657.28 Millions | |
| Recent Price: 18.60 Smart Investing & Trading Score: 20 | |
| Day Percent Change: -1.17% Day Change: -0.22 | |
| Week Change: -0.8% Year-to-date Change: -15.3% | |
| NTCT Links: Profile News Message Board | |
| Charts:- Daily , Weekly | |
| Add NTCT to Watchlist: View: Get Complete NTCT Trend Analysis ➞ | |
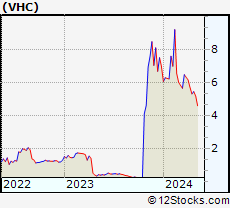 | VHC VirnetX Holding Corp |
| Sector: Technology | |
| SubSector: Internet Software & Services | |
| MarketCap: 352.791 Millions | |
| Recent Price: 3.60 Smart Investing & Trading Score: 20 | |
| Day Percent Change: -0.55% Day Change: -0.02 | |
| Week Change: -2.17% Year-to-date Change: -48.6% | |
| VHC Links: Profile News Message Board | |
| Charts:- Daily , Weekly | |
| Add VHC to Watchlist: View: Get Complete VHC Trend Analysis ➞ | |
 | COGT Cogint, Inc. |
| Sector: Technology | |
| SubSector: Business Software & Services | |
| MarketCap: 214.55 Millions | |
| Recent Price: 9.04 Smart Investing & Trading Score: 19 | |
| Day Percent Change: 2.49% Day Change: 0.22 | |
| Week Change: 7.75% Year-to-date Change: 53.7% | |
| COGT Links: Profile News Message Board | |
| Charts:- Daily , Weekly | |
| Add COGT to Watchlist: View: Get Complete COGT Trend Analysis ➞ | |
 | SOUN SoundHound AI, Inc. |
| Sector: Technology | |
| SubSector: Software - Application | |
| MarketCap: 1040 Millions | |
| Recent Price: 4.66 Smart Investing & Trading Score: 18 | |
| Day Percent Change: 0.11% Day Change: 0.00 | |
| Week Change: 0.11% Year-to-date Change: 117.5% | |
| SOUN Links: Profile News Message Board | |
| Charts:- Daily , Weekly | |
| Add SOUN to Watchlist: View: Get Complete SOUN Trend Analysis ➞ | |
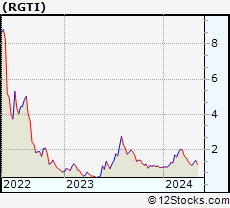 | RGTI Rigetti Computing, Inc. |
| Sector: Technology | |
| SubSector: Computer Hardware | |
| MarketCap: 163 Millions | |
| Recent Price: 1.01 Smart Investing & Trading Score: 18 | |
| Day Percent Change: -3.33% Day Change: -0.04 | |
| Week Change: -0.49% Year-to-date Change: 3.6% | |
| RGTI Links: Profile News Message Board | |
| Charts:- Daily , Weekly | |
| Add RGTI to Watchlist: View: Get Complete RGTI Trend Analysis ➞ | |
 | ROKU Roku, Inc. |
| Sector: Technology | |
| SubSector: CATV Systems | |
| MarketCap: 10503.6 Millions | |
| Recent Price: 56.36 Smart Investing & Trading Score: 18 | |
| Day Percent Change: -3.11% Day Change: -1.81 | |
| Week Change: -1.73% Year-to-date Change: -38.5% | |
| ROKU Links: Profile News Message Board | |
| Charts:- Daily , Weekly | |
| Add ROKU to Watchlist: View: Get Complete ROKU Trend Analysis ➞ | |
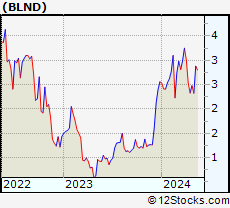 | BLND Blend Labs, Inc. |
| Sector: Technology | |
| SubSector: Software - Application | |
| MarketCap: 210 Millions | |
| Recent Price: 2.64 Smart Investing & Trading Score: 17 | |
| Day Percent Change: 6.45% Day Change: 0.16 | |
| Week Change: -0.75% Year-to-date Change: 3.1% | |
| BLND Links: Profile News Message Board | |
| Charts:- Daily , Weekly | |
| Add BLND to Watchlist: View: Get Complete BLND Trend Analysis ➞ | |
| For tabular summary view of above stock list: Summary View ➞ 0 - 25 , 25 - 50 , 50 - 75 , 75 - 100 , 100 - 125 , 125 - 150 , 150 - 175 , 175 - 200 , 200 - 225 , 225 - 250 , 250 - 275 , 275 - 300 , 300 - 325 , 325 - 350 , 350 - 375 , 375 - 400 , 400 - 425 , 425 - 450 , 450 - 475 , 475 - 500 , 500 - 525 , 525 - 550 , 550 - 575 , 575 - 600 , 600 - 625 , 625 - 650 | ||
| Click To Change The Sort Order: By Market Cap or Company Size Performance: Year-to-date, Week and Day | |
| Select Chart Type: | ||
|
Best Stocks Today 12Stocks.com |
© 2024 12Stocks.com Terms & Conditions Privacy Contact Us
All Information Provided Only For Education And Not To Be Used For Investing or Trading. See Terms & Conditions


One More Thing ... Get Best Stocks Delivered Daily!
Never Ever Miss A Move With Our Top Ten Stocks Lists
Find Best Stocks In Any Market - Bull or Bear Market
Take A Peek At Our Top Ten Stocks Lists: Daily, Weekly, Year-to-Date & Top Trends
Find Best Stocks In Any Market - Bull or Bear Market
Take A Peek At Our Top Ten Stocks Lists: Daily, Weekly, Year-to-Date & Top Trends
Technology Stocks With Best Up Trends [0-bearish to 100-bullish]: MediaCo Holding[100], Oracle [100], Karooooo [100], Bitdeer [100], Red Violet[100], Cango [100], Navitas Semiconductor[100], Axcelis [100], Cellebrite DI[100], MKS [100], Amkor [100]
Best Technology Stocks Year-to-Date:
MediaCo Holding[411.74%], MicroCloud Hologram[300%], Uxin [216.69%], Super Micro[172.55%], Smith Micro[168.77%], MicroStrategy [153.9%], Cheetah Mobile[135.09%], CuriosityStream [122.18%], SoundHound AI[117.52%], Zeta Global[96.94%], Phoenix New[94.85%] Best Technology Stocks This Week:
MediaCo Holding[105.66%], Kaltura [46.19%], Karooooo [24.29%], Affirm [18.84%], CuriosityStream [18.81%], Cellebrite DI[18.45%], Nerdy [18.37%], on [15.37%], DXC [14.26%], Zillow [13.79%], Altair Engineering[13.7%] Best Technology Stocks Daily:
MediaCo Holding[37.11%], Oracle [13.32%], Zillow [13.31%], Zillow [12.75%], Karooooo [12.64%], Tucows [10.19%], Amesite [9.33%], Compass [8.24%], Bitdeer [8.02%], Confluent [8.00%], FiscalNote [7.76%]