
 Login Sign Up


| |||||
 |  | ||||

| 12Stocks.com Market Intelligence |
Best Tech Stocks
| In a hurry? Tech Stocks Lists: Performance & Trends, Stock Charts, FANG Stocks
Sort Tech stocks: Daily, Weekly, Year-to-Date, Market Cap & Trends. Filter Tech stocks list by size:All Tech Large Mid-Range Small and MicroCap |
| 12Stocks.com Tech Stocks Performances & Trends Daily | |||||||||
|
|  The overall Smart Investing & Trading Score is 100 (0-bearish to 100-bullish) which puts Technology sector in short term bullish trend. The Smart Investing & Trading Score from previous trading session is 90 and an improvement of trend continues.
| ||||||||
Here are the Smart Investing & Trading Scores of the most requested Technology stocks at 12Stocks.com (click stock name for detailed review):
|


| 12Stocks.com: Investing in Technology sector with Stocks | |
|
The following table helps investors and traders sort through current performance and trends (as measured by Smart Investing & Trading Score) of various
stocks in the Tech sector. Quick View: Move mouse or cursor over stock symbol (ticker) to view short-term technical chart and over stock name to view long term chart. Click on  to add stock symbol to your watchlist and to add stock symbol to your watchlist and  to view watchlist. Click on any ticker or stock name for detailed market intelligence report for that stock. to view watchlist. Click on any ticker or stock name for detailed market intelligence report for that stock. |
12Stocks.com Performance of Stocks in Tech Sector
| Ticker | Stock Name | Watchlist | Category | Recent Price | Smart Investing & Trading Score | Change % | YTD Change% |
| PSFE | Paysafe |   | Software - Infrastructure | 13.00 | 40 | 1.88% | -24.90% |
| LOGM | LogMeIn | | Software | 23.03 | 40 | 1.28% | 0.00% |
| TUYA | Tuya | | Software - Infrastructure | 2.50 | 40 | 1.21% | 45.45% |
| MTSI | MACOM | | Semiconductors | 128.09 | 40 | 1.21% | -1.04% |
| MANU | Manchester United | | Entertainment | 15.41 | 40 | 1.05% | -9.25% |
| SPA | Sparton | | Electronics | 31.35 | 40 | 0.97% | 0.00% |
| SPIL | Siliconware Precision | | Semiconductor | 47.27 | 40 | 0.81% | 0.00% |
| LAW | CS Disco | | Software - | 6.29 | 40 | 0.80% | 29.69% |
| IDTI | Integrated Device | | Semiconductor | 10.66 | 40 | 0.66% | 0.00% |
| IMXI | Money | | Software - Infrastructure | 14.02 | 40 | 0.65% | -31.97% |
| PWFL | PowerFleet | | Communication | 4.69 | 40 | 0.64% | 0.00% |
| CGNT | Cognyte Software | | Software - Infrastructure | 8.25 | 40 | 0.61% | -4.40% |
| CCC | Clarivate Analytics | | IT | 28.69 | 40 | 0.53% | 0.00% |
| INXN | InterXion Holding | | IT | 2.01 | 40 | 0.50% | 0.00% |
| SHEN | Shenandoah Tele | | Telecom | 13.24 | 40 | 0.46% | 7.29% |
| ATTU | Attunity | | Software | 5.75 | 40 | 0.35% | 0.00% |
| RP | RealPage | | Software | 12.89 | 40 | 0.31% | 0.00% |
| SYNA | Synaptics | | Semiconductors | 68.11 | 40 | 0.31% | -17.42% |
| EPAM | EPAM Systems | | IT | 152.77 | 40 | 0.31% | -33.33% |
| ACN | Accenture | | IT | 244.34 | 40 | 0.26% | -28.95% |
| VRNT | Verint Systems | | Software - Infrastructure | 20.28 | 40 | 0.25% | -24.19% |
| PUBM | PubMatic | | Software - | 8.28 | 40 | 0.24% | -44.17% |
| ALTR | Altair Engineering | | Semiconductor | 111.85 | 40 | 0.14% | 2.32% |
| ATHM | Autohome | | Internet Content & Information | 28.64 | 40 | 0.07% | 11.14% |
| DISH | DISH Network | | CATV | 5.77 | 40 | 0.00% | 0.00% |
| For chart view version of above stock list: Chart View ➞ 0 - 25 , 25 - 50 , 50 - 75 , 75 - 100 , 100 - 125 , 125 - 150 , 150 - 175 , 175 - 200 , 200 - 225 , 225 - 250 , 250 - 275 , 275 - 300 , 300 - 325 , 325 - 350 , 350 - 375 , 375 - 400 , 400 - 425 , 425 - 450 , 450 - 475 , 475 - 500 , 500 - 525 , 525 - 550 , 550 - 575 , 575 - 600 , 600 - 625 , 625 - 650 , 650 - 675 , 675 - 700 , 700 - 725 , 725 - 750 , 750 - 775 , 775 - 800 , 800 - 825 , 825 - 850 , 850 - 875 , 875 - 900 | ||
 | Click To Change The Sort Order: By Market Cap or Company Size Performance: Year-to-date, Week and Day |  |
|
Get the most comprehensive stock market coverage daily at 12Stocks.com ➞ Best Stocks Today ➞ Best Stocks Weekly ➞ Best Stocks Year-to-Date ➞ Best Stocks Trends ➞  Best Stocks Today 12Stocks.com Best Nasdaq Stocks ➞ Best S&P 500 Stocks ➞ Best Tech Stocks ➞ Best Biotech Stocks ➞ |
| Detailed Overview of Tech Stocks |
| Tech Technical Overview, Leaders & Laggards, Top Tech ETF Funds & Detailed Tech Stocks List, Charts, Trends & More |
| Tech Sector: Technical Analysis, Trends & YTD Performance | |
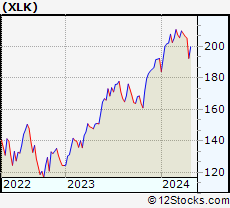
| Technology sector is composed of stocks
from semiconductors, software, web, social media
and services subsectors. Technology sector, as represented by XLK, an exchange-traded fund [ETF] that holds basket of tech stocks (e.g, Intel, Google) is up by 23.7823% and is currently outperforming the overall market by 9.0244% year-to-date. Below is a quick view of technical charts and trends: |
|
 XLK Weekly Chart |
|
| Long Term Trend: Very Good | |
| Medium Term Trend: Good | |
 XLK Daily Chart |
|
| Short Term Trend: Very Good | |
| Overall Trend Score: 100 | |
| YTD Performance: 23.7823% | |
| **Trend Scores & Views Are Only For Educational Purposes And Not For Investing | |
| 12Stocks.com: Top Performing Technology Sector Stocks | ||||||||||||||||||||||||||||||||||||||||||||||||
 The top performing Technology sector stocks year to date are
Now, more recently, over last week, the top performing Technology sector stocks on the move are


|
||||||||||||||||||||||||||||||||||||||||||||||||
| 12Stocks.com: Investing in Tech Sector using Exchange Traded Funds | |
|
The following table shows list of key exchange traded funds (ETF) that
help investors track Tech Index. For detailed view, check out our ETF Funds section of our website. Quick View: Move mouse or cursor over ETF symbol (ticker) to view short-term technical chart and over ETF name to view long term chart. Click on ticker or stock name for detailed view. Click on to add stock symbol to your watchlist and to view watchlist. |
12Stocks.com List of ETFs that track Tech Index
| Ticker | ETF Name | Watchlist | Recent Price | Smart Investing & Trading Score | Change % | Week % | Year-to-date % |
| IGN | Tech-Multimd Ntwk | | 53.86 | 40 | 0.918119 | -20.6435 | 0% |
| 12Stocks.com: Charts, Trends, Fundamental Data and Performances of Tech Stocks | |
|
We now take in-depth look at all Tech stocks including charts, multi-period performances and overall trends (as measured by Smart Investing & Trading Score). One can sort Tech stocks (click link to choose) by Daily, Weekly and by Year-to-Date performances. Also, one can sort by size of the company or by market capitalization. |
| Select Your Default Chart Type: | |||||
| |||||
| Click on stock symbol or name for detailed view. Click on to add stock symbol to your watchlist and to view watchlist. Quick View: Move mouse or cursor over "Daily" to quickly view daily technical stock chart and over "Weekly" to view weekly technical stock chart. | |||||


 | PSFE Paysafe Limited |
| Sector: Technology | |
| SubSector: Software - Infrastructure | |
| MarketCap: 871.01 Millions | |
| Recent Price: 13.00 Smart Investing & Trading Score: 40 | |
| Day Percent Change: 1.88088% Day Change: -0.2 | |
| Week Change: -1.81269% Year-to-date Change: -24.9% | |
| PSFE Links: Profile News Message Board | |
| Charts:- Daily , Weekly | |
| Add PSFE to Watchlist: View: Get Complete PSFE Trend Analysis ➞ | |
 | LOGM LogMeIn, Inc. |
| Sector: Technology | |
| SubSector: Application Software | |
| MarketCap: 4021.72 Millions | |
| Recent Price: 23.03 Smart Investing & Trading Score: 40 | |
| Day Percent Change: 1.27529% Day Change: -9999 | |
| Week Change: -5.65342% Year-to-date Change: 0.0% | |
| LOGM Links: Profile News Message Board | |
| Charts:- Daily , Weekly | |
| Add LOGM to Watchlist: View: Get Complete LOGM Trend Analysis ➞ | |
 | TUYA Tuya Inc ADR |
| Sector: Technology | |
| SubSector: Software - Infrastructure | |
| MarketCap: 1359.24 Millions | |
| Recent Price: 2.50 Smart Investing & Trading Score: 40 | |
| Day Percent Change: 1.21457% Day Change: 0.07 | |
| Week Change: 2.04082% Year-to-date Change: 45.5% | |
| TUYA Links: Profile News Message Board | |
| Charts:- Daily , Weekly | |
| Add TUYA to Watchlist: View: Get Complete TUYA Trend Analysis ➞ | |
 | MTSI MACOM Technology Solutions Holdings Inc |
| Sector: Technology | |
| SubSector: Semiconductors | |
| MarketCap: 9670.84 Millions | |
| Recent Price: 128.09 Smart Investing & Trading Score: 40 | |
| Day Percent Change: 1.20891% Day Change: 2.43 | |
| Week Change: 1.12901% Year-to-date Change: -1.0% | |
| MTSI Links: Profile News Message Board | |
| Charts:- Daily , Weekly | |
| Add MTSI to Watchlist: View: Get Complete MTSI Trend Analysis ➞ | |
 | MANU Manchester United Plc |
| Sector: Technology | |
| SubSector: Entertainment | |
| MarketCap: 2711.87 Millions | |
| Recent Price: 15.41 Smart Investing & Trading Score: 40 | |
| Day Percent Change: 1.04918% Day Change: -0.2 | |
| Week Change: 1.24836% Year-to-date Change: -9.2% | |
| MANU Links: Profile News Message Board | |
| Charts:- Daily , Weekly | |
| Add MANU to Watchlist: View: Get Complete MANU Trend Analysis ➞ | |
 | SPA Sparton Corporation |
| Sector: Technology | |
| SubSector: Diversified Electronics | |
| MarketCap: 219.79 Millions | |
| Recent Price: 31.35 Smart Investing & Trading Score: 40 | |
| Day Percent Change: 0.966184% Day Change: -9999 | |
| Week Change: 104.768% Year-to-date Change: 0.0% | |
| SPA Links: Profile News Message Board | |
| Charts:- Daily , Weekly | |
| Add SPA to Watchlist: View: Get Complete SPA Trend Analysis ➞ | |
 | SPIL Siliconware Precision Industries Co., Ltd. |
| Sector: Technology | |
| SubSector: Semiconductor Equipment & Materials | |
| MarketCap: 4964.5 Millions | |
| Recent Price: 47.27 Smart Investing & Trading Score: 40 | |
| Day Percent Change: 0.810407% Day Change: -9999 | |
| Week Change: -18.2746% Year-to-date Change: 0.0% | |
| SPIL Links: Profile News Message Board | |
| Charts:- Daily , Weekly | |
| Add SPIL to Watchlist: View: Get Complete SPIL Trend Analysis ➞ | |
 | LAW CS Disco Inc |
| Sector: Technology | |
| SubSector: Software - Application | |
| MarketCap: 343.9 Millions | |
| Recent Price: 6.29 Smart Investing & Trading Score: 40 | |
| Day Percent Change: 0.801282% Day Change: 0 | |
| Week Change: -3.08166% Year-to-date Change: 29.7% | |
| LAW Links: Profile News Message Board | |
| Charts:- Daily , Weekly | |
| Add LAW to Watchlist: View: Get Complete LAW Trend Analysis ➞ | |
 | IDTI Integrated Device Technology, Inc. |
| Sector: Technology | |
| SubSector: Semiconductor - Broad Line | |
| MarketCap: 3229.51 Millions | |
| Recent Price: 10.66 Smart Investing & Trading Score: 40 | |
| Day Percent Change: 0.661001% Day Change: -9999 | |
| Week Change: -13.3333% Year-to-date Change: 0.0% | |
| IDTI Links: Profile News Message Board | |
| Charts:- Daily , Weekly | |
| Add IDTI to Watchlist: View: Get Complete IDTI Trend Analysis ➞ | |
 | IMXI International Money Express Inc |
| Sector: Technology | |
| SubSector: Software - Infrastructure | |
| MarketCap: 429.83 Millions | |
| Recent Price: 14.02 Smart Investing & Trading Score: 40 | |
| Day Percent Change: 0.646088% Day Change: -0.02 | |
| Week Change: -1.68303% Year-to-date Change: -32.0% | |
| IMXI Links: Profile News Message Board | |
| Charts:- Daily , Weekly | |
| Add IMXI to Watchlist: View: Get Complete IMXI Trend Analysis ➞ | |
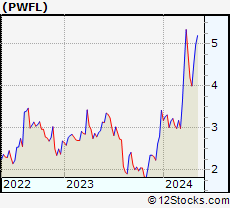 | PWFL PowerFleet, Inc. |
| Sector: Technology | |
| SubSector: Communication Equipment | |
| MarketCap: 115.239 Millions | |
| Recent Price: 4.69 Smart Investing & Trading Score: 40 | |
| Day Percent Change: 0.643777% Day Change: -9999 | |
| Week Change: 2.40175% Year-to-date Change: 0.0% | |
| PWFL Links: Profile News Message Board | |
| Charts:- Daily , Weekly | |
| Add PWFL to Watchlist: View: Get Complete PWFL Trend Analysis ➞ | |
 | CGNT Cognyte Software Ltd |
| Sector: Technology | |
| SubSector: Software - Infrastructure | |
| MarketCap: 647.97 Millions | |
| Recent Price: 8.25 Smart Investing & Trading Score: 40 | |
| Day Percent Change: 0.609756% Day Change: 0.13 | |
| Week Change: -2.13523% Year-to-date Change: -4.4% | |
| CGNT Links: Profile News Message Board | |
| Charts:- Daily , Weekly | |
| Add CGNT to Watchlist: View: Get Complete CGNT Trend Analysis ➞ | |
 | CCC Clarivate Analytics Plc |
| Sector: Technology | |
| SubSector: Information Technology Services | |
| MarketCap: 6623.88 Millions | |
| Recent Price: 28.69 Smart Investing & Trading Score: 40 | |
| Day Percent Change: 0.525578% Day Change: -9999 | |
| Week Change: 7.65478% Year-to-date Change: 0.0% | |
| CCC Links: Profile News Message Board | |
| Charts:- Daily , Weekly | |
| Add CCC to Watchlist: View: Get Complete CCC Trend Analysis ➞ | |
 | INXN InterXion Holding N.V. |
| Sector: Technology | |
| SubSector: Information Technology Services | |
| MarketCap: 5930.48 Millions | |
| Recent Price: 2.01 Smart Investing & Trading Score: 40 | |
| Day Percent Change: 0.5% Day Change: -9999 | |
| Week Change: -51.3317% Year-to-date Change: 0.0% | |
| INXN Links: Profile News Message Board | |
| Charts:- Daily , Weekly | |
| Add INXN to Watchlist: View: Get Complete INXN Trend Analysis ➞ | |
 | SHEN Shenandoah Telecommunications Co |
| Sector: Technology | |
| SubSector: Telecom Services | |
| MarketCap: 738.37 Millions | |
| Recent Price: 13.24 Smart Investing & Trading Score: 40 | |
| Day Percent Change: 0.455235% Day Change: 0.21 | |
| Week Change: 0.227101% Year-to-date Change: 7.3% | |
| SHEN Links: Profile News Message Board | |
| Charts:- Daily , Weekly | |
| Add SHEN to Watchlist: View: Get Complete SHEN Trend Analysis ➞ | |
 | ATTU Attunity Ltd. |
| Sector: Technology | |
| SubSector: Technical & System Software | |
| MarketCap: 134.14 Millions | |
| Recent Price: 5.75 Smart Investing & Trading Score: 40 | |
| Day Percent Change: 0.34904% Day Change: -9999 | |
| Week Change: 228.571% Year-to-date Change: 0.0% | |
| ATTU Links: Profile News Message Board | |
| Charts:- Daily , Weekly | |
| Add ATTU to Watchlist: View: Get Complete ATTU Trend Analysis ➞ | |
 | RP RealPage, Inc. |
| Sector: Technology | |
| SubSector: Application Software | |
| MarketCap: 4674.12 Millions | |
| Recent Price: 12.89 Smart Investing & Trading Score: 40 | |
| Day Percent Change: 0.311284% Day Change: -9999 | |
| Week Change: -26.4269% Year-to-date Change: 0.0% | |
| RP Links: Profile News Message Board | |
| Charts:- Daily , Weekly | |
| Add RP to Watchlist: View: Get Complete RP Trend Analysis ➞ | |
 | SYNA Synaptics Inc |
| Sector: Technology | |
| SubSector: Semiconductors | |
| MarketCap: 2702.09 Millions | |
| Recent Price: 68.11 Smart Investing & Trading Score: 40 | |
| Day Percent Change: 0.309278% Day Change: -0.44 | |
| Week Change: -3.90801% Year-to-date Change: -17.4% | |
| SYNA Links: Profile News Message Board | |
| Charts:- Daily , Weekly | |
| Add SYNA to Watchlist: View: Get Complete SYNA Trend Analysis ➞ | |
 | EPAM EPAM Systems Inc |
| Sector: Technology | |
| SubSector: Information Technology Services | |
| MarketCap: 9438.4 Millions | |
| Recent Price: 152.77 Smart Investing & Trading Score: 40 | |
| Day Percent Change: 0.308601% Day Change: -0.34 | |
| Week Change: -2.3397% Year-to-date Change: -33.3% | |
| EPAM Links: Profile News Message Board | |
| Charts:- Daily , Weekly | |
| Add EPAM to Watchlist: View: Get Complete EPAM Trend Analysis ➞ | |
 | ACN Accenture plc |
| Sector: Technology | |
| SubSector: Information Technology Services | |
| MarketCap: 158796 Millions | |
| Recent Price: 244.34 Smart Investing & Trading Score: 40 | |
| Day Percent Change: 0.258504% Day Change: 0.3 | |
| Week Change: 2.2001% Year-to-date Change: -29.0% | |
| ACN Links: Profile News Message Board | |
| Charts:- Daily , Weekly | |
| Add ACN to Watchlist: View: Get Complete ACN Trend Analysis ➞ | |
 | VRNT Verint Systems, Inc |
| Sector: Technology | |
| SubSector: Software - Infrastructure | |
| MarketCap: 1228.39 Millions | |
| Recent Price: 20.28 Smart Investing & Trading Score: 40 | |
| Day Percent Change: 0.247158% Day Change: 0.51 | |
| Week Change: 0.197628% Year-to-date Change: -24.2% | |
| VRNT Links: Profile News Message Board | |
| Charts:- Daily , Weekly | |
| Add VRNT to Watchlist: View: Get Complete VRNT Trend Analysis ➞ | |
 | PUBM PubMatic Inc |
| Sector: Technology | |
| SubSector: Software - Application | |
| MarketCap: 382.73 Millions | |
| Recent Price: 8.28 Smart Investing & Trading Score: 40 | |
| Day Percent Change: 0.242131% Day Change: 0.68 | |
| Week Change: -1.89573% Year-to-date Change: -44.2% | |
| PUBM Links: Profile News Message Board | |
| Charts:- Daily , Weekly | |
| Add PUBM to Watchlist: View: Get Complete PUBM Trend Analysis ➞ | |
 | ALTR Altair Engineering Inc. |
| Sector: Technology | |
| SubSector: Semiconductor - Specialized | |
| MarketCap: 2072.2 Millions | |
| Recent Price: 111.85 Smart Investing & Trading Score: 40 | |
| Day Percent Change: 0.143254% Day Change: -9999 | |
| Week Change: 0.385927% Year-to-date Change: 2.3% | |
| ALTR Links: Profile News Message Board | |
| Charts:- Daily , Weekly | |
| Add ALTR to Watchlist: View: Get Complete ALTR Trend Analysis ➞ | |
 | ATHM Autohome Inc ADR |
| Sector: Technology | |
| SubSector: Internet Content & Information | |
| MarketCap: 3388.57 Millions | |
| Recent Price: 28.64 Smart Investing & Trading Score: 40 | |
| Day Percent Change: 0.0698812% Day Change: 0.28 | |
| Week Change: -2.35254% Year-to-date Change: 11.1% | |
| ATHM Links: Profile News Message Board | |
| Charts:- Daily , Weekly | |
| Add ATHM to Watchlist: View: Get Complete ATHM Trend Analysis ➞ | |
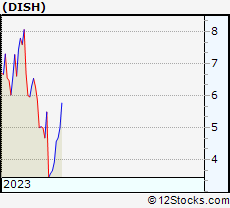 | DISH DISH Network Corporation |
| Sector: Technology | |
| SubSector: CATV Systems | |
| MarketCap: 12408.1 Millions | |
| Recent Price: 5.77 Smart Investing & Trading Score: 40 | |
| Day Percent Change: 0% Day Change: -9999 | |
| Week Change: 10.9615% Year-to-date Change: 0.0% | |
| DISH Links: Profile News Message Board | |
| Charts:- Daily , Weekly | |
| Add DISH to Watchlist: View: Get Complete DISH Trend Analysis ➞ | |
| For tabular summary view of above stock list: Summary View ➞ 0 - 25 , 25 - 50 , 50 - 75 , 75 - 100 , 100 - 125 , 125 - 150 , 150 - 175 , 175 - 200 , 200 - 225 , 225 - 250 , 250 - 275 , 275 - 300 , 300 - 325 , 325 - 350 , 350 - 375 , 375 - 400 , 400 - 425 , 425 - 450 , 450 - 475 , 475 - 500 , 500 - 525 , 525 - 550 , 550 - 575 , 575 - 600 , 600 - 625 , 625 - 650 , 650 - 675 , 675 - 700 , 700 - 725 , 725 - 750 , 750 - 775 , 775 - 800 , 800 - 825 , 825 - 850 , 850 - 875 , 875 - 900 | ||
| Click To Change The Sort Order: By Market Cap or Company Size Performance: Year-to-date, Week and Day | |
| Select Chart Type: | ||
|
Best Stocks Today 12Stocks.com |
© 2025 12Stocks.com Terms & Conditions Privacy Contact Us
All Information Provided Only For Education And Not To Be Used For Investing or Trading. See Terms & Conditions


One More Thing ... Get Best Stocks Delivered Daily!
Never Ever Miss A Move With Our Top Ten Stocks Lists
Find Best Stocks In Any Market - Bull or Bear Market
Take A Peek At Our Top Ten Stocks Lists: Daily, Weekly, Year-to-Date & Top Trends
Find Best Stocks In Any Market - Bull or Bear Market
Take A Peek At Our Top Ten Stocks Lists: Daily, Weekly, Year-to-Date & Top Trends
Technology Stocks With Best Up Trends [0-bearish to 100-bullish]: Sony [100], Bakkt [100], Rigetti Computing[100], Fair Isaac[100], Arqit Quantum[100], D-Wave Quantum[100], Navitas Semiconductor[100], Shoals [100], Vuzix [100], Arteris [100], Lantronix [100]
Best Technology Stocks Year-to-Date:
Xunlei [370.476%], Sify [315.033%], Wolfspeed [307.01%], Digital Turbine[265.057%], EchoStar Corp[247.253%], CuriosityStream [241.605%], Viasat [224.029%], Pagaya [222.638%], Oneconnect Financial[209.053%], D-Wave Quantum[203.954%], CommScope Holding[203.101%] Best Technology Stocks This Week:
GTT [443626%], Barracuda Networks[71050%], Mobile TeleSystems[10483.5%], Nam Tai[5033.33%], Ebix [4200.85%], Fang [4150%], NantHealth [3114.02%], Hemisphere Media[2981.82%], Yandex N.V[2935.27%], Wolfspeed [1961.98%], Castlight Health[1751.96%] Best Technology Stocks Daily:
Sony [194.565%], Bakkt [28.6091%], Rigetti Computing[18.4925%], Fair Isaac[17.979%], Arqit Quantum[17.9369%], Marti [17%], Latch [16.6667%], Oclaro [14.734%], D-Wave Quantum[13.968%], Arbe Robotics[13.0178%], Navitas Semiconductor[12.3288%]