
 Login Sign Up


| |||||
 |  | ||||

| 12Stocks.com Market Intelligence |
Best Tech Stocks
| In a hurry? Tech Stocks Lists: Performance & Trends, Stock Charts, FANG Stocks
Sort Tech stocks: Daily, Weekly, Year-to-Date, Market Cap & Trends. Filter Tech stocks list by size:All Tech Large Mid-Range Small and MicroCap |
| 12Stocks.com Tech Stocks Performances & Trends Daily | |||||||||
|
|  The overall Smart Investing & Trading Score is 100 (0-bearish to 100-bullish) which puts Technology sector in short term bullish trend. The Smart Investing & Trading Score from previous trading session is 90 and an improvement of trend continues.
| ||||||||
Here are the Smart Investing & Trading Scores of the most requested Technology stocks at 12Stocks.com (click stock name for detailed review):
|


| 12Stocks.com: Investing in Technology sector with Stocks | |
|
The following table helps investors and traders sort through current performance and trends (as measured by Smart Investing & Trading Score) of various
stocks in the Tech sector. Quick View: Move mouse or cursor over stock symbol (ticker) to view short-term technical chart and over stock name to view long term chart. Click on  to add stock symbol to your watchlist and to add stock symbol to your watchlist and  to view watchlist. Click on any ticker or stock name for detailed market intelligence report for that stock. to view watchlist. Click on any ticker or stock name for detailed market intelligence report for that stock. |
12Stocks.com Performance of Stocks in Tech Sector
| Ticker | Stock Name | Watchlist | Category | Recent Price | Smart Investing & Trading Score | Change % | YTD Change% |
| KEYS | Keysight |   | Instruments | 175.16 | 90 | 1.19 | 8.90% |
| PANW | Palo Alto | | Software - Infrastructure | 209.26 | 100 | 1.19 | 15.78% |
| QRVO | Qorvo | | Semiconductors | 91.54 | 70 | 1.18 | 31.22% |
| ZM | Zoom | | Software - | 82.24 | 30 | 1.18 | 0.81% |
| EFII | Electronics for | | Computer | 20.95 | 20 | 1.16 | 0.00% |
| LLTC | Linear | | Semiconductor | 91.37 | 100 | 1.16 | 0.00% |
| SHOP | Shopify | | Software - | 151.30 | 80 | 1.16 | 40.70% |
| DHX | DHI | | Software - | 2.67 | 10 | 1.14 | 52.57% |
| MOMO | Hello | | Internet Content & Information | 7.55 | 50 | 1.14 | 8.10% |
| PLTR | Palantir | | Software - Infrastructure | 187.05 | 90 | 1.14 | 148.77% |
| PLXS | Plexus Corp | | Electronic Components | 147.29 | 100 | 1.13 | -5.11% |
| SPSC | SPS Commerce | | Software - | 104.54 | 30 | 1.13 | -42.81% |
| DBX | Dropbox | | Software - Infrastructure | 29.86 | 30 | 1.13 | 1.00% |
| HUBS | HubSpot | | Software - | 445.16 | 0 | 1.12 | -36.17% |
| TNGO | Tangoe | | Software | 0.91 | 10 | 1.11 | 0.00% |
| ESTC | Elastic N.V | | Software - | 87.58 | 80 | 1.11 | -11.62% |
| FNSR | Finisar | | Networking | 97.80 | 60 | 1.10 | 0.00% |
| ATEN | A10 Networks | | Software - Infrastructure | 18.49 | 90 | 1.09 | 2.50% |
| NCIT | NCI | | IT | 10.30 | 30 | 1.08 | 0.00% |
| MLAB | Mesa | | Instruments | 71.23 | 70 | 1.08 | -45.88% |
| PAYC | Paycom Software | | Software - | 201.38 | 0 | 1.08 | 0.31% |
| FLIR | FLIR Systems | | Instruments | 79.70 | 100 | 1.07 | 0.00% |
| BRCD | Brocade | | Data Storage | 79.70 | 100 | 1.07 | 0.00% |
| TLK | Telkom Indonesia | | Telecom | 18.90 | 70 | 1.07 | 22.91% |
| SINA | SINA | | Internet | 79.70 | 100 | 1.07 | 0.00% |
| For chart view version of above stock list: Chart View ➞ 0 - 25 , 25 - 50 , 50 - 75 , 75 - 100 , 100 - 125 , 125 - 150 , 150 - 175 , 175 - 200 , 200 - 225 , 225 - 250 , 250 - 275 , 275 - 300 , 300 - 325 , 325 - 350 , 350 - 375 , 375 - 400 , 400 - 425 , 425 - 450 , 450 - 475 , 475 - 500 , 500 - 525 , 525 - 550 , 550 - 575 , 575 - 600 , 600 - 625 , 625 - 650 , 650 - 675 , 675 - 700 , 700 - 725 , 725 - 750 , 750 - 775 , 775 - 800 , 800 - 825 , 825 - 850 , 850 - 875 , 875 - 900 | ||
 | Click To Change The Sort Order: By Market Cap or Company Size Performance: Year-to-date, Week and Day |  |
|
Get the most comprehensive stock market coverage daily at 12Stocks.com ➞ Best Stocks Today ➞ Best Stocks Weekly ➞ Best Stocks Year-to-Date ➞ Best Stocks Trends ➞  Best Stocks Today 12Stocks.com Best Nasdaq Stocks ➞ Best S&P 500 Stocks ➞ Best Tech Stocks ➞ Best Biotech Stocks ➞ |
| Detailed Overview of Tech Stocks |
| Tech Technical Overview, Leaders & Laggards, Top Tech ETF Funds & Detailed Tech Stocks List, Charts, Trends & More |
| Tech Sector: Technical Analysis, Trends & YTD Performance | |
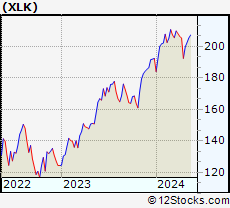
| Technology sector is composed of stocks
from semiconductors, software, web, social media
and services subsectors. Technology sector, as represented by XLK, an exchange-traded fund [ETF] that holds basket of tech stocks (e.g, Intel, Google) is up by 23.7823% and is currently outperforming the overall market by 9.0244% year-to-date. Below is a quick view of technical charts and trends: |
|
 XLK Weekly Chart |
|
| Long Term Trend: Very Good | |
| Medium Term Trend: Good | |
 XLK Daily Chart |
|
| Short Term Trend: Very Good | |
| Overall Trend Score: 100 | |
| YTD Performance: 23.7823% | |
| **Trend Scores & Views Are Only For Educational Purposes And Not For Investing | |
| 12Stocks.com: Top Performing Technology Sector Stocks | ||||||||||||||||||||||||||||||||||||||||||||||||
 The top performing Technology sector stocks year to date are
Now, more recently, over last week, the top performing Technology sector stocks on the move are


|
||||||||||||||||||||||||||||||||||||||||||||||||
| 12Stocks.com: Investing in Tech Sector using Exchange Traded Funds | |
|
The following table shows list of key exchange traded funds (ETF) that
help investors track Tech Index. For detailed view, check out our ETF Funds section of our website. Quick View: Move mouse or cursor over ETF symbol (ticker) to view short-term technical chart and over ETF name to view long term chart. Click on ticker or stock name for detailed view. Click on to add stock symbol to your watchlist and to view watchlist. |
12Stocks.com List of ETFs that track Tech Index
| Ticker | ETF Name | Watchlist | Recent Price | Smart Investing & Trading Score | Change % | Week % | Year-to-date % |
| IGN | Tech-Multimd Ntwk | | 53.86 | 40 | 0.918119 | -20.6435 | 0% |
| 12Stocks.com: Charts, Trends, Fundamental Data and Performances of Tech Stocks | |
|
We now take in-depth look at all Tech stocks including charts, multi-period performances and overall trends (as measured by Smart Investing & Trading Score). One can sort Tech stocks (click link to choose) by Daily, Weekly and by Year-to-Date performances. Also, one can sort by size of the company or by market capitalization. |
| Select Your Default Chart Type: | |||||
| |||||
| Click on stock symbol or name for detailed view. Click on to add stock symbol to your watchlist and to view watchlist. Quick View: Move mouse or cursor over "Daily" to quickly view daily technical stock chart and over "Weekly" to view weekly technical stock chart. | |||||


 | KEYS Keysight Technologies Inc |
| Sector: Technology | |
| SubSector: Scientific & Technical Instruments | |
| MarketCap: 28854.7 Millions | |
| Recent Price: 175.16 Smart Investing & Trading Score: 90 | |
| Day Percent Change: 1.19006% Day Change: 1.33 | |
| Week Change: 0.430021% Year-to-date Change: 8.9% | |
| KEYS Links: Profile News Message Board | |
| Charts:- Daily , Weekly | |
| Add KEYS to Watchlist: View: Get Complete KEYS Trend Analysis ➞ | |
 | PANW Palo Alto Networks Inc |
| Sector: Technology | |
| SubSector: Software - Infrastructure | |
| MarketCap: 130074 Millions | |
| Recent Price: 209.26 Smart Investing & Trading Score: 100 | |
| Day Percent Change: 1.18956% Day Change: 1.5 | |
| Week Change: 4.26507% Year-to-date Change: 15.8% | |
| PANW Links: Profile News Message Board | |
| Charts:- Daily , Weekly | |
| Add PANW to Watchlist: View: Get Complete PANW Trend Analysis ➞ | |
 | QRVO Qorvo Inc |
| Sector: Technology | |
| SubSector: Semiconductors | |
| MarketCap: 8606.65 Millions | |
| Recent Price: 91.54 Smart Investing & Trading Score: 70 | |
| Day Percent Change: 1.18271% Day Change: 1.26 | |
| Week Change: -1.85483% Year-to-date Change: 31.2% | |
| QRVO Links: Profile News Message Board | |
| Charts:- Daily , Weekly | |
| Add QRVO to Watchlist: View: Get Complete QRVO Trend Analysis ➞ | |
 | ZM Zoom Communications Inc |
| Sector: Technology | |
| SubSector: Software - Application | |
| MarketCap: 25044.6 Millions | |
| Recent Price: 82.24 Smart Investing & Trading Score: 30 | |
| Day Percent Change: 1.1811% Day Change: 0.72 | |
| Week Change: -0.927599% Year-to-date Change: 0.8% | |
| ZM Links: Profile News Message Board | |
| Charts:- Daily , Weekly | |
| Add ZM to Watchlist: View: Get Complete ZM Trend Analysis ➞ | |
 | EFII Electronics for Imaging, Inc. |
| Sector: Technology | |
| SubSector: Computer Peripherals | |
| MarketCap: 2161.67 Millions | |
| Recent Price: 20.95 Smart Investing & Trading Score: 20 | |
| Day Percent Change: 1.15886% Day Change: -9999 | |
| Week Change: -5.92726% Year-to-date Change: 0.0% | |
| EFII Links: Profile News Message Board | |
| Charts:- Daily , Weekly | |
| Add EFII to Watchlist: View: Get Complete EFII Trend Analysis ➞ | |
 | LLTC Linear Technology Corporation |
| Sector: Technology | |
| SubSector: Semiconductor - Specialized | |
| MarketCap: 15715.7 Millions | |
| Recent Price: 91.37 Smart Investing & Trading Score: 100 | |
| Day Percent Change: 1.16253% Day Change: -9999 | |
| Week Change: 17.6084% Year-to-date Change: 0.0% | |
| LLTC Links: Profile News Message Board | |
| Charts:- Daily , Weekly | |
| Add LLTC to Watchlist: View: Get Complete LLTC Trend Analysis ➞ | |
 | SHOP Shopify Inc |
| Sector: Technology | |
| SubSector: Software - Application | |
| MarketCap: 190816 Millions | |
| Recent Price: 151.30 Smart Investing & Trading Score: 80 | |
| Day Percent Change: 1.15665% Day Change: 0.03 | |
| Week Change: 1.65961% Year-to-date Change: 40.7% | |
| SHOP Links: Profile News Message Board | |
| Charts:- Daily , Weekly | |
| Add SHOP to Watchlist: View: Get Complete SHOP Trend Analysis ➞ | |
 | DHX DHI Group Inc |
| Sector: Technology | |
| SubSector: Software - Application | |
| MarketCap: 142.59 Millions | |
| Recent Price: 2.67 Smart Investing & Trading Score: 10 | |
| Day Percent Change: 1.13636% Day Change: -0.16 | |
| Week Change: -4.98221% Year-to-date Change: 52.6% | |
| DHX Links: Profile News Message Board | |
| Charts:- Daily , Weekly | |
| Add DHX to Watchlist: View: Get Complete DHX Trend Analysis ➞ | |
 | MOMO Hello Group Inc ADR |
| Sector: Technology | |
| SubSector: Internet Content & Information | |
| MarketCap: 1026.57 Millions | |
| Recent Price: 7.55 Smart Investing & Trading Score: 50 | |
| Day Percent Change: 1.13788% Day Change: 0.13 | |
| Week Change: -0.329815% Year-to-date Change: 8.1% | |
| MOMO Links: Profile News Message Board | |
| Charts:- Daily , Weekly | |
| Add MOMO to Watchlist: View: Get Complete MOMO Trend Analysis ➞ | |
 | PLTR Palantir Technologies Inc |
| Sector: Technology | |
| SubSector: Software - Infrastructure | |
| MarketCap: 363230 Millions | |
| Recent Price: 187.05 Smart Investing & Trading Score: 90 | |
| Day Percent Change: 1.13544% Day Change: 0.92 | |
| Week Change: 4.17131% Year-to-date Change: 148.8% | |
| PLTR Links: Profile News Message Board | |
| Charts:- Daily , Weekly | |
| Add PLTR to Watchlist: View: Get Complete PLTR Trend Analysis ➞ | |
 | PLXS Plexus Corp |
| Sector: Technology | |
| SubSector: Electronic Components | |
| MarketCap: 3750.35 Millions | |
| Recent Price: 147.29 Smart Investing & Trading Score: 100 | |
| Day Percent Change: 1.12599% Day Change: 1.84 | |
| Week Change: 2.484% Year-to-date Change: -5.1% | |
| PLXS Links: Profile News Message Board | |
| Charts:- Daily , Weekly | |
| Add PLXS to Watchlist: View: Get Complete PLXS Trend Analysis ➞ | |
 | SPSC SPS Commerce Inc |
| Sector: Technology | |
| SubSector: Software - Application | |
| MarketCap: 4192.71 Millions | |
| Recent Price: 104.54 Smart Investing & Trading Score: 30 | |
| Day Percent Change: 1.13186% Day Change: 1.87 | |
| Week Change: -2.74444% Year-to-date Change: -42.8% | |
| SPSC Links: Profile News Message Board | |
| Charts:- Daily , Weekly | |
| Add SPSC to Watchlist: View: Get Complete SPSC Trend Analysis ➞ | |
 | DBX Dropbox Inc |
| Sector: Technology | |
| SubSector: Software - Infrastructure | |
| MarketCap: 7811.82 Millions | |
| Recent Price: 29.86 Smart Investing & Trading Score: 30 | |
| Day Percent Change: 1.13482% Day Change: 0.31 | |
| Week Change: -4.79911% Year-to-date Change: 1.0% | |
| DBX Links: Profile News Message Board | |
| Charts:- Daily , Weekly | |
| Add DBX to Watchlist: View: Get Complete DBX Trend Analysis ➞ | |
 | HUBS HubSpot Inc |
| Sector: Technology | |
| SubSector: Software - Application | |
| MarketCap: 25689.5 Millions | |
| Recent Price: 445.16 Smart Investing & Trading Score: 0 | |
| Day Percent Change: 1.11528% Day Change: 1.13 | |
| Week Change: -13.6199% Year-to-date Change: -36.2% | |
| HUBS Links: Profile News Message Board | |
| Charts:- Daily , Weekly | |
| Add HUBS to Watchlist: View: Get Complete HUBS Trend Analysis ➞ | |
 | TNGO Tangoe, Inc. |
| Sector: Technology | |
| SubSector: Business Software & Services | |
| MarketCap: 182.17 Millions | |
| Recent Price: 0.91 Smart Investing & Trading Score: 10 | |
| Day Percent Change: 1.11111% Day Change: -9999 | |
| Week Change: -69.4631% Year-to-date Change: 0.0% | |
| TNGO Links: Profile News Message Board | |
| Charts:- Daily , Weekly | |
| Add TNGO to Watchlist: View: Get Complete TNGO Trend Analysis ➞ | |
 | ESTC Elastic N.V |
| Sector: Technology | |
| SubSector: Software - Application | |
| MarketCap: 9214.75 Millions | |
| Recent Price: 87.58 Smart Investing & Trading Score: 80 | |
| Day Percent Change: 1.10829% Day Change: 1.43 | |
| Week Change: 1.99138% Year-to-date Change: -11.6% | |
| ESTC Links: Profile News Message Board | |
| Charts:- Daily , Weekly | |
| Add ESTC to Watchlist: View: Get Complete ESTC Trend Analysis ➞ | |
 | FNSR Finisar Corporation |
| Sector: Technology | |
| SubSector: Networking & Communication Devices | |
| MarketCap: 3805.99 Millions | |
| Recent Price: 97.80 Smart Investing & Trading Score: 60 | |
| Day Percent Change: 1.09572% Day Change: -9999 | |
| Week Change: 2.44056% Year-to-date Change: 0.0% | |
| FNSR Links: Profile News Message Board | |
| Charts:- Daily , Weekly | |
| Add FNSR to Watchlist: View: Get Complete FNSR Trend Analysis ➞ | |
 | ATEN A10 Networks Inc |
| Sector: Technology | |
| SubSector: Software - Infrastructure | |
| MarketCap: 1272.77 Millions | |
| Recent Price: 18.49 Smart Investing & Trading Score: 90 | |
| Day Percent Change: 1.09349% Day Change: -0.02 | |
| Week Change: 1.37061% Year-to-date Change: 2.5% | |
| ATEN Links: Profile News Message Board | |
| Charts:- Daily , Weekly | |
| Add ATEN to Watchlist: View: Get Complete ATEN Trend Analysis ➞ | |
 | NCIT NCI, Inc. |
| Sector: Technology | |
| SubSector: Information Technology Services | |
| MarketCap: 202.37 Millions | |
| Recent Price: 10.30 Smart Investing & Trading Score: 30 | |
| Day Percent Change: 1.07949% Day Change: -9999 | |
| Week Change: -45.3581% Year-to-date Change: 0.0% | |
| NCIT Links: Profile News Message Board | |
| Charts:- Daily , Weekly | |
| Add NCIT to Watchlist: View: Get Complete NCIT Trend Analysis ➞ | |
 | MLAB Mesa Laboratories, Inc |
| Sector: Technology | |
| SubSector: Scientific & Technical Instruments | |
| MarketCap: 356.22 Millions | |
| Recent Price: 71.23 Smart Investing & Trading Score: 70 | |
| Day Percent Change: 1.07847% Day Change: -1.96 | |
| Week Change: 7.25794% Year-to-date Change: -45.9% | |
| MLAB Links: Profile News Message Board | |
| Charts:- Daily , Weekly | |
| Add MLAB to Watchlist: View: Get Complete MLAB Trend Analysis ➞ | |
 | PAYC Paycom Software Inc |
| Sector: Technology | |
| SubSector: Software - Application | |
| MarketCap: 12971.3 Millions | |
| Recent Price: 201.38 Smart Investing & Trading Score: 0 | |
| Day Percent Change: 1.07915% Day Change: 1.89 | |
| Week Change: -7.37743% Year-to-date Change: 0.3% | |
| PAYC Links: Profile News Message Board | |
| Charts:- Daily , Weekly | |
| Add PAYC to Watchlist: View: Get Complete PAYC Trend Analysis ➞ | |
 | FLIR FLIR Systems, Inc. |
| Sector: Technology | |
| SubSector: Scientific & Technical Instruments | |
| MarketCap: 3885.63 Millions | |
| Recent Price: 79.70 Smart Investing & Trading Score: 100 | |
| Day Percent Change: 1.06518% Day Change: -9999 | |
| Week Change: 38.9955% Year-to-date Change: 0.0% | |
| FLIR Links: Profile News Message Board | |
| Charts:- Daily , Weekly | |
| Add FLIR to Watchlist: View: Get Complete FLIR Trend Analysis ➞ | |
 | BRCD Brocade Communications Systems, Inc. |
| Sector: Technology | |
| SubSector: Data Storage Devices | |
| MarketCap: 5047.24 Millions | |
| Recent Price: 79.70 Smart Investing & Trading Score: 100 | |
| Day Percent Change: 1.06518% Day Change: -9999 | |
| Week Change: 64.9762% Year-to-date Change: 0.0% | |
| BRCD Links: Profile News Message Board | |
| Charts:- Daily , Weekly | |
| Add BRCD to Watchlist: View: Get Complete BRCD Trend Analysis ➞ | |
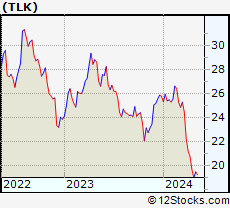 | TLK Telkom Indonesia (Persero) Tbk PT ADR |
| Sector: Technology | |
| SubSector: Telecom Services | |
| MarketCap: 19237.4 Millions | |
| Recent Price: 18.90 Smart Investing & Trading Score: 70 | |
| Day Percent Change: 1.06952% Day Change: 0.21 | |
| Week Change: -0.943396% Year-to-date Change: 22.9% | |
| TLK Links: Profile News Message Board | |
| Charts:- Daily , Weekly | |
| Add TLK to Watchlist: View: Get Complete TLK Trend Analysis ➞ | |
 | SINA SINA Corporation |
| Sector: Technology | |
| SubSector: Internet Software & Services | |
| MarketCap: 2168.61 Millions | |
| Recent Price: 79.70 Smart Investing & Trading Score: 100 | |
| Day Percent Change: 1.06518% Day Change: -9999 | |
| Week Change: 64.9762% Year-to-date Change: 0.0% | |
| SINA Links: Profile News Message Board | |
| Charts:- Daily , Weekly | |
| Add SINA to Watchlist: View: Get Complete SINA Trend Analysis ➞ | |
| For tabular summary view of above stock list: Summary View ➞ 0 - 25 , 25 - 50 , 50 - 75 , 75 - 100 , 100 - 125 , 125 - 150 , 150 - 175 , 175 - 200 , 200 - 225 , 225 - 250 , 250 - 275 , 275 - 300 , 300 - 325 , 325 - 350 , 350 - 375 , 375 - 400 , 400 - 425 , 425 - 450 , 450 - 475 , 475 - 500 , 500 - 525 , 525 - 550 , 550 - 575 , 575 - 600 , 600 - 625 , 625 - 650 , 650 - 675 , 675 - 700 , 700 - 725 , 725 - 750 , 750 - 775 , 775 - 800 , 800 - 825 , 825 - 850 , 850 - 875 , 875 - 900 | ||
| Click To Change The Sort Order: By Market Cap or Company Size Performance: Year-to-date, Week and Day | |
| Select Chart Type: | ||
|
Best Stocks Today 12Stocks.com |
© 2025 12Stocks.com Terms & Conditions Privacy Contact Us
All Information Provided Only For Education And Not To Be Used For Investing or Trading. See Terms & Conditions


One More Thing ... Get Best Stocks Delivered Daily!
Never Ever Miss A Move With Our Top Ten Stocks Lists
Find Best Stocks In Any Market - Bull or Bear Market
Take A Peek At Our Top Ten Stocks Lists: Daily, Weekly, Year-to-Date & Top Trends
Find Best Stocks In Any Market - Bull or Bear Market
Take A Peek At Our Top Ten Stocks Lists: Daily, Weekly, Year-to-Date & Top Trends
Technology Stocks With Best Up Trends [0-bearish to 100-bullish]: Sony [100], Bakkt [100], Rigetti Computing[100], Fair Isaac[100], Arqit Quantum[100], D-Wave Quantum[100], Navitas Semiconductor[100], Shoals [100], Vuzix [100], Arteris [100], Lantronix [100]
Best Technology Stocks Year-to-Date:
Xunlei [370.476%], Sify [315.033%], Wolfspeed [307.01%], Digital Turbine[265.057%], EchoStar Corp[247.253%], CuriosityStream [241.605%], Viasat [224.029%], Pagaya [222.638%], Oneconnect Financial[209.053%], D-Wave Quantum[203.954%], CommScope Holding[203.101%] Best Technology Stocks This Week:
GTT [443626%], Barracuda Networks[71050%], Mobile TeleSystems[10483.5%], Nam Tai[5033.33%], Ebix [4200.85%], Fang [4150%], NantHealth [3114.02%], Hemisphere Media[2981.82%], Yandex N.V[2935.27%], Wolfspeed [1961.98%], Castlight Health[1751.96%] Best Technology Stocks Daily:
Sony [194.565%], Bakkt [28.6091%], Rigetti Computing[18.4925%], Fair Isaac[17.979%], Arqit Quantum[17.9369%], Marti [17%], Latch [16.6667%], Oclaro [14.734%], D-Wave Quantum[13.968%], Arbe Robotics[13.0178%], Navitas Semiconductor[12.3288%]