
 Login Sign Up


| |||||
 |  | ||||

| 12Stocks.com Market Intelligence |
Best SmallCap Stocks
|
| In a hurry? Small Cap Stock Lists: Performance Trends Table, Stock Charts
Sort Small Cap stocks: Daily, Weekly, Year-to-Date, Market Cap & Trends. Filter Small Cap stocks list by sector: Show all, Tech, Finance, Energy, Staples, Retail, Industrial, Materials, Utilities and HealthCare Filter Small Cap stocks list by size: All Large Medium Small and MicroCap |
| 12Stocks.com Small Cap Stocks Performances & Trends Daily | |||||||||
|
|  The overall Smart Investing & Trading Score is 44 (0-bearish to 100-bullish) which puts Small Cap index in short term neutral trend. The Smart Investing & Trading Score from previous trading session is 58 and hence a deterioration of trend.
| ||||||||
Here are the Smart Investing & Trading Scores of the most requested small cap stocks at 12Stocks.com (click stock name for detailed review):
|


| 12Stocks.com: Investing in Smallcap Index with Stocks | |
|
The following table helps investors and traders sort through current performance and trends (as measured by Smart Investing & Trading Score) of various
stocks in the Smallcap Index. Quick View: Move mouse or cursor over stock symbol (ticker) to view short-term technical chart and over stock name to view long term chart. Click on  to add stock symbol to your watchlist and to add stock symbol to your watchlist and  to view watchlist. Click on any ticker or stock name for detailed market intelligence report for that stock. to view watchlist. Click on any ticker or stock name for detailed market intelligence report for that stock. |
12Stocks.com Performance of Stocks in Smallcap Index
| Ticker | Stock Name | Watchlist | Category | Recent Price | Smart Investing & Trading Score | Change % | YTD Change% |
| PSMT | PriceSmart |   | Services & Goods | 80.17 | 53 | -0.91 | 5.79% |
| USLM | United States | | Industrials | 301.24 | 68 | -0.91 | 30.77% |
| ARAY | Accuray | | Health Care | 2.18 | 25 | -0.91 | -22.97% |
| KRMD | Repro Med | | Health Care | 2.18 | 80 | -0.91 | -11.20% |
| PWSC | PowerSchool | | Technology | 17.38 | 10 | -0.91 | -26.48% |
| NJR | New Jersey | | Utilities | 43.30 | 93 | -0.92 | -2.87% |
| HEAR | Turtle Beach | | Technology | 14.05 | 41 | -0.92 | 28.31% |
| INBX | Inhibrx | | Health Care | 34.07 | 18 | -0.92 | -10.37% |
| CAL | Caleres | | Consumer Staples | 36.39 | 63 | -0.93 | 18.42% |
| BE | Bloom Energy | | Utilities | 9.55 | 28 | -0.93 | -35.47% |
| LXFR | Luxfer | | Industrials | 9.59 | 46 | -0.93 | 7.27% |
| CHEF | Chefs | | Consumer Staples | 32.86 | 61 | -0.93 | 11.65% |
| EQBK | Equity Bancshares | | Financials | 33.64 | 86 | -0.94 | -0.77% |
| ADNT | Adient | | Consumer Staples | 29.41 | 42 | -0.94 | -19.11% |
| BHE | Benchmark Electronics | | Technology | 30.30 | 93 | -0.95 | 9.62% |
| FBMS | First Bancshares | | Financials | 25.04 | 74 | -0.95 | -14.63% |
| ATEN | A10 s | | Technology | 13.58 | 93 | -0.95 | 3.11% |
| IHRT | iHeartMedia | | Services & Goods | 2.09 | 45 | -0.95 | -21.72% |
| PAHC | Phibro Animal | | Health Care | 12.44 | 51 | -0.96 | 7.43% |
| CCRN | Cross Country | | Services & Goods | 17.40 | 45 | -0.97 | -23.14% |
| NSIT | Insight Enterprises | | Technology | 182.57 | 55 | -0.97 | 3.04% |
| NWPX | Northwest Pipe | | Materials | 31.49 | 54 | -0.97 | 4.06% |
| B | Barnes Group | | Industrials | 35.91 | 76 | -0.97 | 10.05% |
| OB | Outbrain | | Services & Goods | 4.07 | 75 | -0.97 | -7.08% |
| ALLK | Allakos | | Health Care | 1.01 | 20 | -0.98 | -63.00% |


| Too many stocks? View smallcap stocks filtered by marketcap & sector |
| Marketcap: All SmallCap Stocks (default-no microcap), Large, Mid-Range, Small |
| Smallcap Sector: Tech, Finance, Energy, Staples, Retail, Industrial, Materials, & Medical |
|
Get the most comprehensive stock market coverage daily at 12Stocks.com ➞ Best Stocks Today ➞ Best Stocks Weekly ➞ Best Stocks Year-to-Date ➞ Best Stocks Trends ➞  Best Stocks Today 12Stocks.com Best Nasdaq Stocks ➞ Best S&P 500 Stocks ➞ Best Tech Stocks ➞ Best Biotech Stocks ➞ |
| Detailed Overview of SmallCap Stocks |
| SmallCap Technical Overview, Leaders & Laggards, Top SmallCap ETF Funds & Detailed SmallCap Stocks List, Charts, Trends & More |
| Smallcap: Technical Analysis, Trends & YTD Performance | |
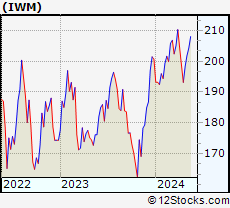
| SmallCap segment as represented by
IWM, an exchange-traded fund [ETF], holds basket of thousands of smallcap stocks from across all major sectors of the US stock market. The smallcap index (contains stocks like Riverbed & Sotheby's) is down by -2.11% and is currently underperforming the overall market by -7.27% year-to-date. Below is a quick view of technical charts and trends: | |
 IWM Weekly Chart |
|
| Long Term Trend: Good | |
| Medium Term Trend: Not Good | |
 IWM Daily Chart |
|
| Short Term Trend: Very Good | |
| Overall Trend Score: 44 | |
| YTD Performance: -2.11% | |
| **Trend Scores & Views Are Only For Educational Purposes And Not For Investing | |
| 12Stocks.com: Top Performing Small Cap Index Stocks | ||||||||||||||||||||||||||||||||||||||||||||||||
 The top performing Small Cap Index stocks year to date are
Now, more recently, over last week, the top performing Small Cap Index stocks on the move are


|
||||||||||||||||||||||||||||||||||||||||||||||||
| 12Stocks.com: Investing in Smallcap Index using Exchange Traded Funds | |
|
The following table shows list of key exchange traded funds (ETF) that
help investors track Smallcap index. The following list also includes leveraged ETF funds that track twice or thrice the daily returns of Smallcap indices. Short or inverse ETF funds move in the opposite direction to the index they track and are useful during market pullbacks or during bear markets. Quick View: Move mouse or cursor over ETF symbol (ticker) to view short-term technical chart and over ETF name to view long term chart. Click on ticker or stock name for detailed view. Click on to add stock symbol to your watchlist and to view watchlist. |
12Stocks.com List of ETFs that track Smallcap Index
| Ticker | ETF Name | Watchlist | Recent Price | Smart Investing & Trading Score | Change % | Week % | Year-to-date % |
| IWM | iShares Russell 2000 | | 196.48 | 44 | -0.61 | 1.73 | -2.11% |
| IJR | iShares Core S&P Small-Cap | | 104.86 | 78 | -0.80 | 1.59 | -3.13% |
| VTWO | Vanguard Russell 2000 ETF | | 79.45 | 63 | -0.60 | 1.75 | -2.03% |
| IWN | iShares Russell 2000 Value | | 150.18 | 68 | -0.73 | 1.62 | -3.32% |
| IWO | iShares Russell 2000 Growth | | 249.86 | 51 | -0.56 | 1.86 | -0.94% |
| IJS | iShares S&P Small-Cap 600 Value | | 96.69 | 60 | -1.04 | 1.13 | -6.19% |
| IJT | iShares S&P Small-Cap 600 Growth | | 125.06 | 63 | -0.25 | 2.33 | -0.06% |
| XSLV | PowerShares S&P SmallCap Low Volatil ETF | | 42.54 | 73 | -0.93 | 0.85 | -3.65% |
| SDD | ProShares UltraShort SmallCap600 | | 19.58 | 42 | 0.46 | -3.74 | 6.26% |
| SBB | ProShares Short SmallCap600 | | 16.50 | 40 | 0.79 | -2.02 | 3.58% |
| SMLV | SPDR SSGA US Small Cap Low Volatil ETF | | 107.33 | 73 | -1.01 | 1.17 | -4.61% |
| SAA | ProShares Ultra SmallCap600 | | 22.66 | 58 | -1.52 | 3.94 | -9.18% |
| 12Stocks.com: Charts, Trends, Fundamental Data and Performances of SmallCap Stocks | |
|
We now take in-depth look at all SmallCap stocks including charts, multi-period performances and overall trends (as measured by Smart Investing & Trading Score). One can sort SmallCap stocks (click link to choose) by Daily, Weekly and by Year-to-Date performances. Also, one can sort by size of the company or by market capitalization. |
| Select Your Default Chart Type: | |||||
| |||||
| Click on stock symbol or name for detailed view. Click on to add stock symbol to your watchlist and to view watchlist. Quick View: Move mouse or cursor over "Daily" to quickly view daily technical stock chart and over "Weekly" to view weekly technical stock chart. | |||||

 | PSMT PriceSmart, Inc. |
| Sector: Services & Goods | |
| SubSector: Discount, Variety Stores | |
| MarketCap: 1655.72 Millions | |
| Recent Price: 80.17 Smart Investing & Trading Score: 53 | |
| Day Percent Change: -0.91% Day Change: -0.74 | |
| Week Change: -3.23% Year-to-date Change: 5.8% | |
| PSMT Links: Profile News Message Board | |
| Charts:- Daily , Weekly | |
| Add PSMT to Watchlist: View: Get Complete PSMT Trend Analysis ➞ | |
 | USLM United States Lime & Minerals, Inc. |
| Sector: Industrials | |
| SubSector: General Building Materials | |
| MarketCap: 427.653 Millions | |
| Recent Price: 301.24 Smart Investing & Trading Score: 68 | |
| Day Percent Change: -0.91% Day Change: -2.76 | |
| Week Change: 1.51% Year-to-date Change: 30.8% | |
| USLM Links: Profile News Message Board | |
| Charts:- Daily , Weekly | |
| Add USLM to Watchlist: View: Get Complete USLM Trend Analysis ➞ | |
 | ARAY Accuray Incorporated |
| Sector: Health Care | |
| SubSector: Medical Appliances & Equipment | |
| MarketCap: 169.58 Millions | |
| Recent Price: 2.18 Smart Investing & Trading Score: 25 | |
| Day Percent Change: -0.91% Day Change: -0.02 | |
| Week Change: 1.87% Year-to-date Change: -23.0% | |
| ARAY Links: Profile News Message Board | |
| Charts:- Daily , Weekly | |
| Add ARAY to Watchlist: View: Get Complete ARAY Trend Analysis ➞ | |
 | KRMD Repro Med Systems, Inc. |
| Sector: Health Care | |
| SubSector: Medical Instruments & Supplies | |
| MarketCap: 340.06 Millions | |
| Recent Price: 2.18 Smart Investing & Trading Score: 80 | |
| Day Percent Change: -0.91% Day Change: -0.02 | |
| Week Change: 5.83% Year-to-date Change: -11.2% | |
| KRMD Links: Profile News Message Board | |
| Charts:- Daily , Weekly | |
| Add KRMD to Watchlist: View: Get Complete KRMD Trend Analysis ➞ | |
 | PWSC PowerSchool Holdings, Inc. |
| Sector: Technology | |
| SubSector: Software - Application | |
| MarketCap: 3870 Millions | |
| Recent Price: 17.38 Smart Investing & Trading Score: 10 | |
| Day Percent Change: -0.91% Day Change: -0.16 | |
| Week Change: -0.46% Year-to-date Change: -26.5% | |
| PWSC Links: Profile News Message Board | |
| Charts:- Daily , Weekly | |
| Add PWSC to Watchlist: View: Get Complete PWSC Trend Analysis ➞ | |
 | NJR New Jersey Resources Corporation |
| Sector: Utilities | |
| SubSector: Gas Utilities | |
| MarketCap: 3320.27 Millions | |
| Recent Price: 43.30 Smart Investing & Trading Score: 93 | |
| Day Percent Change: -0.92% Day Change: -0.40 | |
| Week Change: -0.14% Year-to-date Change: -2.9% | |
| NJR Links: Profile News Message Board | |
| Charts:- Daily , Weekly | |
| Add NJR to Watchlist: View: Get Complete NJR Trend Analysis ➞ | |
 | HEAR Turtle Beach Corporation |
| Sector: Technology | |
| SubSector: Communication Equipment | |
| MarketCap: 73.0539 Millions | |
| Recent Price: 14.05 Smart Investing & Trading Score: 41 | |
| Day Percent Change: -0.92% Day Change: -0.13 | |
| Week Change: -2.7% Year-to-date Change: 28.3% | |
| HEAR Links: Profile News Message Board | |
| Charts:- Daily , Weekly | |
| Add HEAR to Watchlist: View: Get Complete HEAR Trend Analysis ➞ | |
 | INBX Inhibrx, Inc. |
| Sector: Health Care | |
| SubSector: Biotechnology | |
| MarketCap: 14187 Millions | |
| Recent Price: 34.07 Smart Investing & Trading Score: 18 | |
| Day Percent Change: -0.92% Day Change: -0.31 | |
| Week Change: -1.13% Year-to-date Change: -10.4% | |
| INBX Links: Profile News Message Board | |
| Charts:- Daily , Weekly | |
| Add INBX to Watchlist: View: Get Complete INBX Trend Analysis ➞ | |
 | CAL Caleres, Inc. |
| Sector: Consumer Staples | |
| SubSector: Textile - Apparel Footwear & Accessories | |
| MarketCap: 224.07 Millions | |
| Recent Price: 36.39 Smart Investing & Trading Score: 63 | |
| Day Percent Change: -0.93% Day Change: -0.34 | |
| Week Change: 3.2% Year-to-date Change: 18.4% | |
| CAL Links: Profile News Message Board | |
| Charts:- Daily , Weekly | |
| Add CAL to Watchlist: View: Get Complete CAL Trend Analysis ➞ | |
 | BE Bloom Energy Corporation |
| Sector: Utilities | |
| SubSector: Electric Utilities | |
| MarketCap: 567.514 Millions | |
| Recent Price: 9.55 Smart Investing & Trading Score: 28 | |
| Day Percent Change: -0.93% Day Change: -0.09 | |
| Week Change: -0.83% Year-to-date Change: -35.5% | |
| BE Links: Profile News Message Board | |
| Charts:- Daily , Weekly | |
| Add BE to Watchlist: View: Get Complete BE Trend Analysis ➞ | |
 | LXFR Luxfer Holdings PLC |
| Sector: Industrials | |
| SubSector: Diversified Machinery | |
| MarketCap: 406.716 Millions | |
| Recent Price: 9.59 Smart Investing & Trading Score: 46 | |
| Day Percent Change: -0.93% Day Change: -0.09 | |
| Week Change: -1.94% Year-to-date Change: 7.3% | |
| LXFR Links: Profile News Message Board | |
| Charts:- Daily , Weekly | |
| Add LXFR to Watchlist: View: Get Complete LXFR Trend Analysis ➞ | |
 | CHEF The Chefs Warehouse, Inc. |
| Sector: Consumer Staples | |
| SubSector: Food Wholesale | |
| MarketCap: 207.529 Millions | |
| Recent Price: 32.86 Smart Investing & Trading Score: 61 | |
| Day Percent Change: -0.93% Day Change: -0.31 | |
| Week Change: 1.36% Year-to-date Change: 11.7% | |
| CHEF Links: Profile News Message Board | |
| Charts:- Daily , Weekly | |
| Add CHEF to Watchlist: View: Get Complete CHEF Trend Analysis ➞ | |
 | EQBK Equity Bancshares, Inc. |
| Sector: Financials | |
| SubSector: Regional - Midwest Banks | |
| MarketCap: 272.87 Millions | |
| Recent Price: 33.64 Smart Investing & Trading Score: 86 | |
| Day Percent Change: -0.94% Day Change: -0.32 | |
| Week Change: 3.76% Year-to-date Change: -0.8% | |
| EQBK Links: Profile News Message Board | |
| Charts:- Daily , Weekly | |
| Add EQBK to Watchlist: View: Get Complete EQBK Trend Analysis ➞ | |
 | ADNT Adient plc |
| Sector: Consumer Staples | |
| SubSector: Auto Parts | |
| MarketCap: 1003.39 Millions | |
| Recent Price: 29.41 Smart Investing & Trading Score: 42 | |
| Day Percent Change: -0.94% Day Change: -0.28 | |
| Week Change: 2.01% Year-to-date Change: -19.1% | |
| ADNT Links: Profile News Message Board | |
| Charts:- Daily , Weekly | |
| Add ADNT to Watchlist: View: Get Complete ADNT Trend Analysis ➞ | |
 | BHE Benchmark Electronics, Inc. |
| Sector: Technology | |
| SubSector: Printed Circuit Boards | |
| MarketCap: 766.835 Millions | |
| Recent Price: 30.30 Smart Investing & Trading Score: 93 | |
| Day Percent Change: -0.95% Day Change: -0.29 | |
| Week Change: 2.26% Year-to-date Change: 9.6% | |
| BHE Links: Profile News Message Board | |
| Charts:- Daily , Weekly | |
| Add BHE to Watchlist: View: Get Complete BHE Trend Analysis ➞ | |
 | FBMS The First Bancshares, Inc. |
| Sector: Financials | |
| SubSector: Regional - Southeast Banks | |
| MarketCap: 359.535 Millions | |
| Recent Price: 25.04 Smart Investing & Trading Score: 74 | |
| Day Percent Change: -0.95% Day Change: -0.24 | |
| Week Change: 2% Year-to-date Change: -14.6% | |
| FBMS Links: Profile News Message Board | |
| Charts:- Daily , Weekly | |
| Add FBMS to Watchlist: View: Get Complete FBMS Trend Analysis ➞ | |
 | ATEN A10 Networks, Inc. |
| Sector: Technology | |
| SubSector: Communication Equipment | |
| MarketCap: 363.739 Millions | |
| Recent Price: 13.58 Smart Investing & Trading Score: 93 | |
| Day Percent Change: -0.95% Day Change: -0.13 | |
| Week Change: 4.95% Year-to-date Change: 3.1% | |
| ATEN Links: Profile News Message Board | |
| Charts:- Daily , Weekly | |
| Add ATEN to Watchlist: View: Get Complete ATEN Trend Analysis ➞ | |
 | IHRT iHeartMedia, Inc. |
| Sector: Services & Goods | |
| SubSector: Broadcasting - Radio | |
| MarketCap: 694 Millions | |
| Recent Price: 2.09 Smart Investing & Trading Score: 45 | |
| Day Percent Change: -0.95% Day Change: -0.02 | |
| Week Change: 10% Year-to-date Change: -21.7% | |
| IHRT Links: Profile News Message Board | |
| Charts:- Daily , Weekly | |
| Add IHRT to Watchlist: View: Get Complete IHRT Trend Analysis ➞ | |
 | PAHC Phibro Animal Health Corporation |
| Sector: Health Care | |
| SubSector: Specialized Health Services | |
| MarketCap: 852.956 Millions | |
| Recent Price: 12.44 Smart Investing & Trading Score: 51 | |
| Day Percent Change: -0.96% Day Change: -0.12 | |
| Week Change: -6.47% Year-to-date Change: 7.4% | |
| PAHC Links: Profile News Message Board | |
| Charts:- Daily , Weekly | |
| Add PAHC to Watchlist: View: Get Complete PAHC Trend Analysis ➞ | |
 | CCRN Cross Country Healthcare, Inc. |
| Sector: Services & Goods | |
| SubSector: Staffing & Outsourcing Services | |
| MarketCap: 348.328 Millions | |
| Recent Price: 17.40 Smart Investing & Trading Score: 45 | |
| Day Percent Change: -0.97% Day Change: -0.17 | |
| Week Change: -0.57% Year-to-date Change: -23.1% | |
| CCRN Links: Profile News Message Board | |
| Charts:- Daily , Weekly | |
| Add CCRN to Watchlist: View: Get Complete CCRN Trend Analysis ➞ | |
 | NSIT Insight Enterprises, Inc. |
| Sector: Technology | |
| SubSector: Information Technology Services | |
| MarketCap: 1498.48 Millions | |
| Recent Price: 182.57 Smart Investing & Trading Score: 55 | |
| Day Percent Change: -0.97% Day Change: -1.79 | |
| Week Change: -0.01% Year-to-date Change: 3.0% | |
| NSIT Links: Profile News Message Board | |
| Charts:- Daily , Weekly | |
| Add NSIT to Watchlist: View: Get Complete NSIT Trend Analysis ➞ | |
 | NWPX Northwest Pipe Company |
| Sector: Materials | |
| SubSector: Steel & Iron | |
| MarketCap: 245.788 Millions | |
| Recent Price: 31.49 Smart Investing & Trading Score: 54 | |
| Day Percent Change: -0.97% Day Change: -0.31 | |
| Week Change: -1.13% Year-to-date Change: 4.1% | |
| NWPX Links: Profile News Message Board | |
| Charts:- Daily , Weekly | |
| Add NWPX to Watchlist: View: Get Complete NWPX Trend Analysis ➞ | |
 | B Barnes Group Inc. |
| Sector: Industrials | |
| SubSector: Industrial Equipment & Components | |
| MarketCap: 2189.79 Millions | |
| Recent Price: 35.91 Smart Investing & Trading Score: 76 | |
| Day Percent Change: -0.97% Day Change: -0.35 | |
| Week Change: 0.42% Year-to-date Change: 10.1% | |
| B Links: Profile News Message Board | |
| Charts:- Daily , Weekly | |
| Add B to Watchlist: View: Get Complete B Trend Analysis ➞ | |
 | OB Outbrain Inc. |
| Sector: Services & Goods | |
| SubSector: Internet Content & Information | |
| MarketCap: 250 Millions | |
| Recent Price: 4.07 Smart Investing & Trading Score: 75 | |
| Day Percent Change: -0.97% Day Change: -0.04 | |
| Week Change: -0.49% Year-to-date Change: -7.1% | |
| OB Links: Profile News Message Board | |
| Charts:- Daily , Weekly | |
| Add OB to Watchlist: View: Get Complete OB Trend Analysis ➞ | |
 | ALLK Allakos Inc. |
| Sector: Health Care | |
| SubSector: Biotechnology | |
| MarketCap: 3233.55 Millions | |
| Recent Price: 1.01 Smart Investing & Trading Score: 20 | |
| Day Percent Change: -0.98% Day Change: -0.01 | |
| Week Change: -5.16% Year-to-date Change: -63.0% | |
| ALLK Links: Profile News Message Board | |
| Charts:- Daily , Weekly | |
| Add ALLK to Watchlist: View: Get Complete ALLK Trend Analysis ➞ | |
| Too many stocks? View smallcap stocks filtered by marketcap & sector |
| Marketcap: All SmallCap Stocks (default-no microcap), Large, Mid-Range, Small & MicroCap |
| Sector: Tech, Finance, Energy, Staples, Retail, Industrial, Materials, Utilities & Medical |
|
Best Stocks Today 12Stocks.com |
© 2024 12Stocks.com Terms & Conditions Privacy Contact Us
All Information Provided Only For Education And Not To Be Used For Investing or Trading. See Terms & Conditions


One More Thing ... Get Best Stocks Delivered Daily!
Never Ever Miss A Move With Our Top Ten Stocks Lists
Find Best Stocks In Any Market - Bull or Bear Market
Take A Peek At Our Top Ten Stocks Lists: Daily, Weekly, Year-to-Date & Top Trends
Find Best Stocks In Any Market - Bull or Bear Market
Take A Peek At Our Top Ten Stocks Lists: Daily, Weekly, Year-to-Date & Top Trends
Smallcap Stocks With Best Up Trends [0-bearish to 100-bullish]: B. Riley[100], Central Pacific[100], California Water[100], Cricut [100], Carpenter [100], Haemonetics [100], Sanmina [100], Trustmark [100], Comstock Resources[100], EchoStar [100], Mueller Industries[100]
Best Smallcap Stocks Year-to-Date:
CareMax [490.72%], Janux [338.34%], Viking [270.02%], Alpine Immune[239.52%], Longboard [218%], Super Micro[177%], Arcutis Bio[166.56%], Avidity Biosciences[159.79%], Vera [149.94%], Hippo [128.87%], Stoke [122.15%] Best Smallcap Stocks This Week:
Matterport [168.97%], B. Riley[73.54%], Impinj [33.73%], ProKidney [32.84%], Seres [32.65%], Riot Blockchain[32.64%], Ribbon [25.58%], Cullinan Oncology[22.92%], P.A.M. Transportation[22.85%], NuScale Power[21.44%], Hibbett Sports[21.03%] Best Smallcap Stocks Daily:
Impinj [28.65%], P.A.M. Transportation[17.95%], B. Riley[16.61%], Strategic Education[16.28%], OptiNose [14.56%], JELD-WEN Holding[11.54%], Sonic Automotive[10.86%], Intevac [10.54%], SiTime [8.84%], Noodles & [8.08%], ProKidney [7.75%]