
 Login Sign Up


| |||||
 |  | ||||

| 12Stocks.com Market Intelligence |
Best SmallCap Stocks
|
| In a hurry? Small Cap Stock Lists: Performance Trends Table, Stock Charts
Sort Small Cap stocks: Daily, Weekly, Year-to-Date, Market Cap & Trends. Filter Small Cap stocks list by sector: Show all, Tech, Finance, Energy, Staples, Retail, Industrial, Materials, Utilities and HealthCare Filter Small Cap stocks list by size: All Large Medium Small and MicroCap |
| 12Stocks.com Small Cap Stocks Performances & Trends Daily | |||||||||
|
|  The overall Smart Investing & Trading Score is 58 (0-bearish to 100-bullish) which puts Small Cap index in short term neutral trend. The Smart Investing & Trading Score from previous trading session is 63 and hence a deterioration of trend.
| ||||||||
Here are the Smart Investing & Trading Scores of the most requested small cap stocks at 12Stocks.com (click stock name for detailed review):
|


| 12Stocks.com: Investing in Smallcap Index with Stocks | |
|
The following table helps investors and traders sort through current performance and trends (as measured by Smart Investing & Trading Score) of various
stocks in the Smallcap Index. Quick View: Move mouse or cursor over stock symbol (ticker) to view short-term technical chart and over stock name to view long term chart. Click on  to add stock symbol to your watchlist and to add stock symbol to your watchlist and  to view watchlist. Click on any ticker or stock name for detailed market intelligence report for that stock. to view watchlist. Click on any ticker or stock name for detailed market intelligence report for that stock. |
12Stocks.com Performance of Stocks in Smallcap Index
| Ticker | Stock Name | Watchlist | Category | Recent Price | Smart Investing & Trading Score | Change % | YTD Change% |
| GOOD | Gladstone Commercial |   | Financials | 13.30 | 68 | -0.67 | 0.45% |
| CNK | Cinemark | | Services & Goods | 17.71 | 46 | -0.67 | 25.69% |
| VCEL | Vericel | | Health Care | 46.11 | 63 | -0.67 | 29.49% |
| GPMT | Granite Point | | Financials | 4.44 | 25 | -0.67 | -25.25% |
| PACK | Ranpak | | Industrials | 7.39 | 75 | -0.67 | 26.98% |
| IBEX | IBEX | | Technology | 13.33 | 35 | -0.67 | -29.77% |
| AGX | Argan | | Industrials | 61.21 | 76 | -0.68 | 30.82% |
| AMBC | Ambac Financial | | Financials | 14.54 | 25 | -0.68 | -11.77% |
| BATRK | Liberty Braves | | Services & Goods | 38.03 | 42 | -0.68 | -3.92% |
| SVV | Savers Value | | Services & Goods | 17.59 | 42 | -0.68 | -0.90% |
| OII | Oceaneering | | Energy | 23.05 | 68 | -0.69 | 8.32% |
| WAFD | Washington Federal | | Financials | 28.39 | 74 | -0.70 | -13.87% |
| IBCP | Independent Bank | | Financials | 25.12 | 69 | -0.71 | -3.46% |
| SXI | Standex | | Industrials | 171.37 | 66 | -0.71 | 8.20% |
| AMK | AssetMark Financial | | Financials | 34.90 | 61 | -0.71 | 16.53% |
| CEIX | CONSOL Energy | | Materials | 83.43 | 32 | -0.71 | -17.01% |
| BBUC | Brookfield Business | | Financials | 21.00 | 10 | -0.71 | -9.44% |
| DFH | Dream Finders | | Services & Goods | 36.20 | 58 | -0.71 | 0.56% |
| SPTN | SpartanNash | | Consumer Staples | 19.38 | 47 | -0.72 | -15.56% |
| OB | Outbrain | | Services & Goods | 4.11 | 75 | -0.72 | -6.16% |
| TWO | Two Harbors | | Financials | 12.47 | 64 | -0.72 | -10.48% |
| YEXT | Yext | | Technology | 5.50 | 0 | -0.72 | -6.62% |
| NRDS | NerdWallet | | Financials | 13.73 | 35 | -0.72 | -8.10% |
| IRBT | iRobot | | Consumer Staples | 6.84 | 20 | -0.73 | -82.33% |
| RYTM | Rhythm | | Health Care | 39.71 | 27 | -0.73 | -13.62% |


| Too many stocks? View smallcap stocks filtered by marketcap & sector |
| Marketcap: All SmallCap Stocks (default-no microcap), Large, Mid-Range, Small |
| Smallcap Sector: Tech, Finance, Energy, Staples, Retail, Industrial, Materials, & Medical |
|
Get the most comprehensive stock market coverage daily at 12Stocks.com ➞ Best Stocks Today ➞ Best Stocks Weekly ➞ Best Stocks Year-to-Date ➞ Best Stocks Trends ➞  Best Stocks Today 12Stocks.com Best Nasdaq Stocks ➞ Best S&P 500 Stocks ➞ Best Tech Stocks ➞ Best Biotech Stocks ➞ |
| Detailed Overview of SmallCap Stocks |
| SmallCap Technical Overview, Leaders & Laggards, Top SmallCap ETF Funds & Detailed SmallCap Stocks List, Charts, Trends & More |
| Smallcap: Technical Analysis, Trends & YTD Performance | |
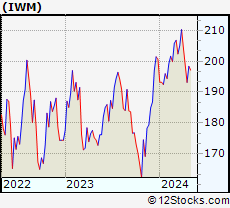
| SmallCap segment as represented by
IWM, an exchange-traded fund [ETF], holds basket of thousands of smallcap stocks from across all major sectors of the US stock market. The smallcap index (contains stocks like Riverbed & Sotheby's) is down by -1.51% and is currently underperforming the overall market by -7.17% year-to-date. Below is a quick view of technical charts and trends: | |
 IWM Weekly Chart |
|
| Long Term Trend: Good | |
| Medium Term Trend: Not Good | |
 IWM Daily Chart |
|
| Short Term Trend: Very Good | |
| Overall Trend Score: 58 | |
| YTD Performance: -1.51% | |
| **Trend Scores & Views Are Only For Educational Purposes And Not For Investing | |
| 12Stocks.com: Top Performing Small Cap Index Stocks | ||||||||||||||||||||||||||||||||||||||||||||||||
 The top performing Small Cap Index stocks year to date are
Now, more recently, over last week, the top performing Small Cap Index stocks on the move are


|
||||||||||||||||||||||||||||||||||||||||||||||||
| 12Stocks.com: Investing in Smallcap Index using Exchange Traded Funds | |
|
The following table shows list of key exchange traded funds (ETF) that
help investors track Smallcap index. The following list also includes leveraged ETF funds that track twice or thrice the daily returns of Smallcap indices. Short or inverse ETF funds move in the opposite direction to the index they track and are useful during market pullbacks or during bear markets. Quick View: Move mouse or cursor over ETF symbol (ticker) to view short-term technical chart and over ETF name to view long term chart. Click on ticker or stock name for detailed view. Click on to add stock symbol to your watchlist and to view watchlist. |
12Stocks.com List of ETFs that track Smallcap Index
| Ticker | ETF Name | Watchlist | Recent Price | Smart Investing & Trading Score | Change % | Week % | Year-to-date % |
| IWM | iShares Russell 2000 | | 197.68 | 58 | -0.45 | 2.35 | -1.51% |
| IJR | iShares Core S&P Small-Cap | | 105.71 | 85 | -0.24 | 2.41 | -2.35% |
| VTWO | Vanguard Russell 2000 ETF | | 79.93 | 63 | -0.45 | 2.37 | -1.44% |
| IWN | iShares Russell 2000 Value | | 151.28 | 75 | -0.30 | 2.37 | -2.61% |
| IWO | iShares Russell 2000 Growth | | 251.27 | 58 | -0.44 | 2.44 | -0.38% |
| IJS | iShares S&P Small-Cap 600 Value | | 97.71 | 60 | -0.43 | 2.2 | -5.2% |
| IJT | iShares S&P Small-Cap 600 Growth | | 125.37 | 70 | -0.28 | 2.59 | 0.18% |
| XSLV | PowerShares S&P SmallCap Low Volatil ETF | | 42.94 | 73 | -0.26 | 1.8 | -2.74% |
| SBB | ProShares Short SmallCap600 | | 16.37 | 33 | -0.02 | -2.79 | 2.76% |
| SMLV | SPDR SSGA US Small Cap Low Volatil ETF | | 108.43 | 73 | -0.31 | 2.21 | -3.63% |
| SAA | ProShares Ultra SmallCap600 | | 23.01 | 58 | -0.60 | 5.55 | -7.78% |
| SDD | ProShares UltraShort SmallCap600 | | 19.49 | 42 | 1.35 | -4.18 | 5.77% |
| 12Stocks.com: Charts, Trends, Fundamental Data and Performances of SmallCap Stocks | |
|
We now take in-depth look at all SmallCap stocks including charts, multi-period performances and overall trends (as measured by Smart Investing & Trading Score). One can sort SmallCap stocks (click link to choose) by Daily, Weekly and by Year-to-Date performances. Also, one can sort by size of the company or by market capitalization. |
| Select Your Default Chart Type: | |||||
| |||||
| Click on stock symbol or name for detailed view. Click on to add stock symbol to your watchlist and to view watchlist. Quick View: Move mouse or cursor over "Daily" to quickly view daily technical stock chart and over "Weekly" to view weekly technical stock chart. | |||||

 | GOOD Gladstone Commercial Corporation |
| Sector: Financials | |
| SubSector: REIT - Diversified | |
| MarketCap: 425.253 Millions | |
| Recent Price: 13.30 Smart Investing & Trading Score: 68 | |
| Day Percent Change: -0.67% Day Change: -0.09 | |
| Week Change: 1.14% Year-to-date Change: 0.5% | |
| GOOD Links: Profile News Message Board | |
| Charts:- Daily , Weekly | |
| Add GOOD to Watchlist: View: Get Complete GOOD Trend Analysis ➞ | |
 | CNK Cinemark Holdings, Inc. |
| Sector: Services & Goods | |
| SubSector: Movie Production, Theaters | |
| MarketCap: 1776.29 Millions | |
| Recent Price: 17.71 Smart Investing & Trading Score: 46 | |
| Day Percent Change: -0.67% Day Change: -0.12 | |
| Week Change: -2.8% Year-to-date Change: 25.7% | |
| CNK Links: Profile News Message Board | |
| Charts:- Daily , Weekly | |
| Add CNK to Watchlist: View: Get Complete CNK Trend Analysis ➞ | |
 | VCEL Vericel Corporation |
| Sector: Health Care | |
| SubSector: Biotechnology | |
| MarketCap: 391.885 Millions | |
| Recent Price: 46.11 Smart Investing & Trading Score: 63 | |
| Day Percent Change: -0.67% Day Change: -0.31 | |
| Week Change: 5.42% Year-to-date Change: 29.5% | |
| VCEL Links: Profile News Message Board | |
| Charts:- Daily , Weekly | |
| Add VCEL to Watchlist: View: Get Complete VCEL Trend Analysis ➞ | |
 | GPMT Granite Point Mortgage Trust Inc. |
| Sector: Financials | |
| SubSector: Mortgage Investment | |
| MarketCap: 289.739 Millions | |
| Recent Price: 4.44 Smart Investing & Trading Score: 25 | |
| Day Percent Change: -0.67% Day Change: -0.03 | |
| Week Change: 1.14% Year-to-date Change: -25.3% | |
| GPMT Links: Profile News Message Board | |
| Charts:- Daily , Weekly | |
| Add GPMT to Watchlist: View: Get Complete GPMT Trend Analysis ➞ | |
 | PACK Ranpak Holdings Corp. |
| Sector: Industrials | |
| SubSector: Conglomerates | |
| MarketCap: 492.648 Millions | |
| Recent Price: 7.39 Smart Investing & Trading Score: 75 | |
| Day Percent Change: -0.67% Day Change: -0.05 | |
| Week Change: 2.78% Year-to-date Change: 27.0% | |
| PACK Links: Profile News Message Board | |
| Charts:- Daily , Weekly | |
| Add PACK to Watchlist: View: Get Complete PACK Trend Analysis ➞ | |
 | IBEX IBEX Limited |
| Sector: Technology | |
| SubSector: Software Application | |
| MarketCap: 37787 Millions | |
| Recent Price: 13.33 Smart Investing & Trading Score: 35 | |
| Day Percent Change: -0.67% Day Change: -0.09 | |
| Week Change: 1.14% Year-to-date Change: -29.8% | |
| IBEX Links: Profile News Message Board | |
| Charts:- Daily , Weekly | |
| Add IBEX to Watchlist: View: Get Complete IBEX Trend Analysis ➞ | |
 | AGX Argan, Inc. |
| Sector: Industrials | |
| SubSector: Heavy Construction | |
| MarketCap: 664.095 Millions | |
| Recent Price: 61.21 Smart Investing & Trading Score: 76 | |
| Day Percent Change: -0.68% Day Change: -0.42 | |
| Week Change: -1.15% Year-to-date Change: 30.8% | |
| AGX Links: Profile News Message Board | |
| Charts:- Daily , Weekly | |
| Add AGX to Watchlist: View: Get Complete AGX Trend Analysis ➞ | |
 | AMBC Ambac Financial Group, Inc. |
| Sector: Financials | |
| SubSector: Surety & Title Insurance | |
| MarketCap: 587.818 Millions | |
| Recent Price: 14.54 Smart Investing & Trading Score: 25 | |
| Day Percent Change: -0.68% Day Change: -0.10 | |
| Week Change: 0.97% Year-to-date Change: -11.8% | |
| AMBC Links: Profile News Message Board | |
| Charts:- Daily , Weekly | |
| Add AMBC to Watchlist: View: Get Complete AMBC Trend Analysis ➞ | |
 | BATRK The Liberty Braves Group |
| Sector: Services & Goods | |
| SubSector: Broadcasting - TV | |
| MarketCap: 638.363 Millions | |
| Recent Price: 38.03 Smart Investing & Trading Score: 42 | |
| Day Percent Change: -0.68% Day Change: -0.26 | |
| Week Change: 2.01% Year-to-date Change: -3.9% | |
| BATRK Links: Profile News Message Board | |
| Charts:- Daily , Weekly | |
| Add BATRK to Watchlist: View: Get Complete BATRK Trend Analysis ➞ | |
 | SVV Savers Value Village, Inc. |
| Sector: Services & Goods | |
| SubSector: Specialty Retail | |
| MarketCap: 3800 Millions | |
| Recent Price: 17.59 Smart Investing & Trading Score: 42 | |
| Day Percent Change: -0.68% Day Change: -0.12 | |
| Week Change: 2.51% Year-to-date Change: -0.9% | |
| SVV Links: Profile News Message Board | |
| Charts:- Daily , Weekly | |
| Add SVV to Watchlist: View: Get Complete SVV Trend Analysis ➞ | |
 | OII Oceaneering International, Inc. |
| Sector: Energy | |
| SubSector: Oil & Gas Equipment & Services | |
| MarketCap: 324.061 Millions | |
| Recent Price: 23.05 Smart Investing & Trading Score: 68 | |
| Day Percent Change: -0.69% Day Change: -0.16 | |
| Week Change: 1.99% Year-to-date Change: 8.3% | |
| OII Links: Profile News Message Board | |
| Charts:- Daily , Weekly | |
| Add OII to Watchlist: View: Get Complete OII Trend Analysis ➞ | |
 | WAFD Washington Federal, Inc. |
| Sector: Financials | |
| SubSector: Savings & Loans | |
| MarketCap: 2219.2 Millions | |
| Recent Price: 28.39 Smart Investing & Trading Score: 74 | |
| Day Percent Change: -0.70% Day Change: -0.20 | |
| Week Change: 1.76% Year-to-date Change: -13.9% | |
| WAFD Links: Profile News Message Board | |
| Charts:- Daily , Weekly | |
| Add WAFD to Watchlist: View: Get Complete WAFD Trend Analysis ➞ | |
 | IBCP Independent Bank Corporation |
| Sector: Financials | |
| SubSector: Regional - Midwest Banks | |
| MarketCap: 273.67 Millions | |
| Recent Price: 25.12 Smart Investing & Trading Score: 69 | |
| Day Percent Change: -0.71% Day Change: -0.18 | |
| Week Change: 3.12% Year-to-date Change: -3.5% | |
| IBCP Links: Profile News Message Board | |
| Charts:- Daily , Weekly | |
| Add IBCP to Watchlist: View: Get Complete IBCP Trend Analysis ➞ | |
 | SXI Standex International Corporation |
| Sector: Industrials | |
| SubSector: Industrial Equipment & Components | |
| MarketCap: 644.109 Millions | |
| Recent Price: 171.37 Smart Investing & Trading Score: 66 | |
| Day Percent Change: -0.71% Day Change: -1.23 | |
| Week Change: 2.29% Year-to-date Change: 8.2% | |
| SXI Links: Profile News Message Board | |
| Charts:- Daily , Weekly | |
| Add SXI to Watchlist: View: Get Complete SXI Trend Analysis ➞ | |
 | AMK AssetMark Financial Holdings, Inc. |
| Sector: Financials | |
| SubSector: Asset Management | |
| MarketCap: 1296.33 Millions | |
| Recent Price: 34.90 Smart Investing & Trading Score: 61 | |
| Day Percent Change: -0.71% Day Change: -0.25 | |
| Week Change: 0.46% Year-to-date Change: 16.5% | |
| AMK Links: Profile News Message Board | |
| Charts:- Daily , Weekly | |
| Add AMK to Watchlist: View: Get Complete AMK Trend Analysis ➞ | |
 | CEIX CONSOL Energy Inc. |
| Sector: Materials | |
| SubSector: Industrial Metals & Minerals | |
| MarketCap: 196.81 Millions | |
| Recent Price: 83.43 Smart Investing & Trading Score: 32 | |
| Day Percent Change: -0.71% Day Change: -0.60 | |
| Week Change: -0.77% Year-to-date Change: -17.0% | |
| CEIX Links: Profile News Message Board | |
| Charts:- Daily , Weekly | |
| Add CEIX to Watchlist: View: Get Complete CEIX Trend Analysis ➞ | |
 | BBUC Brookfield Business Corporation |
| Sector: Financials | |
| SubSector: Asset Management | |
| MarketCap: 1810 Millions | |
| Recent Price: 21.00 Smart Investing & Trading Score: 10 | |
| Day Percent Change: -0.71% Day Change: -0.15 | |
| Week Change: -1.08% Year-to-date Change: -9.4% | |
| BBUC Links: Profile News Message Board | |
| Charts:- Daily , Weekly | |
| Add BBUC to Watchlist: View: Get Complete BBUC Trend Analysis ➞ | |
 | DFH Dream Finders Homes, Inc. |
| Sector: Services & Goods | |
| SubSector: Residential Construction | |
| MarketCap: 2270 Millions | |
| Recent Price: 36.20 Smart Investing & Trading Score: 58 | |
| Day Percent Change: -0.71% Day Change: -0.26 | |
| Week Change: 7.13% Year-to-date Change: 0.6% | |
| DFH Links: Profile News Message Board | |
| Charts:- Daily , Weekly | |
| Add DFH to Watchlist: View: Get Complete DFH Trend Analysis ➞ | |
 | SPTN SpartanNash Company |
| Sector: Consumer Staples | |
| SubSector: Food Wholesale | |
| MarketCap: 671.229 Millions | |
| Recent Price: 19.38 Smart Investing & Trading Score: 47 | |
| Day Percent Change: -0.72% Day Change: -0.14 | |
| Week Change: -1.47% Year-to-date Change: -15.6% | |
| SPTN Links: Profile News Message Board | |
| Charts:- Daily , Weekly | |
| Add SPTN to Watchlist: View: Get Complete SPTN Trend Analysis ➞ | |
 | OB Outbrain Inc. |
| Sector: Services & Goods | |
| SubSector: Internet Content & Information | |
| MarketCap: 250 Millions | |
| Recent Price: 4.11 Smart Investing & Trading Score: 75 | |
| Day Percent Change: -0.72% Day Change: -0.03 | |
| Week Change: 0.49% Year-to-date Change: -6.2% | |
| OB Links: Profile News Message Board | |
| Charts:- Daily , Weekly | |
| Add OB to Watchlist: View: Get Complete OB Trend Analysis ➞ | |
 | TWO Two Harbors Investment Corp. |
| Sector: Financials | |
| SubSector: Mortgage Investment | |
| MarketCap: 1979.59 Millions | |
| Recent Price: 12.47 Smart Investing & Trading Score: 64 | |
| Day Percent Change: -0.72% Day Change: -0.09 | |
| Week Change: 2.8% Year-to-date Change: -10.5% | |
| TWO Links: Profile News Message Board | |
| Charts:- Daily , Weekly | |
| Add TWO to Watchlist: View: Get Complete TWO Trend Analysis ➞ | |
 | YEXT Yext, Inc. |
| Sector: Technology | |
| SubSector: Internet Software & Services | |
| MarketCap: 1414.91 Millions | |
| Recent Price: 5.50 Smart Investing & Trading Score: 0 | |
| Day Percent Change: -0.72% Day Change: -0.04 | |
| Week Change: 0.73% Year-to-date Change: -6.6% | |
| YEXT Links: Profile News Message Board | |
| Charts:- Daily , Weekly | |
| Add YEXT to Watchlist: View: Get Complete YEXT Trend Analysis ➞ | |
 | NRDS NerdWallet, Inc. |
| Sector: Financials | |
| SubSector: Credit Services | |
| MarketCap: 759 Millions | |
| Recent Price: 13.73 Smart Investing & Trading Score: 35 | |
| Day Percent Change: -0.72% Day Change: -0.10 | |
| Week Change: 3.16% Year-to-date Change: -8.1% | |
| NRDS Links: Profile News Message Board | |
| Charts:- Daily , Weekly | |
| Add NRDS to Watchlist: View: Get Complete NRDS Trend Analysis ➞ | |
 | IRBT iRobot Corporation |
| Sector: Consumer Staples | |
| SubSector: Appliances | |
| MarketCap: 1193.38 Millions | |
| Recent Price: 6.84 Smart Investing & Trading Score: 20 | |
| Day Percent Change: -0.73% Day Change: -0.05 | |
| Week Change: -5.52% Year-to-date Change: -82.3% | |
| IRBT Links: Profile News Message Board | |
| Charts:- Daily , Weekly | |
| Add IRBT to Watchlist: View: Get Complete IRBT Trend Analysis ➞ | |
 | RYTM Rhythm Pharmaceuticals, Inc. |
| Sector: Health Care | |
| SubSector: Biotechnology | |
| MarketCap: 643.685 Millions | |
| Recent Price: 39.71 Smart Investing & Trading Score: 27 | |
| Day Percent Change: -0.73% Day Change: -0.29 | |
| Week Change: 4.57% Year-to-date Change: -13.6% | |
| RYTM Links: Profile News Message Board | |
| Charts:- Daily , Weekly | |
| Add RYTM to Watchlist: View: Get Complete RYTM Trend Analysis ➞ | |
| Too many stocks? View smallcap stocks filtered by marketcap & sector |
| Marketcap: All SmallCap Stocks (default-no microcap), Large, Mid-Range, Small & MicroCap |
| Sector: Tech, Finance, Energy, Staples, Retail, Industrial, Materials, Utilities & Medical |
|
Best Stocks Today 12Stocks.com |
© 2024 12Stocks.com Terms & Conditions Privacy Contact Us
All Information Provided Only For Education And Not To Be Used For Investing or Trading. See Terms & Conditions


One More Thing ... Get Best Stocks Delivered Daily!
Never Ever Miss A Move With Our Top Ten Stocks Lists
Find Best Stocks In Any Market - Bull or Bear Market
Take A Peek At Our Top Ten Stocks Lists: Daily, Weekly, Year-to-Date & Top Trends
Find Best Stocks In Any Market - Bull or Bear Market
Take A Peek At Our Top Ten Stocks Lists: Daily, Weekly, Year-to-Date & Top Trends
Smallcap Stocks With Best Up Trends [0-bearish to 100-bullish]: B. Riley[100], Ribbon [100], Group 1[100], Trustmark [100], MBIA [100], Integer [100], EchoStar [100], Comstock Resources[100], Vishay Inter[100], First Ban[100], Jamf Holding[100]
Best Smallcap Stocks Year-to-Date:
CareMax [574.23%], Janux [352.07%], Viking [249.65%], Alpine Immune[239.13%], Longboard [223.4%], Avidity Biosciences[177.71%], Arcutis Bio[170.9%], Super Micro[165.5%], Vera [149.61%], Hippo [130.79%], Y-mAbs [124.19%] Best Smallcap Stocks This Week:
Matterport [166.09%], B. Riley[48.82%], Seres [30.29%], Riot Blockchain[30.12%], CareMax [27.24%], Ribbon [25.97%], ProKidney [23.28%], SoundHound AI[22.54%], Cipher Mining[22.14%], Hibbett Sports[21.61%], Cullinan Oncology[20.69%] Best Smallcap Stocks Daily:
B. Riley[36.97%], Ribbon [26.46%], Babcock & Wilcox Enterprises[15.57%], Cullinan Oncology[13.55%], Amneal [12.04%], Comtech Tele[10.76%], Innodata [10.28%], Gritstone Oncology[10.06%], Navitas Semiconductor[8.83%], Eyenovia [8.68%], K12 [8.64%]