
 Login Sign Up


| |||||
 |  | ||||

| 12Stocks.com Market Intelligence |
Best SmallCap Stocks
|
| In a hurry? Small Cap Stock Lists: Performance Trends Table, Stock Charts
Sort Small Cap stocks: Daily, Weekly, Year-to-Date, Market Cap & Trends. Filter Small Cap stocks list by sector: Show all, Tech, Finance, Energy, Staples, Retail, Industrial, Materials, Utilities and HealthCare Filter Small Cap stocks list by size: All Large Medium Small and MicroCap |
| 12Stocks.com Small Cap Stocks Performances & Trends Daily | |||||||||
|
|  The overall Smart Investing & Trading Score is 63 (0-bearish to 100-bullish) which puts Small Cap index in short term neutral to bullish trend. The Smart Investing & Trading Score from previous trading session is 58 and hence an improvement of trend.
| ||||||||
Here are the Smart Investing & Trading Scores of the most requested small cap stocks at 12Stocks.com (click stock name for detailed review):
|


| 12Stocks.com: Investing in Smallcap Index with Stocks | |
|
The following table helps investors and traders sort through current performance and trends (as measured by Smart Investing & Trading Score) of various
stocks in the Smallcap Index. Quick View: Move mouse or cursor over stock symbol (ticker) to view short-term technical chart and over stock name to view long term chart. Click on  to add stock symbol to your watchlist and to add stock symbol to your watchlist and  to view watchlist. Click on any ticker or stock name for detailed market intelligence report for that stock. to view watchlist. Click on any ticker or stock name for detailed market intelligence report for that stock. |
12Stocks.com Performance of Stocks in Smallcap Index
| Ticker | Stock Name | Watchlist | Category | Recent Price | Smart Investing & Trading Score | Change % | YTD Change% |
| SPSC | SPS Commerce |   | Technology | 170.60 | 49 | 1.16 | -11.99% |
| VSTO | Vista Outdoor | | Consumer Staples | 34.86 | 100 | 1.16 | 17.89% |
| ENR | Energizer | | Consumer Staples | 28.92 | 74 | 1.15 | -8.71% |
| STNG | Scorpio Tankers | | Transports | 70.64 | 50 | 1.15 | 16.18% |
| SITM | SiTime | | Technology | 74.56 | 45 | 1.15 | -38.93% |
| THRM | Gentherm | | Consumer Staples | 50.40 | 54 | 1.14 | -3.74% |
| SP | SP Plus | | Services & Goods | 50.78 | 10 | 1.14 | -0.92% |
| GRND | Grindr | | Technology | 9.79 | 53 | 1.14 | 9.26% |
| PWSC | PowerSchool | | Technology | 17.68 | 25 | 1.14 | -25.21% |
| CODI | Compass Diversified | | Industrials | 23.21 | 68 | 1.13 | 3.39% |
| GPMT | Granite Point | | Financials | 4.47 | 64 | 1.13 | -24.75% |
| B | Barnes Group | | Industrials | 36.26 | 76 | 1.12 | 11.12% |
| ENS | EnerSys | | Industrials | 91.10 | 50 | 1.11 | -9.77% |
| TTGT | TechTarget | | Technology | 27.27 | 27 | 1.11 | -21.77% |
| URGN | UroGen Pharma | | Health Care | 14.53 | 57 | 1.11 | -3.13% |
| MSTR | MicroStrategy | | Technology | 1338.64 | 63 | 1.10 | 111.94% |
| CLFD | Clearfield | | Technology | 29.43 | 68 | 1.10 | 1.20% |
| SMRT | SmartRent | | Technology | 2.31 | 27 | 1.09 | -27.43% |
| CHEF | Chefs | | Consumer Staples | 33.39 | 68 | 1.09 | 13.46% |
| ORRF | Orrstown Financial | | Financials | 26.31 | 69 | 1.08 | -10.81% |
| ITGR | Integer | | Health Care | 117.91 | 76 | 1.08 | 19.00% |
| ZYXI | Zynex | | Health Care | 11.26 | 10 | 1.08 | 3.40% |
| HMN | Horace Mann | | Financials | 36.82 | 74 | 1.07 | 12.60% |
| FORR | Forrester Research | | Services & Goods | 18.97 | 45 | 1.07 | -29.24% |
| OFIX | Orthofix Medical | | Health Care | 13.22 | 42 | 1.07 | -1.93% |


| Too many stocks? View smallcap stocks filtered by marketcap & sector |
| Marketcap: All SmallCap Stocks (default-no microcap), Large, Mid-Range, Small |
| Smallcap Sector: Tech, Finance, Energy, Staples, Retail, Industrial, Materials, & Medical |
|
Get the most comprehensive stock market coverage daily at 12Stocks.com ➞ Best Stocks Today ➞ Best Stocks Weekly ➞ Best Stocks Year-to-Date ➞ Best Stocks Trends ➞  Best Stocks Today 12Stocks.com Best Nasdaq Stocks ➞ Best S&P 500 Stocks ➞ Best Tech Stocks ➞ Best Biotech Stocks ➞ |
| Detailed Overview of SmallCap Stocks |
| SmallCap Technical Overview, Leaders & Laggards, Top SmallCap ETF Funds & Detailed SmallCap Stocks List, Charts, Trends & More |
| Smallcap: Technical Analysis, Trends & YTD Performance | |
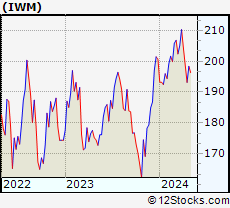
| SmallCap segment as represented by
IWM, an exchange-traded fund [ETF], holds basket of thousands of smallcap stocks from across all major sectors of the US stock market. The smallcap index (contains stocks like Riverbed & Sotheby's) is down by -1.07% and is currently underperforming the overall market by -6.71% year-to-date. Below is a quick view of technical charts and trends: | |
 IWM Weekly Chart |
|
| Long Term Trend: Good | |
| Medium Term Trend: Not Good | |
 IWM Daily Chart |
|
| Short Term Trend: Very Good | |
| Overall Trend Score: 63 | |
| YTD Performance: -1.07% | |
| **Trend Scores & Views Are Only For Educational Purposes And Not For Investing | |
| 12Stocks.com: Top Performing Small Cap Index Stocks | ||||||||||||||||||||||||||||||||||||||||||||||||
 The top performing Small Cap Index stocks year to date are
Now, more recently, over last week, the top performing Small Cap Index stocks on the move are


|
||||||||||||||||||||||||||||||||||||||||||||||||
| 12Stocks.com: Investing in Smallcap Index using Exchange Traded Funds | |
|
The following table shows list of key exchange traded funds (ETF) that
help investors track Smallcap index. The following list also includes leveraged ETF funds that track twice or thrice the daily returns of Smallcap indices. Short or inverse ETF funds move in the opposite direction to the index they track and are useful during market pullbacks or during bear markets. Quick View: Move mouse or cursor over ETF symbol (ticker) to view short-term technical chart and over ETF name to view long term chart. Click on ticker or stock name for detailed view. Click on to add stock symbol to your watchlist and to view watchlist. |
12Stocks.com List of ETFs that track Smallcap Index
| Ticker | ETF Name | Watchlist | Recent Price | Smart Investing & Trading Score | Change % | Week % | Year-to-date % |
| IWM | iShares Russell 2000 | | 198.57 | 63 | 1.67 | 2.81 | -1.07% |
| IJR | iShares Core S&P Small-Cap | | 105.96 | 75 | 2.41 | 2.65 | -2.12% |
| VTWO | Vanguard Russell 2000 ETF | | 80.29 | 70 | 1.74 | 2.83 | -1% |
| IWN | iShares Russell 2000 Value | | 151.74 | 75 | 1.49 | 2.68 | -2.31% |
| IJS | iShares S&P Small-Cap 600 Value | | 98.13 | 67 | 1.76 | 2.64 | -4.79% |
| IWO | iShares Russell 2000 Growth | | 252.37 | 58 | 1.79 | 2.89 | 0.06% |
| IJT | iShares S&P Small-Cap 600 Growth | | 125.72 | 70 | 1.91 | 2.87 | 0.46% |
| XSLV | PowerShares S&P SmallCap Low Volatil ETF | | 43.05 | 80 | 1.44 | 2.06 | -2.49% |
| SMLV | SPDR SSGA US Small Cap Low Volatil ETF | | 108.77 | 80 | 1.20 | 2.52 | -3.34% |
| SAA | ProShares Ultra SmallCap600 | | 23.15 | 80 | 3.49 | 6.19 | -7.21% |
| SBB | ProShares Short SmallCap600 | | 16.37 | 20 | -1.48 | -2.77 | 2.79% |
| SDD | ProShares UltraShort SmallCap600 | | 19.23 | 30 | -2.63 | -5.46 | 4.36% |
| 12Stocks.com: Charts, Trends, Fundamental Data and Performances of SmallCap Stocks | |
|
We now take in-depth look at all SmallCap stocks including charts, multi-period performances and overall trends (as measured by Smart Investing & Trading Score). One can sort SmallCap stocks (click link to choose) by Daily, Weekly and by Year-to-Date performances. Also, one can sort by size of the company or by market capitalization. |
| Select Your Default Chart Type: | |||||
| |||||
| Click on stock symbol or name for detailed view. Click on to add stock symbol to your watchlist and to view watchlist. Quick View: Move mouse or cursor over "Daily" to quickly view daily technical stock chart and over "Weekly" to view weekly technical stock chart. | |||||

 | SPSC SPS Commerce, Inc. |
| Sector: Technology | |
| SubSector: Application Software | |
| MarketCap: 1398.02 Millions | |
| Recent Price: 170.60 Smart Investing & Trading Score: 49 | |
| Day Percent Change: 1.16% Day Change: 1.96 | |
| Week Change: 3.09% Year-to-date Change: -12.0% | |
| SPSC Links: Profile News Message Board | |
| Charts:- Daily , Weekly | |
| Add SPSC to Watchlist: View: Get Complete SPSC Trend Analysis ➞ | |
 | VSTO Vista Outdoor Inc. |
| Sector: Consumer Staples | |
| SubSector: Sporting Goods | |
| MarketCap: 405.144 Millions | |
| Recent Price: 34.86 Smart Investing & Trading Score: 100 | |
| Day Percent Change: 1.16% Day Change: 0.40 | |
| Week Change: 7.73% Year-to-date Change: 17.9% | |
| VSTO Links: Profile News Message Board | |
| Charts:- Daily , Weekly | |
| Add VSTO to Watchlist: View: Get Complete VSTO Trend Analysis ➞ | |
 | ENR Energizer Holdings, Inc. |
| Sector: Consumer Staples | |
| SubSector: Personal Products | |
| MarketCap: 2469.55 Millions | |
| Recent Price: 28.92 Smart Investing & Trading Score: 74 | |
| Day Percent Change: 1.15% Day Change: 0.33 | |
| Week Change: 1.8% Year-to-date Change: -8.7% | |
| ENR Links: Profile News Message Board | |
| Charts:- Daily , Weekly | |
| Add ENR to Watchlist: View: Get Complete ENR Trend Analysis ➞ | |
 | STNG Scorpio Tankers Inc. |
| Sector: Transports | |
| SubSector: Shipping | |
| MarketCap: 813.214 Millions | |
| Recent Price: 70.64 Smart Investing & Trading Score: 50 | |
| Day Percent Change: 1.15% Day Change: 0.80 | |
| Week Change: 1.6% Year-to-date Change: 16.2% | |
| STNG Links: Profile News Message Board | |
| Charts:- Daily , Weekly | |
| Add STNG to Watchlist: View: Get Complete STNG Trend Analysis ➞ | |
 | SITM SiTime Corporation |
| Sector: Technology | |
| SubSector: Semiconductor - Specialized | |
| MarketCap: 403.76 Millions | |
| Recent Price: 74.56 Smart Investing & Trading Score: 45 | |
| Day Percent Change: 1.15% Day Change: 0.85 | |
| Week Change: 1.55% Year-to-date Change: -38.9% | |
| SITM Links: Profile News Message Board | |
| Charts:- Daily , Weekly | |
| Add SITM to Watchlist: View: Get Complete SITM Trend Analysis ➞ | |
 | THRM Gentherm Incorporated |
| Sector: Consumer Staples | |
| SubSector: Auto Parts | |
| MarketCap: 1032.59 Millions | |
| Recent Price: 50.40 Smart Investing & Trading Score: 54 | |
| Day Percent Change: 1.14% Day Change: 0.57 | |
| Week Change: 0.82% Year-to-date Change: -3.7% | |
| THRM Links: Profile News Message Board | |
| Charts:- Daily , Weekly | |
| Add THRM to Watchlist: View: Get Complete THRM Trend Analysis ➞ | |
 | SP SP Plus Corporation |
| Sector: Services & Goods | |
| SubSector: Management Services | |
| MarketCap: 494.545 Millions | |
| Recent Price: 50.78 Smart Investing & Trading Score: 10 | |
| Day Percent Change: 1.14% Day Change: 0.57 | |
| Week Change: 0.2% Year-to-date Change: -0.9% | |
| SP Links: Profile News Message Board | |
| Charts:- Daily , Weekly | |
| Add SP to Watchlist: View: Get Complete SP Trend Analysis ➞ | |
 | GRND Grindr Inc. |
| Sector: Technology | |
| SubSector: Software - Application | |
| MarketCap: 929 Millions | |
| Recent Price: 9.79 Smart Investing & Trading Score: 53 | |
| Day Percent Change: 1.14% Day Change: 0.11 | |
| Week Change: 0.1% Year-to-date Change: 9.3% | |
| GRND Links: Profile News Message Board | |
| Charts:- Daily , Weekly | |
| Add GRND to Watchlist: View: Get Complete GRND Trend Analysis ➞ | |
 | PWSC PowerSchool Holdings, Inc. |
| Sector: Technology | |
| SubSector: Software - Application | |
| MarketCap: 3870 Millions | |
| Recent Price: 17.68 Smart Investing & Trading Score: 25 | |
| Day Percent Change: 1.14% Day Change: 0.20 | |
| Week Change: 1.26% Year-to-date Change: -25.2% | |
| PWSC Links: Profile News Message Board | |
| Charts:- Daily , Weekly | |
| Add PWSC to Watchlist: View: Get Complete PWSC Trend Analysis ➞ | |
 | CODI Compass Diversified Holdings LLC |
| Sector: Industrials | |
| SubSector: Conglomerates | |
| MarketCap: 803.348 Millions | |
| Recent Price: 23.21 Smart Investing & Trading Score: 68 | |
| Day Percent Change: 1.13% Day Change: 0.26 | |
| Week Change: 1.75% Year-to-date Change: 3.4% | |
| CODI Links: Profile News Message Board | |
| Charts:- Daily , Weekly | |
| Add CODI to Watchlist: View: Get Complete CODI Trend Analysis ➞ | |
 | GPMT Granite Point Mortgage Trust Inc. |
| Sector: Financials | |
| SubSector: Mortgage Investment | |
| MarketCap: 289.739 Millions | |
| Recent Price: 4.47 Smart Investing & Trading Score: 64 | |
| Day Percent Change: 1.13% Day Change: 0.05 | |
| Week Change: 1.82% Year-to-date Change: -24.8% | |
| GPMT Links: Profile News Message Board | |
| Charts:- Daily , Weekly | |
| Add GPMT to Watchlist: View: Get Complete GPMT Trend Analysis ➞ | |
 | B Barnes Group Inc. |
| Sector: Industrials | |
| SubSector: Industrial Equipment & Components | |
| MarketCap: 2189.79 Millions | |
| Recent Price: 36.26 Smart Investing & Trading Score: 76 | |
| Day Percent Change: 1.12% Day Change: 0.40 | |
| Week Change: 1.4% Year-to-date Change: 11.1% | |
| B Links: Profile News Message Board | |
| Charts:- Daily , Weekly | |
| Add B to Watchlist: View: Get Complete B Trend Analysis ➞ | |
 | ENS EnerSys |
| Sector: Industrials | |
| SubSector: Industrial Electrical Equipment | |
| MarketCap: 2068.79 Millions | |
| Recent Price: 91.10 Smart Investing & Trading Score: 50 | |
| Day Percent Change: 1.11% Day Change: 1.00 | |
| Week Change: 0.66% Year-to-date Change: -9.8% | |
| ENS Links: Profile News Message Board | |
| Charts:- Daily , Weekly | |
| Add ENS to Watchlist: View: Get Complete ENS Trend Analysis ➞ | |
 | TTGT TechTarget, Inc. |
| Sector: Technology | |
| SubSector: Internet Information Providers | |
| MarketCap: 560.78 Millions | |
| Recent Price: 27.27 Smart Investing & Trading Score: 27 | |
| Day Percent Change: 1.11% Day Change: 0.30 | |
| Week Change: 0.37% Year-to-date Change: -21.8% | |
| TTGT Links: Profile News Message Board | |
| Charts:- Daily , Weekly | |
| Add TTGT to Watchlist: View: Get Complete TTGT Trend Analysis ➞ | |
 | URGN UroGen Pharma Ltd. |
| Sector: Health Care | |
| SubSector: Biotechnology | |
| MarketCap: 373.485 Millions | |
| Recent Price: 14.53 Smart Investing & Trading Score: 57 | |
| Day Percent Change: 1.11% Day Change: 0.16 | |
| Week Change: 5.44% Year-to-date Change: -3.1% | |
| URGN Links: Profile News Message Board | |
| Charts:- Daily , Weekly | |
| Add URGN to Watchlist: View: Get Complete URGN Trend Analysis ➞ | |
 | MSTR MicroStrategy Incorporated |
| Sector: Technology | |
| SubSector: Application Software | |
| MarketCap: 1164.52 Millions | |
| Recent Price: 1338.64 Smart Investing & Trading Score: 63 | |
| Day Percent Change: 1.10% Day Change: 14.63 | |
| Week Change: 14.01% Year-to-date Change: 111.9% | |
| MSTR Links: Profile News Message Board | |
| Charts:- Daily , Weekly | |
| Add MSTR to Watchlist: View: Get Complete MSTR Trend Analysis ➞ | |
 | CLFD Clearfield, Inc. |
| Sector: Technology | |
| SubSector: Communication Equipment | |
| MarketCap: 138.439 Millions | |
| Recent Price: 29.43 Smart Investing & Trading Score: 68 | |
| Day Percent Change: 1.10% Day Change: 0.32 | |
| Week Change: 4.07% Year-to-date Change: 1.2% | |
| CLFD Links: Profile News Message Board | |
| Charts:- Daily , Weekly | |
| Add CLFD to Watchlist: View: Get Complete CLFD Trend Analysis ➞ | |
 | SMRT SmartRent, Inc. |
| Sector: Technology | |
| SubSector: Software - Application | |
| MarketCap: 733 Millions | |
| Recent Price: 2.31 Smart Investing & Trading Score: 27 | |
| Day Percent Change: 1.09% Day Change: 0.02 | |
| Week Change: 1.09% Year-to-date Change: -27.4% | |
| SMRT Links: Profile News Message Board | |
| Charts:- Daily , Weekly | |
| Add SMRT to Watchlist: View: Get Complete SMRT Trend Analysis ➞ | |
 | CHEF The Chefs Warehouse, Inc. |
| Sector: Consumer Staples | |
| SubSector: Food Wholesale | |
| MarketCap: 207.529 Millions | |
| Recent Price: 33.39 Smart Investing & Trading Score: 68 | |
| Day Percent Change: 1.09% Day Change: 0.36 | |
| Week Change: 2.99% Year-to-date Change: 13.5% | |
| CHEF Links: Profile News Message Board | |
| Charts:- Daily , Weekly | |
| Add CHEF to Watchlist: View: Get Complete CHEF Trend Analysis ➞ | |
 | ORRF Orrstown Financial Services, Inc. |
| Sector: Financials | |
| SubSector: Regional - Northeast Banks | |
| MarketCap: 159.999 Millions | |
| Recent Price: 26.31 Smart Investing & Trading Score: 69 | |
| Day Percent Change: 1.08% Day Change: 0.28 | |
| Week Change: 1.35% Year-to-date Change: -10.8% | |
| ORRF Links: Profile News Message Board | |
| Charts:- Daily , Weekly | |
| Add ORRF to Watchlist: View: Get Complete ORRF Trend Analysis ➞ | |
 | ITGR Integer Holdings Corporation |
| Sector: Health Care | |
| SubSector: Medical Appliances & Equipment | |
| MarketCap: 1794.8 Millions | |
| Recent Price: 117.91 Smart Investing & Trading Score: 76 | |
| Day Percent Change: 1.08% Day Change: 1.26 | |
| Week Change: 1.11% Year-to-date Change: 19.0% | |
| ITGR Links: Profile News Message Board | |
| Charts:- Daily , Weekly | |
| Add ITGR to Watchlist: View: Get Complete ITGR Trend Analysis ➞ | |
 | ZYXI Zynex, Inc. |
| Sector: Health Care | |
| SubSector: Medical Appliances & Equipment | |
| MarketCap: 388.58 Millions | |
| Recent Price: 11.26 Smart Investing & Trading Score: 10 | |
| Day Percent Change: 1.08% Day Change: 0.12 | |
| Week Change: -0.92% Year-to-date Change: 3.4% | |
| ZYXI Links: Profile News Message Board | |
| Charts:- Daily , Weekly | |
| Add ZYXI to Watchlist: View: Get Complete ZYXI Trend Analysis ➞ | |
 | HMN Horace Mann Educators Corporation |
| Sector: Financials | |
| SubSector: Property & Casualty Insurance | |
| MarketCap: 1545.52 Millions | |
| Recent Price: 36.82 Smart Investing & Trading Score: 74 | |
| Day Percent Change: 1.07% Day Change: 0.39 | |
| Week Change: 1.27% Year-to-date Change: 12.6% | |
| HMN Links: Profile News Message Board | |
| Charts:- Daily , Weekly | |
| Add HMN to Watchlist: View: Get Complete HMN Trend Analysis ➞ | |
 | FORR Forrester Research, Inc. |
| Sector: Services & Goods | |
| SubSector: Research Services | |
| MarketCap: 473.394 Millions | |
| Recent Price: 18.97 Smart Investing & Trading Score: 45 | |
| Day Percent Change: 1.07% Day Change: 0.20 | |
| Week Change: 1.17% Year-to-date Change: -29.2% | |
| FORR Links: Profile News Message Board | |
| Charts:- Daily , Weekly | |
| Add FORR to Watchlist: View: Get Complete FORR Trend Analysis ➞ | |
 | OFIX Orthofix Medical Inc. |
| Sector: Health Care | |
| SubSector: Medical Appliances & Equipment | |
| MarketCap: 508.18 Millions | |
| Recent Price: 13.22 Smart Investing & Trading Score: 42 | |
| Day Percent Change: 1.07% Day Change: 0.14 | |
| Week Change: 0.92% Year-to-date Change: -1.9% | |
| OFIX Links: Profile News Message Board | |
| Charts:- Daily , Weekly | |
| Add OFIX to Watchlist: View: Get Complete OFIX Trend Analysis ➞ | |
| Too many stocks? View smallcap stocks filtered by marketcap & sector |
| Marketcap: All SmallCap Stocks (default-no microcap), Large, Mid-Range, Small & MicroCap |
| Sector: Tech, Finance, Energy, Staples, Retail, Industrial, Materials, Utilities & Medical |
|
Best Stocks Today 12Stocks.com |
© 2024 12Stocks.com Terms & Conditions Privacy Contact Us
All Information Provided Only For Education And Not To Be Used For Investing or Trading. See Terms & Conditions


One More Thing ... Get Best Stocks Delivered Daily!
Never Ever Miss A Move With Our Top Ten Stocks Lists
Find Best Stocks In Any Market - Bull or Bear Market
Take A Peek At Our Top Ten Stocks Lists: Daily, Weekly, Year-to-Date & Top Trends
Find Best Stocks In Any Market - Bull or Bear Market
Take A Peek At Our Top Ten Stocks Lists: Daily, Weekly, Year-to-Date & Top Trends
Smallcap Stocks With Best Up Trends [0-bearish to 100-bullish]: Hibbett Sports[100], Braemar Hotels[100], Akoustis [100], FTAI Infrastructure[100], Vertex Energy[100], AZZ [100], Day One[100], Oscar Health[100], Mueller Industries[100], ScanSource [100], Gannett Co[100]
Best Smallcap Stocks Year-to-Date:
Janux [364.03%], Viking [248.9%], Alpine Immune[239.02%], Longboard [231.75%], Avidity Biosciences[178.1%], Arcutis Bio[170.59%], Super Micro[168.02%], Vera [154.91%], Hippo [134.14%], Y-mAbs [124.93%], Stoke [113.88%] Best Smallcap Stocks This Week:
Matterport [164.37%], Seres [35.74%], Riot Blockchain[29.79%], Cipher Mining[25%], ProKidney [24.75%], Braemar Hotels[21.3%], Akoustis [21.29%], Hibbett Sports[21.1%], Assertio [19.28%], BigBear.ai [17.93%], Marathon Patent[17.82%] Best Smallcap Stocks Daily:
Virgin Galactic[22.38%], Seres [21.68%], Marathon Patent[20.04%], Hibbett Sports[18.84%], Generation Bio[16.01%], IGM Biosciences[14.07%], Braemar Hotels[12.96%], SES AI[12.17%], NuScale Power[11.16%], FuelCell Energy[10.86%], Cutera [10.82%]