
 Login Sign Up


| |||||
 |  | ||||

| 12Stocks.com Market Intelligence |
Best SmallCap Stocks
|
| In a hurry? Small Cap Stock Lists: Performance Trends Table, Stock Charts
Sort Small Cap stocks: Daily, Weekly, Year-to-Date, Market Cap & Trends. Filter Small Cap stocks list by sector: Show all, Tech, Finance, Energy, Staples, Retail, Industrial, Materials, Utilities and HealthCare Filter Small Cap stocks list by size: All Large Medium Small and MicroCap |
| 12Stocks.com Small Cap Stocks Performances & Trends Daily | |||||||||
|
|  The overall Smart Investing & Trading Score is 26 (0-bearish to 100-bullish) which puts Small Cap index in short term bearish to neutral trend. The Smart Investing & Trading Score from previous trading session is 31 and a deterioration of trend continues.
| ||||||||
Here are the Smart Investing & Trading Scores of the most requested small cap stocks at 12Stocks.com (click stock name for detailed review):
|


| 12Stocks.com: Investing in Smallcap Index with Stocks | |
|
The following table helps investors and traders sort through current performance and trends (as measured by Smart Investing & Trading Score) of various
stocks in the Smallcap Index. Quick View: Move mouse or cursor over stock symbol (ticker) to view short-term technical chart and over stock name to view long term chart. Click on  to add stock symbol to your watchlist and to add stock symbol to your watchlist and  to view watchlist. Click on any ticker or stock name for detailed market intelligence report for that stock. to view watchlist. Click on any ticker or stock name for detailed market intelligence report for that stock. |
12Stocks.com Performance of Stocks in Smallcap Index
| Ticker | Stock Name | Watchlist | Category | Recent Price | Smart Investing & Trading Score | Change % | YTD Change% |
| TCBK | TriCo Bancshares |   | Financials | 32.06 | 20 | -1.48 | -25.39% |
| KRO | Kronos Worldwide | | Materials | 11.31 | 36 | -1.48 | 13.78% |
| UE | Urban Edge | | Financials | 15.97 | 0 | -1.48 | -12.73% |
| RDFN | Redfin | | Technology | 5.66 | 0 | -1.48 | -45.20% |
| FIGS | FIGS | | Services & Goods | 4.66 | 15 | -1.48 | -34.64% |
| UCBI | United Community | | Financials | 24.53 | 20 | -1.49 | -16.17% |
| HZO | MarineMax | | Services & Goods | 27.02 | 10 | -1.49 | -30.54% |
| NPO | EnPro Industries | | Industrials | 155.05 | 26 | -1.49 | -1.08% |
| SNFCA | Security National | | Financials | 6.60 | 10 | -1.49 | -26.67% |
| VREX | Varex Imaging | | Health Care | 17.14 | 20 | -1.49 | -16.39% |
| RBCAA | Republic Bancorp | | Financials | 47.09 | 0 | -1.50 | -14.64% |
| ALVR | AlloVir | | Health Care | 0.73 | 15 | -1.50 | 8.12% |
| EVLV | Evolv | | Industrials | 3.93 | 46 | -1.50 | -16.74% |
| HONE | HarborOne Bancorp | | Financials | 9.19 | 18 | -1.50 | -23.29% |
| CVRX | CVRx | | Health Care | 16.38 | 20 | -1.50 | -47.93% |
| RELY | Remitly Global | | Technology | 18.25 | 71 | -1.51 | -6.02% |
| FA | First Advantage | | Industrials | 14.92 | 0 | -1.52 | -10.55% |
| EBS | Emergent BioSolutions | | Health Care | 1.95 | 46 | -1.52 | -18.75% |
| HMST | HomeStreet | | Financials | 12.31 | 20 | -1.52 | 19.51% |
| TDW | Tidewater | | Energy | 92.20 | 44 | -1.53 | 27.86% |
| FGEN | FibroGen | | Health Care | 1.29 | 27 | -1.53 | 45.55% |
| SNDX | Syndax | | Health Care | 21.29 | 46 | -1.53 | -1.48% |
| TRTX | TPG RE | | Financials | 7.09 | 36 | -1.53 | 9.08% |
| BKH | Black Hills | | Utilities | 51.20 | 10 | -1.54 | -5.10% |
| TRMK | Trustmark | | Financials | 25.64 | 10 | -1.54 | -8.03% |


| Too many stocks? View smallcap stocks filtered by marketcap & sector |
| Marketcap: All SmallCap Stocks (default-no microcap), Large, Mid-Range, Small |
| Smallcap Sector: Tech, Finance, Energy, Staples, Retail, Industrial, Materials, & Medical |
|
Get the most comprehensive stock market coverage daily at 12Stocks.com ➞ Best Stocks Today ➞ Best Stocks Weekly ➞ Best Stocks Year-to-Date ➞ Best Stocks Trends ➞  Best Stocks Today 12Stocks.com Best Nasdaq Stocks ➞ Best S&P 500 Stocks ➞ Best Tech Stocks ➞ Best Biotech Stocks ➞ |
| Detailed Overview of SmallCap Stocks |
| SmallCap Technical Overview, Leaders & Laggards, Top SmallCap ETF Funds & Detailed SmallCap Stocks List, Charts, Trends & More |
| Smallcap: Technical Analysis, Trends & YTD Performance | |
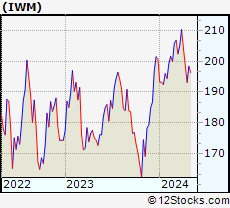
| SmallCap segment as represented by
IWM, an exchange-traded fund [ETF], holds basket of thousands of smallcap stocks from across all major sectors of the US stock market. The smallcap index (contains stocks like Riverbed & Sotheby's) is down by -2.82% and is currently underperforming the overall market by -7.84% year-to-date. Below is a quick view of technical charts and trends: | |
 IWM Weekly Chart |
|
| Long Term Trend: Good | |
| Medium Term Trend: Not Good | |
 IWM Daily Chart |
|
| Short Term Trend: Not Good | |
| Overall Trend Score: 26 | |
| YTD Performance: -2.82% | |
| **Trend Scores & Views Are Only For Educational Purposes And Not For Investing | |
| 12Stocks.com: Top Performing Small Cap Index Stocks | ||||||||||||||||||||||||||||||||||||||||||||||||
 The top performing Small Cap Index stocks year to date are
Now, more recently, over last week, the top performing Small Cap Index stocks on the move are


|
||||||||||||||||||||||||||||||||||||||||||||||||
| 12Stocks.com: Investing in Smallcap Index using Exchange Traded Funds | |
|
The following table shows list of key exchange traded funds (ETF) that
help investors track Smallcap index. The following list also includes leveraged ETF funds that track twice or thrice the daily returns of Smallcap indices. Short or inverse ETF funds move in the opposite direction to the index they track and are useful during market pullbacks or during bear markets. Quick View: Move mouse or cursor over ETF symbol (ticker) to view short-term technical chart and over ETF name to view long term chart. Click on ticker or stock name for detailed view. Click on to add stock symbol to your watchlist and to view watchlist. |
12Stocks.com List of ETFs that track Smallcap Index
| Ticker | ETF Name | Watchlist | Recent Price | Smart Investing & Trading Score | Change % | Week % | Year-to-date % |
| IWM | iShares Russell 2000 | | 195.06 | 26 | -0.37 | -1.83 | -2.82% |
| IJR | iShares Core S&P Small-Cap | | 102.72 | 0 | -0.79 | -1.71 | -5.1% |
| VTWO | Vanguard Russell 2000 ETF | | 78.70 | 26 | -0.67 | -2.02 | -2.96% |
| IWN | iShares Russell 2000 Value | | 147.16 | 13 | -0.97 | -2.14 | -5.26% |
| IWO | iShares Russell 2000 Growth | | 250.26 | 26 | -0.31 | -2 | -0.78% |
| IJS | iShares S&P Small-Cap 600 Value | | 94.41 | 0 | -0.83 | -1.83 | -8.4% |
| IJT | iShares S&P Small-Cap 600 Growth | | 122.23 | 13 | -1.04 | -2.04 | -2.33% |
| SBB | ProShares Short SmallCap600 | | 16.84 | 100 | 2.62 | 1.77 | 5.71% |
| SDD | ProShares UltraShort SmallCap600 | | 20.23 | 100 | 0.00 | 2.01 | 9.79% |
| SAA | ProShares Ultra SmallCap600 | | 21.81 | 0 | -2.76 | -3.33 | -12.59% |
| SMLV | SPDR SSGA US Small Cap Low Volatil ETF | | 103.84 | 0 | -0.85 | -1.12 | -7.71% |
| XSLV | PowerShares S&P SmallCap Low Volatil ETF | | 41.62 | 0 | -0.63 | -1.13 | -5.74% |
| 12Stocks.com: Charts, Trends, Fundamental Data and Performances of SmallCap Stocks | |
|
We now take in-depth look at all SmallCap stocks including charts, multi-period performances and overall trends (as measured by Smart Investing & Trading Score). One can sort SmallCap stocks (click link to choose) by Daily, Weekly and by Year-to-Date performances. Also, one can sort by size of the company or by market capitalization. |
| Select Your Default Chart Type: | |||||
| |||||
| Click on stock symbol or name for detailed view. Click on to add stock symbol to your watchlist and to view watchlist. Quick View: Move mouse or cursor over "Daily" to quickly view daily technical stock chart and over "Weekly" to view weekly technical stock chart. | |||||

 | TCBK TriCo Bancshares |
| Sector: Financials | |
| SubSector: Regional - Pacific Banks | |
| MarketCap: 875.129 Millions | |
| Recent Price: 32.06 Smart Investing & Trading Score: 20 | |
| Day Percent Change: -1.48% Day Change: -0.48 | |
| Week Change: -1.72% Year-to-date Change: -25.4% | |
| TCBK Links: Profile News Message Board | |
| Charts:- Daily , Weekly | |
| Add TCBK to Watchlist: View: Get Complete TCBK Trend Analysis ➞ | |
 | KRO Kronos Worldwide, Inc. |
| Sector: Materials | |
| SubSector: Specialty Chemicals | |
| MarketCap: 1046.57 Millions | |
| Recent Price: 11.31 Smart Investing & Trading Score: 36 | |
| Day Percent Change: -1.48% Day Change: -0.17 | |
| Week Change: -0.7% Year-to-date Change: 13.8% | |
| KRO Links: Profile News Message Board | |
| Charts:- Daily , Weekly | |
| Add KRO to Watchlist: View: Get Complete KRO Trend Analysis ➞ | |
 | UE Urban Edge Properties |
| Sector: Financials | |
| SubSector: REIT - Diversified | |
| MarketCap: 1112.33 Millions | |
| Recent Price: 15.97 Smart Investing & Trading Score: 0 | |
| Day Percent Change: -1.48% Day Change: -0.24 | |
| Week Change: -1.9% Year-to-date Change: -12.7% | |
| UE Links: Profile News Message Board | |
| Charts:- Daily , Weekly | |
| Add UE to Watchlist: View: Get Complete UE Trend Analysis ➞ | |
 | RDFN Redfin Corporation |
| Sector: Technology | |
| SubSector: Internet Information Providers | |
| MarketCap: 1356.2 Millions | |
| Recent Price: 5.66 Smart Investing & Trading Score: 0 | |
| Day Percent Change: -1.48% Day Change: -0.08 | |
| Week Change: -5.59% Year-to-date Change: -45.2% | |
| RDFN Links: Profile News Message Board | |
| Charts:- Daily , Weekly | |
| Add RDFN to Watchlist: View: Get Complete RDFN Trend Analysis ➞ | |
 | FIGS FIGS, Inc. |
| Sector: Services & Goods | |
| SubSector: Apparel Manufacturing | |
| MarketCap: 1370 Millions | |
| Recent Price: 4.66 Smart Investing & Trading Score: 15 | |
| Day Percent Change: -1.48% Day Change: -0.07 | |
| Week Change: -5.67% Year-to-date Change: -34.6% | |
| FIGS Links: Profile News Message Board | |
| Charts:- Daily , Weekly | |
| Add FIGS to Watchlist: View: Get Complete FIGS Trend Analysis ➞ | |
 | UCBI United Community Banks, Inc. |
| Sector: Financials | |
| SubSector: Regional - Mid-Atlantic Banks | |
| MarketCap: 1593.99 Millions | |
| Recent Price: 24.53 Smart Investing & Trading Score: 20 | |
| Day Percent Change: -1.49% Day Change: -0.37 | |
| Week Change: -1.01% Year-to-date Change: -16.2% | |
| UCBI Links: Profile News Message Board | |
| Charts:- Daily , Weekly | |
| Add UCBI to Watchlist: View: Get Complete UCBI Trend Analysis ➞ | |
 | HZO MarineMax, Inc. |
| Sector: Services & Goods | |
| SubSector: Specialty Retail, Other | |
| MarketCap: 234.744 Millions | |
| Recent Price: 27.02 Smart Investing & Trading Score: 10 | |
| Day Percent Change: -1.49% Day Change: -0.41 | |
| Week Change: -1.57% Year-to-date Change: -30.5% | |
| HZO Links: Profile News Message Board | |
| Charts:- Daily , Weekly | |
| Add HZO to Watchlist: View: Get Complete HZO Trend Analysis ➞ | |
 | NPO EnPro Industries, Inc. |
| Sector: Industrials | |
| SubSector: Industrial Equipment & Components | |
| MarketCap: 734.309 Millions | |
| Recent Price: 155.05 Smart Investing & Trading Score: 26 | |
| Day Percent Change: -1.49% Day Change: -2.35 | |
| Week Change: -1.51% Year-to-date Change: -1.1% | |
| NPO Links: Profile News Message Board | |
| Charts:- Daily , Weekly | |
| Add NPO to Watchlist: View: Get Complete NPO Trend Analysis ➞ | |
 | SNFCA Security National Financial Corporation |
| Sector: Financials | |
| SubSector: Credit Services | |
| MarketCap: 81.0208 Millions | |
| Recent Price: 6.60 Smart Investing & Trading Score: 10 | |
| Day Percent Change: -1.49% Day Change: -0.10 | |
| Week Change: -5.17% Year-to-date Change: -26.7% | |
| SNFCA Links: Profile News Message Board | |
| Charts:- Daily , Weekly | |
| Add SNFCA to Watchlist: View: Get Complete SNFCA Trend Analysis ➞ | |
 | VREX Varex Imaging Corporation |
| Sector: Health Care | |
| SubSector: Medical Appliances & Equipment | |
| MarketCap: 718.78 Millions | |
| Recent Price: 17.14 Smart Investing & Trading Score: 20 | |
| Day Percent Change: -1.49% Day Change: -0.26 | |
| Week Change: -0.64% Year-to-date Change: -16.4% | |
| VREX Links: Profile News Message Board | |
| Charts:- Daily , Weekly | |
| Add VREX to Watchlist: View: Get Complete VREX Trend Analysis ➞ | |
 | RBCAA Republic Bancorp, Inc. |
| Sector: Financials | |
| SubSector: Regional - Southeast Banks | |
| MarketCap: 671.835 Millions | |
| Recent Price: 47.09 Smart Investing & Trading Score: 0 | |
| Day Percent Change: -1.50% Day Change: -0.71 | |
| Week Change: -2.01% Year-to-date Change: -14.6% | |
| RBCAA Links: Profile News Message Board | |
| Charts:- Daily , Weekly | |
| Add RBCAA to Watchlist: View: Get Complete RBCAA Trend Analysis ➞ | |
 | ALVR AlloVir, Inc. |
| Sector: Health Care | |
| SubSector: Biotechnology | |
| MarketCap: 25787 Millions | |
| Recent Price: 0.73 Smart Investing & Trading Score: 15 | |
| Day Percent Change: -1.50% Day Change: -0.01 | |
| Week Change: -4.17% Year-to-date Change: 8.1% | |
| ALVR Links: Profile News Message Board | |
| Charts:- Daily , Weekly | |
| Add ALVR to Watchlist: View: Get Complete ALVR Trend Analysis ➞ | |
 | EVLV Evolv Technologies Holdings, Inc. |
| Sector: Industrials | |
| SubSector: Security & Protection Services | |
| MarketCap: 853 Millions | |
| Recent Price: 3.93 Smart Investing & Trading Score: 46 | |
| Day Percent Change: -1.50% Day Change: -0.06 | |
| Week Change: -2.96% Year-to-date Change: -16.7% | |
| EVLV Links: Profile News Message Board | |
| Charts:- Daily , Weekly | |
| Add EVLV to Watchlist: View: Get Complete EVLV Trend Analysis ➞ | |
 | HONE HarborOne Bancorp, Inc. |
| Sector: Financials | |
| SubSector: Savings & Loans | |
| MarketCap: 456.03 Millions | |
| Recent Price: 9.19 Smart Investing & Trading Score: 18 | |
| Day Percent Change: -1.50% Day Change: -0.14 | |
| Week Change: -2.65% Year-to-date Change: -23.3% | |
| HONE Links: Profile News Message Board | |
| Charts:- Daily , Weekly | |
| Add HONE to Watchlist: View: Get Complete HONE Trend Analysis ➞ | |
 | CVRX CVRx, Inc. |
| Sector: Health Care | |
| SubSector: Medical Devices | |
| MarketCap: 327 Millions | |
| Recent Price: 16.38 Smart Investing & Trading Score: 20 | |
| Day Percent Change: -1.50% Day Change: -0.25 | |
| Week Change: -4.93% Year-to-date Change: -47.9% | |
| CVRX Links: Profile News Message Board | |
| Charts:- Daily , Weekly | |
| Add CVRX to Watchlist: View: Get Complete CVRX Trend Analysis ➞ | |
 | RELY Remitly Global, Inc. |
| Sector: Technology | |
| SubSector: Software - Infrastructure | |
| MarketCap: 3320 Millions | |
| Recent Price: 18.25 Smart Investing & Trading Score: 71 | |
| Day Percent Change: -1.51% Day Change: -0.28 | |
| Week Change: -4.4% Year-to-date Change: -6.0% | |
| RELY Links: Profile News Message Board | |
| Charts:- Daily , Weekly | |
| Add RELY to Watchlist: View: Get Complete RELY Trend Analysis ➞ | |
 | FA First Advantage Corporation |
| Sector: Industrials | |
| SubSector: Specialty Business Services | |
| MarketCap: 2170 Millions | |
| Recent Price: 14.92 Smart Investing & Trading Score: 0 | |
| Day Percent Change: -1.52% Day Change: -0.23 | |
| Week Change: -4.79% Year-to-date Change: -10.6% | |
| FA Links: Profile News Message Board | |
| Charts:- Daily , Weekly | |
| Add FA to Watchlist: View: Get Complete FA Trend Analysis ➞ | |
 | EBS Emergent BioSolutions Inc. |
| Sector: Health Care | |
| SubSector: Biotechnology | |
| MarketCap: 2417.65 Millions | |
| Recent Price: 1.95 Smart Investing & Trading Score: 46 | |
| Day Percent Change: -1.52% Day Change: -0.03 | |
| Week Change: -5.34% Year-to-date Change: -18.8% | |
| EBS Links: Profile News Message Board | |
| Charts:- Daily , Weekly | |
| Add EBS to Watchlist: View: Get Complete EBS Trend Analysis ➞ | |
 | HMST HomeStreet, Inc. |
| Sector: Financials | |
| SubSector: Savings & Loans | |
| MarketCap: 535.33 Millions | |
| Recent Price: 12.31 Smart Investing & Trading Score: 20 | |
| Day Percent Change: -1.52% Day Change: -0.19 | |
| Week Change: -4.35% Year-to-date Change: 19.5% | |
| HMST Links: Profile News Message Board | |
| Charts:- Daily , Weekly | |
| Add HMST to Watchlist: View: Get Complete HMST Trend Analysis ➞ | |
 | TDW Tidewater Inc. |
| Sector: Energy | |
| SubSector: Oil & Gas Equipment & Services | |
| MarketCap: 295.061 Millions | |
| Recent Price: 92.20 Smart Investing & Trading Score: 44 | |
| Day Percent Change: -1.53% Day Change: -1.43 | |
| Week Change: -4.84% Year-to-date Change: 27.9% | |
| TDW Links: Profile News Message Board | |
| Charts:- Daily , Weekly | |
| Add TDW to Watchlist: View: Get Complete TDW Trend Analysis ➞ | |
 | FGEN FibroGen, Inc. |
| Sector: Health Care | |
| SubSector: Biotechnology | |
| MarketCap: 2502.95 Millions | |
| Recent Price: 1.29 Smart Investing & Trading Score: 27 | |
| Day Percent Change: -1.53% Day Change: -0.02 | |
| Week Change: -5.15% Year-to-date Change: 45.6% | |
| FGEN Links: Profile News Message Board | |
| Charts:- Daily , Weekly | |
| Add FGEN to Watchlist: View: Get Complete FGEN Trend Analysis ➞ | |
 | SNDX Syndax Pharmaceuticals, Inc. |
| Sector: Health Care | |
| SubSector: Biotechnology | |
| MarketCap: 365.985 Millions | |
| Recent Price: 21.29 Smart Investing & Trading Score: 46 | |
| Day Percent Change: -1.53% Day Change: -0.33 | |
| Week Change: -1.98% Year-to-date Change: -1.5% | |
| SNDX Links: Profile News Message Board | |
| Charts:- Daily , Weekly | |
| Add SNDX to Watchlist: View: Get Complete SNDX Trend Analysis ➞ | |
 | TRTX TPG RE Finance Trust, Inc. |
| Sector: Financials | |
| SubSector: Mortgage Investment | |
| MarketCap: 607.739 Millions | |
| Recent Price: 7.09 Smart Investing & Trading Score: 36 | |
| Day Percent Change: -1.53% Day Change: -0.11 | |
| Week Change: -3.01% Year-to-date Change: 9.1% | |
| TRTX Links: Profile News Message Board | |
| Charts:- Daily , Weekly | |
| Add TRTX to Watchlist: View: Get Complete TRTX Trend Analysis ➞ | |
 | BKH Black Hills Corporation |
| Sector: Utilities | |
| SubSector: Electric Utilities | |
| MarketCap: 3666.94 Millions | |
| Recent Price: 51.20 Smart Investing & Trading Score: 10 | |
| Day Percent Change: -1.54% Day Change: -0.80 | |
| Week Change: -1.99% Year-to-date Change: -5.1% | |
| BKH Links: Profile News Message Board | |
| Charts:- Daily , Weekly | |
| Add BKH to Watchlist: View: Get Complete BKH Trend Analysis ➞ | |
 | TRMK Trustmark Corporation |
| Sector: Financials | |
| SubSector: Regional - Southeast Banks | |
| MarketCap: 1630.15 Millions | |
| Recent Price: 25.64 Smart Investing & Trading Score: 10 | |
| Day Percent Change: -1.54% Day Change: -0.40 | |
| Week Change: -2.14% Year-to-date Change: -8.0% | |
| TRMK Links: Profile News Message Board | |
| Charts:- Daily , Weekly | |
| Add TRMK to Watchlist: View: Get Complete TRMK Trend Analysis ➞ | |
| Too many stocks? View smallcap stocks filtered by marketcap & sector |
| Marketcap: All SmallCap Stocks (default-no microcap), Large, Mid-Range, Small & MicroCap |
| Sector: Tech, Finance, Energy, Staples, Retail, Industrial, Materials, Utilities & Medical |
|
Best Stocks Today 12Stocks.com |
© 2024 12Stocks.com Terms & Conditions Privacy Contact Us
All Information Provided Only For Education And Not To Be Used For Investing or Trading. See Terms & Conditions


One More Thing ... Get Best Stocks Delivered Daily!
Never Ever Miss A Move With Our Top Ten Stocks Lists
Find Best Stocks In Any Market - Bull or Bear Market
Take A Peek At Our Top Ten Stocks Lists: Daily, Weekly, Year-to-Date & Top Trends
Find Best Stocks In Any Market - Bull or Bear Market
Take A Peek At Our Top Ten Stocks Lists: Daily, Weekly, Year-to-Date & Top Trends
Smallcap Stocks With Best Up Trends [0-bearish to 100-bullish]: Macatawa Bank[100], ProKidney [100], Intra-Cellular Therapies[100], Warrior Met[100], IMAX [100], Boot Barn[100], Argan [100], Encore Wire[100], Core Molding[100], Oscar Health[95], Mercury General[95]
Best Smallcap Stocks Year-to-Date:
CareMax [506.19%], Janux [369.99%], Viking [259.22%], Super Micro[243.41%], Alpine Immune[238.71%], Arcutis Bio[212.38%], Longboard [198.85%], Vera [174.87%], Avidity Biosciences[164.49%], Veritone [140.11%], Stoke [136.88%] Best Smallcap Stocks This Week:
ProKidney [56%], Macatawa Bank[42.54%], Snap One[29.3%], Intra-Cellular Therapies[21.21%], Escalade [15.03%], ALX Oncology[11.51%], Encore Wire[11.12%], Warrior Met[9.13%], Super Micro[8.65%], NextNav [8.1%], Envestnet [7.85%] Best Smallcap Stocks Daily:
Macatawa Bank[37.66%], ProKidney [30.62%], Intra-Cellular Therapies[23.30%], System1 [21.93%], Escalade [16.11%], NextNav [13.54%], ALX Oncology[12.72%], Allbirds [10.78%], Super Micro[10.58%], Mondee [9.57%], Nuvectis Pharma[9.44%]