
 Login Sign Up


| |||||
 |  | ||||

| 12Stocks.com Market Intelligence |
Best SmallCap Stocks
|
| In a hurry? Small Cap Stock Lists: Performance Trends Table, Stock Charts
Sort Small Cap stocks: Daily, Weekly, Year-to-Date, Market Cap & Trends. Filter Small Cap stocks list by sector: Show all, Tech, Finance, Energy, Staples, Retail, Industrial, Materials, Utilities and HealthCare Filter Small Cap stocks list by size: All Large Medium Small and MicroCap |
| 12Stocks.com Small Cap Stocks Performances & Trends Daily | |||||||||
|
|  The overall Smart Investing & Trading Score is 23 (0-bearish to 100-bullish) which puts Small Cap index in short term bearish to neutral trend. The Smart Investing & Trading Score from previous trading session is 13 and hence an improvement of trend.
| ||||||||
Here are the Smart Investing & Trading Scores of the most requested small cap stocks at 12Stocks.com (click stock name for detailed review):
|


| 12Stocks.com: Investing in Smallcap Index with Stocks | |
|
The following table helps investors and traders sort through current performance and trends (as measured by Smart Investing & Trading Score) of various
stocks in the Smallcap Index. Quick View: Move mouse or cursor over stock symbol (ticker) to view short-term technical chart and over stock name to view long term chart. Click on  to add stock symbol to your watchlist and to add stock symbol to your watchlist and  to view watchlist. Click on any ticker or stock name for detailed market intelligence report for that stock. to view watchlist. Click on any ticker or stock name for detailed market intelligence report for that stock. |
12Stocks.com Performance of Stocks in Smallcap Index
| Ticker | Stock Name | Watchlist | Category | Recent Price | Smart Investing & Trading Score | Change % | YTD Change% |
| GSBC | Great Southern |   | Financials | 50.92 | 35 | 1.66 | -14.20% |
| PI | Impinj | | Technology | 122.08 | 61 | 1.66 | 35.60% |
| JELD | JELD-WEN Holding | | Industrials | 18.33 | 10 | 1.66 | -2.91% |
| CWT | California Water | | Utilities | 44.90 | 52 | 1.65 | -13.44% |
| BRCC | BRC | | Consumer Staples | 4.32 | 54 | 1.65 | 18.68% |
| COUR | Coursera | | Consumer Staples | 12.03 | 20 | 1.65 | -38.85% |
| PRA | ProAssurance | | Financials | 13.08 | 57 | 1.63 | -5.15% |
| XOMA | XOMA | | Health Care | 24.65 | 58 | 1.63 | 33.22% |
| CXM | Sprinklr | | Technology | 11.55 | 32 | 1.63 | -4.47% |
| FPI | Farmland Partners | | Financials | 10.58 | 42 | 1.63 | -15.22% |
| CBL | CBL & Associates Properties | | Financials | 21.34 | 0 | 1.62 | -12.61% |
| FLWS | 1-800-FLOWERS.COM | | Services & Goods | 8.78 | 32 | 1.62 | -18.55% |
| RNST | Renasant | | Financials | 28.77 | 23 | 1.62 | -14.58% |
| ONB | Old National | | Financials | 15.78 | 18 | 1.61 | -6.57% |
| SYBT | Stock Yards | | Financials | 43.03 | 20 | 1.61 | -16.43% |
| CCRN | Cross Country | | Services & Goods | 17.15 | 20 | 1.60 | -24.25% |
| VTYX | Ventyx Biosciences | | Health Care | 4.45 | 53 | 1.60 | 79.80% |
| IBCP | Independent Bank | | Financials | 23.57 | 32 | 1.59 | -9.42% |
| OLP | One Liberty | | Financials | 21.75 | 61 | 1.59 | -0.73% |
| BFLY | Butterfly | | Health Care | 0.83 | 10 | 1.59 | -26.34% |
| TCBX | Third Coast | | Financials | 18.48 | 22 | 1.59 | -7.65% |
| LMNR | Limoneira | | Consumer Staples | 19.30 | 56 | 1.58 | -6.45% |
| HLLY | Holley | | Services & Goods | 4.17 | 23 | 1.58 | -15.91% |
| AGX | Argan | | Industrials | 60.99 | 95 | 1.57 | 30.35% |
| MPLN | MultiPlan | | Health Care | 0.74 | 32 | 1.57 | -48.84% |


| Too many stocks? View smallcap stocks filtered by marketcap & sector |
| Marketcap: All SmallCap Stocks (default-no microcap), Large, Mid-Range, Small |
| Smallcap Sector: Tech, Finance, Energy, Staples, Retail, Industrial, Materials, & Medical |
|
Get the most comprehensive stock market coverage daily at 12Stocks.com ➞ Best Stocks Today ➞ Best Stocks Weekly ➞ Best Stocks Year-to-Date ➞ Best Stocks Trends ➞  Best Stocks Today 12Stocks.com Best Nasdaq Stocks ➞ Best S&P 500 Stocks ➞ Best Tech Stocks ➞ Best Biotech Stocks ➞ |
| Detailed Overview of SmallCap Stocks |
| SmallCap Technical Overview, Leaders & Laggards, Top SmallCap ETF Funds & Detailed SmallCap Stocks List, Charts, Trends & More |
| Smallcap: Technical Analysis, Trends & YTD Performance | |
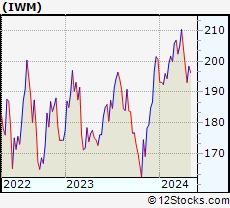
| SmallCap segment as represented by
IWM, an exchange-traded fund [ETF], holds basket of thousands of smallcap stocks from across all major sectors of the US stock market. The smallcap index (contains stocks like Riverbed & Sotheby's) is down by -3.92% and is currently underperforming the overall market by -8.11% year-to-date. Below is a quick view of technical charts and trends: | |
 IWM Weekly Chart |
|
| Long Term Trend: Not Good | |
| Medium Term Trend: Not Good | |
 IWM Daily Chart |
|
| Short Term Trend: Not Good | |
| Overall Trend Score: 23 | |
| YTD Performance: -3.92% | |
| **Trend Scores & Views Are Only For Educational Purposes And Not For Investing | |
| 12Stocks.com: Top Performing Small Cap Index Stocks | ||||||||||||||||||||||||||||||||||||||||||||||||
 The top performing Small Cap Index stocks year to date are
Now, more recently, over last week, the top performing Small Cap Index stocks on the move are


|
||||||||||||||||||||||||||||||||||||||||||||||||
| 12Stocks.com: Investing in Smallcap Index using Exchange Traded Funds | |
|
The following table shows list of key exchange traded funds (ETF) that
help investors track Smallcap index. The following list also includes leveraged ETF funds that track twice or thrice the daily returns of Smallcap indices. Short or inverse ETF funds move in the opposite direction to the index they track and are useful during market pullbacks or during bear markets. Quick View: Move mouse or cursor over ETF symbol (ticker) to view short-term technical chart and over ETF name to view long term chart. Click on ticker or stock name for detailed view. Click on to add stock symbol to your watchlist and to view watchlist. |
12Stocks.com List of ETFs that track Smallcap Index
| Ticker | ETF Name | Watchlist | Recent Price | Smart Investing & Trading Score | Change % | Week % | Year-to-date % |
| IWM | iShares Russell 2000 | | 192.84 | 23 | -0.08 | -2.94 | -3.92% |
| IJR | iShares Core S&P Small-Cap | | 102.34 | 31 | 0.21 | -2.08 | -5.46% |
| VTWO | Vanguard Russell 2000 ETF | | 77.94 | 23 | -0.14 | -2.96 | -3.9% |
| IWN | iShares Russell 2000 Value | | 146.33 | 10 | 0.21 | -2.69 | -5.79% |
| IJS | iShares S&P Small-Cap 600 Value | | 94.51 | 10 | 0.41 | -1.73 | -8.31% |
| IWO | iShares Russell 2000 Growth | | 246.94 | 36 | -0.44 | -3.3 | -2.09% |
| IJT | iShares S&P Small-Cap 600 Growth | | 121.59 | 23 | -0.21 | -2.56 | -2.84% |
| XSLV | PowerShares S&P SmallCap Low Volatil ETF | | 41.65 | 25 | 0.56 | -1.05 | -5.66% |
| SAA | ProShares Ultra SmallCap600 | | 21.62 | 10 | -0.18 | -4.17 | -13.35% |
| SMLV | SPDR SSGA US Small Cap Low Volatil ETF | | 103.83 | 18 | 0.16 | -1.13 | -7.72% |
| SBB | ProShares Short SmallCap600 | | 16.77 | 80 | -0.50 | 1.32 | 5.24% |
| SDD | ProShares UltraShort SmallCap600 | | 20.16 | 80 | -2.14 | 1.66 | 9.41% |
| 12Stocks.com: Charts, Trends, Fundamental Data and Performances of SmallCap Stocks | |
|
We now take in-depth look at all SmallCap stocks including charts, multi-period performances and overall trends (as measured by Smart Investing & Trading Score). One can sort SmallCap stocks (click link to choose) by Daily, Weekly and by Year-to-Date performances. Also, one can sort by size of the company or by market capitalization. |
| Select Your Default Chart Type: | |||||
| |||||
| Click on stock symbol or name for detailed view. Click on to add stock symbol to your watchlist and to view watchlist. Quick View: Move mouse or cursor over "Daily" to quickly view daily technical stock chart and over "Weekly" to view weekly technical stock chart. | |||||

 | GSBC Great Southern Bancorp, Inc. |
| Sector: Financials | |
| SubSector: Regional - Southwest Banks | |
| MarketCap: 524.765 Millions | |
| Recent Price: 50.92 Smart Investing & Trading Score: 35 | |
| Day Percent Change: 1.66% Day Change: 0.83 | |
| Week Change: 0.02% Year-to-date Change: -14.2% | |
| GSBC Links: Profile News Message Board | |
| Charts:- Daily , Weekly | |
| Add GSBC to Watchlist: View: Get Complete GSBC Trend Analysis ➞ | |
 | PI Impinj, Inc. |
| Sector: Technology | |
| SubSector: Communication Equipment | |
| MarketCap: 364.739 Millions | |
| Recent Price: 122.08 Smart Investing & Trading Score: 61 | |
| Day Percent Change: 1.66% Day Change: 1.99 | |
| Week Change: 1.75% Year-to-date Change: 35.6% | |
| PI Links: Profile News Message Board | |
| Charts:- Daily , Weekly | |
| Add PI to Watchlist: View: Get Complete PI Trend Analysis ➞ | |
 | JELD JELD-WEN Holding, Inc. |
| Sector: Industrials | |
| SubSector: General Building Materials | |
| MarketCap: 1022.53 Millions | |
| Recent Price: 18.33 Smart Investing & Trading Score: 10 | |
| Day Percent Change: 1.66% Day Change: 0.30 | |
| Week Change: -5.37% Year-to-date Change: -2.9% | |
| JELD Links: Profile News Message Board | |
| Charts:- Daily , Weekly | |
| Add JELD to Watchlist: View: Get Complete JELD Trend Analysis ➞ | |
 | CWT California Water Service Group |
| Sector: Utilities | |
| SubSector: Water Utilities | |
| MarketCap: 2790.92 Millions | |
| Recent Price: 44.90 Smart Investing & Trading Score: 52 | |
| Day Percent Change: 1.65% Day Change: 0.73 | |
| Week Change: 1.13% Year-to-date Change: -13.4% | |
| CWT Links: Profile News Message Board | |
| Charts:- Daily , Weekly | |
| Add CWT to Watchlist: View: Get Complete CWT Trend Analysis ➞ | |
 | BRCC BRC Inc. |
| Sector: Consumer Staples | |
| SubSector: Packaged Foods | |
| MarketCap: 1110 Millions | |
| Recent Price: 4.32 Smart Investing & Trading Score: 54 | |
| Day Percent Change: 1.65% Day Change: 0.07 | |
| Week Change: 1.65% Year-to-date Change: 18.7% | |
| BRCC Links: Profile News Message Board | |
| Charts:- Daily , Weekly | |
| Add BRCC to Watchlist: View: Get Complete BRCC Trend Analysis ➞ | |
 | COUR Coursera, Inc. |
| Sector: Consumer Staples | |
| SubSector: Education & Training Services | |
| MarketCap: 1990 Millions | |
| Recent Price: 12.03 Smart Investing & Trading Score: 20 | |
| Day Percent Change: 1.65% Day Change: 0.20 | |
| Week Change: -8.21% Year-to-date Change: -38.9% | |
| COUR Links: Profile News Message Board | |
| Charts:- Daily , Weekly | |
| Add COUR to Watchlist: View: Get Complete COUR Trend Analysis ➞ | |
 | PRA ProAssurance Corporation |
| Sector: Financials | |
| SubSector: Accident & Health Insurance | |
| MarketCap: 1434.6 Millions | |
| Recent Price: 13.08 Smart Investing & Trading Score: 57 | |
| Day Percent Change: 1.63% Day Change: 0.21 | |
| Week Change: -1.36% Year-to-date Change: -5.2% | |
| PRA Links: Profile News Message Board | |
| Charts:- Daily , Weekly | |
| Add PRA to Watchlist: View: Get Complete PRA Trend Analysis ➞ | |
 | XOMA XOMA Corporation |
| Sector: Health Care | |
| SubSector: Biotechnology | |
| MarketCap: 174.885 Millions | |
| Recent Price: 24.65 Smart Investing & Trading Score: 58 | |
| Day Percent Change: 1.63% Day Change: 0.39 | |
| Week Change: -4.66% Year-to-date Change: 33.2% | |
| XOMA Links: Profile News Message Board | |
| Charts:- Daily , Weekly | |
| Add XOMA to Watchlist: View: Get Complete XOMA Trend Analysis ➞ | |
 | CXM Sprinklr, Inc. |
| Sector: Technology | |
| SubSector: Software - Application | |
| MarketCap: 3700 Millions | |
| Recent Price: 11.55 Smart Investing & Trading Score: 32 | |
| Day Percent Change: 1.63% Day Change: 0.19 | |
| Week Change: -0.04% Year-to-date Change: -4.5% | |
| CXM Links: Profile News Message Board | |
| Charts:- Daily , Weekly | |
| Add CXM to Watchlist: View: Get Complete CXM Trend Analysis ➞ | |
 | FPI Farmland Partners Inc. |
| Sector: Financials | |
| SubSector: REIT - Diversified | |
| MarketCap: 182.653 Millions | |
| Recent Price: 10.58 Smart Investing & Trading Score: 42 | |
| Day Percent Change: 1.63% Day Change: 0.17 | |
| Week Change: 0.76% Year-to-date Change: -15.2% | |
| FPI Links: Profile News Message Board | |
| Charts:- Daily , Weekly | |
| Add FPI to Watchlist: View: Get Complete FPI Trend Analysis ➞ | |
 | CBL CBL & Associates Properties, Inc. |
| Sector: Financials | |
| SubSector: REIT - Retail | |
| MarketCap: 690 Millions | |
| Recent Price: 21.34 Smart Investing & Trading Score: 0 | |
| Day Percent Change: 1.62% Day Change: 0.34 | |
| Week Change: -2.56% Year-to-date Change: -12.6% | |
| CBL Links: Profile News Message Board | |
| Charts:- Daily , Weekly | |
| Add CBL to Watchlist: View: Get Complete CBL Trend Analysis ➞ | |
 | FLWS 1-800-FLOWERS.COM, Inc. |
| Sector: Services & Goods | |
| SubSector: Specialty Retail, Other | |
| MarketCap: 940 Millions | |
| Recent Price: 8.78 Smart Investing & Trading Score: 32 | |
| Day Percent Change: 1.62% Day Change: 0.14 | |
| Week Change: -1.79% Year-to-date Change: -18.6% | |
| FLWS Links: Profile News Message Board | |
| Charts:- Daily , Weekly | |
| Add FLWS to Watchlist: View: Get Complete FLWS Trend Analysis ➞ | |
 | RNST Renasant Corporation |
| Sector: Financials | |
| SubSector: Money Center Banks | |
| MarketCap: 1279.39 Millions | |
| Recent Price: 28.77 Smart Investing & Trading Score: 23 | |
| Day Percent Change: 1.62% Day Change: 0.46 | |
| Week Change: -0.1% Year-to-date Change: -14.6% | |
| RNST Links: Profile News Message Board | |
| Charts:- Daily , Weekly | |
| Add RNST to Watchlist: View: Get Complete RNST Trend Analysis ➞ | |
 | ONB Old National Bancorp |
| Sector: Financials | |
| SubSector: Regional - Midwest Banks | |
| MarketCap: 2340.8 Millions | |
| Recent Price: 15.78 Smart Investing & Trading Score: 18 | |
| Day Percent Change: 1.61% Day Change: 0.25 | |
| Week Change: -0.19% Year-to-date Change: -6.6% | |
| ONB Links: Profile News Message Board | |
| Charts:- Daily , Weekly | |
| Add ONB to Watchlist: View: Get Complete ONB Trend Analysis ➞ | |
 | SYBT Stock Yards Bancorp, Inc. |
| Sector: Financials | |
| SubSector: Regional - Southeast Banks | |
| MarketCap: 629.235 Millions | |
| Recent Price: 43.03 Smart Investing & Trading Score: 20 | |
| Day Percent Change: 1.61% Day Change: 0.68 | |
| Week Change: -2.07% Year-to-date Change: -16.4% | |
| SYBT Links: Profile News Message Board | |
| Charts:- Daily , Weekly | |
| Add SYBT to Watchlist: View: Get Complete SYBT Trend Analysis ➞ | |
 | CCRN Cross Country Healthcare, Inc. |
| Sector: Services & Goods | |
| SubSector: Staffing & Outsourcing Services | |
| MarketCap: 348.328 Millions | |
| Recent Price: 17.15 Smart Investing & Trading Score: 20 | |
| Day Percent Change: 1.60% Day Change: 0.27 | |
| Week Change: -2.33% Year-to-date Change: -24.3% | |
| CCRN Links: Profile News Message Board | |
| Charts:- Daily , Weekly | |
| Add CCRN to Watchlist: View: Get Complete CCRN Trend Analysis ➞ | |
 | VTYX Ventyx Biosciences, Inc. |
| Sector: Health Care | |
| SubSector: Biotechnology | |
| MarketCap: 1950 Millions | |
| Recent Price: 4.45 Smart Investing & Trading Score: 53 | |
| Day Percent Change: 1.60% Day Change: 0.07 | |
| Week Change: -3.26% Year-to-date Change: 79.8% | |
| VTYX Links: Profile News Message Board | |
| Charts:- Daily , Weekly | |
| Add VTYX to Watchlist: View: Get Complete VTYX Trend Analysis ➞ | |
 | IBCP Independent Bank Corporation |
| Sector: Financials | |
| SubSector: Regional - Midwest Banks | |
| MarketCap: 273.67 Millions | |
| Recent Price: 23.57 Smart Investing & Trading Score: 32 | |
| Day Percent Change: 1.59% Day Change: 0.37 | |
| Week Change: 1.25% Year-to-date Change: -9.4% | |
| IBCP Links: Profile News Message Board | |
| Charts:- Daily , Weekly | |
| Add IBCP to Watchlist: View: Get Complete IBCP Trend Analysis ➞ | |
 | OLP One Liberty Properties, Inc. |
| Sector: Financials | |
| SubSector: REIT - Diversified | |
| MarketCap: 378.353 Millions | |
| Recent Price: 21.75 Smart Investing & Trading Score: 61 | |
| Day Percent Change: 1.59% Day Change: 0.34 | |
| Week Change: -1.27% Year-to-date Change: -0.7% | |
| OLP Links: Profile News Message Board | |
| Charts:- Daily , Weekly | |
| Add OLP to Watchlist: View: Get Complete OLP Trend Analysis ➞ | |
 | BFLY Butterfly Network, Inc. |
| Sector: Health Care | |
| SubSector: Medical Devices | |
| MarketCap: 461 Millions | |
| Recent Price: 0.83 Smart Investing & Trading Score: 10 | |
| Day Percent Change: 1.59% Day Change: 0.01 | |
| Week Change: -6.41% Year-to-date Change: -26.3% | |
| BFLY Links: Profile News Message Board | |
| Charts:- Daily , Weekly | |
| Add BFLY to Watchlist: View: Get Complete BFLY Trend Analysis ➞ | |
 | TCBX Third Coast Bancshares, Inc. |
| Sector: Financials | |
| SubSector: Banks - Regional | |
| MarketCap: 212 Millions | |
| Recent Price: 18.48 Smart Investing & Trading Score: 22 | |
| Day Percent Change: 1.59% Day Change: 0.29 | |
| Week Change: -0.11% Year-to-date Change: -7.7% | |
| TCBX Links: Profile News Message Board | |
| Charts:- Daily , Weekly | |
| Add TCBX to Watchlist: View: Get Complete TCBX Trend Analysis ➞ | |
 | LMNR Limoneira Company |
| Sector: Consumer Staples | |
| SubSector: Farm Products | |
| MarketCap: 324.987 Millions | |
| Recent Price: 19.30 Smart Investing & Trading Score: 56 | |
| Day Percent Change: 1.58% Day Change: 0.30 | |
| Week Change: 0% Year-to-date Change: -6.5% | |
| LMNR Links: Profile News Message Board | |
| Charts:- Daily , Weekly | |
| Add LMNR to Watchlist: View: Get Complete LMNR Trend Analysis ➞ | |
 | HLLY Holley Inc. |
| Sector: Services & Goods | |
| SubSector: Auto Parts | |
| MarketCap: 469 Millions | |
| Recent Price: 4.17 Smart Investing & Trading Score: 23 | |
| Day Percent Change: 1.58% Day Change: 0.06 | |
| Week Change: -0.83% Year-to-date Change: -15.9% | |
| HLLY Links: Profile News Message Board | |
| Charts:- Daily , Weekly | |
| Add HLLY to Watchlist: View: Get Complete HLLY Trend Analysis ➞ | |
 | AGX Argan, Inc. |
| Sector: Industrials | |
| SubSector: Heavy Construction | |
| MarketCap: 664.095 Millions | |
| Recent Price: 60.99 Smart Investing & Trading Score: 95 | |
| Day Percent Change: 1.57% Day Change: 0.94 | |
| Week Change: 2.04% Year-to-date Change: 30.4% | |
| AGX Links: Profile News Message Board | |
| Charts:- Daily , Weekly | |
| Add AGX to Watchlist: View: Get Complete AGX Trend Analysis ➞ | |
 | MPLN MultiPlan Corporation |
| Sector: Health Care | |
| SubSector: Healthcare Plans | |
| MarketCap: 56087 Millions | |
| Recent Price: 0.74 Smart Investing & Trading Score: 32 | |
| Day Percent Change: 1.57% Day Change: 0.01 | |
| Week Change: -6.45% Year-to-date Change: -48.8% | |
| MPLN Links: Profile News Message Board | |
| Charts:- Daily , Weekly | |
| Add MPLN to Watchlist: View: Get Complete MPLN Trend Analysis ➞ | |
| Too many stocks? View smallcap stocks filtered by marketcap & sector |
| Marketcap: All SmallCap Stocks (default-no microcap), Large, Mid-Range, Small & MicroCap |
| Sector: Tech, Finance, Energy, Staples, Retail, Industrial, Materials, Utilities & Medical |
|
Best Stocks Today 12Stocks.com |
© 2024 12Stocks.com Terms & Conditions Privacy Contact Us
All Information Provided Only For Education And Not To Be Used For Investing or Trading. See Terms & Conditions


One More Thing ... Get Best Stocks Delivered Daily!
Never Ever Miss A Move With Our Top Ten Stocks Lists
Find Best Stocks In Any Market - Bull or Bear Market
Take A Peek At Our Top Ten Stocks Lists: Daily, Weekly, Year-to-Date & Top Trends
Find Best Stocks In Any Market - Bull or Bear Market
Take A Peek At Our Top Ten Stocks Lists: Daily, Weekly, Year-to-Date & Top Trends
Smallcap Stocks With Best Up Trends [0-bearish to 100-bullish]: Badger Meter[100], Cullinan Oncology[100], Oscar Health[100], NextNav [100], Richardson Electronics[100], Seneca Foods[100], Lantheus [100], Macatawa Bank[100], Geron [100], IMAX [100], Regional Management[100]
Best Smallcap Stocks Year-to-Date:
Agenus [500.31%], CareMax [417.53%], Janux [348.12%], Viking [248.9%], Alpine Immune[238.5%], Super Micro[226.74%], Longboard [194.76%], Arcutis Bio[192.57%], Vera [161.3%], Avidity Biosciences[154.87%], Hippo [128.32%] Best Smallcap Stocks This Week:
Macatawa Bank[44.53%], 23andMe Holding[33.3%], ProKidney [32%], Snap One[29.73%], Vertex Energy[23.08%], ALX Oncology[20.64%], Vanda [20.63%], Expensify [18.37%], Badger Meter[16.72%], ContextLogic [15%], Cullinan Oncology[13.89%] Best Smallcap Stocks Daily:
23andMe Holding[65.91%], Vertex Energy[30.72%], Zura Bio[17.20%], Badger Meter[16.65%], ContextLogic [15.81%], Expensify [15.23%], Montrose Environmental[12.84%], Vaxxinity [10.05%], Vuzix [9.87%], Cipher Mining[8.65%], FiscalNote [8.61%]