
 Login Sign Up


| |||||
 |  | ||||

| 12Stocks.com Market Intelligence |
Best SmallCap Stocks
|
| In a hurry? Small Cap Stock Lists: Performance Trends Table, Stock Charts
Sort Small Cap stocks: Daily, Weekly, Year-to-Date, Market Cap & Trends. Filter Small Cap stocks list by sector: Show all, Tech, Finance, Energy, Staples, Retail, Industrial, Materials, Utilities and HealthCare Filter Small Cap stocks list by size: All Large Medium Small and MicroCap |
| 12Stocks.com Small Cap Stocks Performances & Trends Daily | |||||||||
|
|  The overall Smart Investing & Trading Score is 69 (0-bearish to 100-bullish) which puts Small Cap index in short term neutral to bullish trend. The Smart Investing & Trading Score from previous trading session is 49 and hence an improvement of trend.
| ||||||||
Here are the Smart Investing & Trading Scores of the most requested small cap stocks at 12Stocks.com (click stock name for detailed review):
|


| 12Stocks.com: Investing in Smallcap Index with Stocks | |
|
The following table helps investors and traders sort through current performance and trends (as measured by Smart Investing & Trading Score) of various
stocks in the Smallcap Index. Quick View: Move mouse or cursor over stock symbol (ticker) to view short-term technical chart and over stock name to view long term chart. Click on  to add stock symbol to your watchlist and to add stock symbol to your watchlist and  to view watchlist. Click on any ticker or stock name for detailed market intelligence report for that stock. to view watchlist. Click on any ticker or stock name for detailed market intelligence report for that stock. |
12Stocks.com Performance of Stocks in Smallcap Index
| Ticker | Stock Name | Watchlist | Category | Recent Price | Smart Investing & Trading Score | Change % | YTD Change% |
| IESC | IES |   | Industrials | 161.39 | 100 | 17.92 | 103.72% |
| ENVX | Enovix | | Industrials | 9.96 | 100 | 16.62 | -20.85% |
| SWIM | Latham Group | | Industrials | 2.73 | 22 | 13.51 | 3.41% |
| ACA | Arcosa | | Industrials | 85.33 | 100 | 9.96 | 3.26% |
| TILE | Interface | | Industrials | 17.39 | 100 | 9.65 | 37.80% |
| PCT | PureCycle | | Industrials | 5.34 | 49 | 9.31 | 31.69% |
| EOSE | Eos Energy | | Industrials | 0.75 | 22 | 8.59 | -31.52% |
| SPCE | Virgin Galactic | | Industrials | 0.95 | 54 | 7.50 | -61.31% |
| SPXC | SPX | | Industrials | 130.94 | 100 | 7.37 | 29.63% |
| AMPX | Amprius | | Industrials | 2.15 | 74 | 7.21 | -56.99% |
| GTLS | Chart Industries | | Industrials | 155.00 | 83 | 6.90 | 13.69% |
| ATRO | Astronics | | Industrials | 18.37 | 64 | 6.68 | 5.45% |
| LNZA | LanzaTech Global | | Industrials | 2.67 | 52 | 6.18 | -46.11% |
| LXFR | Luxfer | | Industrials | 11.70 | 100 | 5.69 | 30.87% |
| FCEL | FuelCell Energy | | Industrials | 0.90 | 30 | 5.44 | -43.76% |
| ASPN | Aspen Aerogels | | Industrials | 25.11 | 100 | 5.28 | 59.13% |
| ERII | Energy Recovery | | Industrials | 13.64 | 10 | 4.60 | -27.60% |
| USLM | United States | | Industrials | 340.19 | 100 | 4.14 | 47.68% |
| KBH | KB Home | | Industrials | 68.78 | 90 | 4.04 | 10.12% |
| CRS | Carpenter | | Industrials | 103.64 | 100 | 3.74 | 46.38% |
| GVA | Granite Construction | | Industrials | 59.39 | 100 | 3.72 | 16.77% |
| HLIO | Helios | | Industrials | 48.05 | 100 | 3.62 | 5.95% |
| RKLB | Rocket Lab | | Industrials | 4.00 | 64 | 3.62 | -27.31% |
| RDW | Redwire | | Industrials | 4.19 | 95 | 3.46 | 47.02% |
| JOBY | Joby Aviation | | Industrials | 5.38 | 64 | 3.46 | -18.98% |
| For chart view version of above stock list: Chart View ➞ 0 - 25 , 25 - 50 , 50 - 75 , 75 - 100 , 100 - 125 , 125 - 150 , 150 - 175 | ||
 | Click To Change The Sort Order: By Market Cap or Company Size Performance: Year-to-date, Week and Day |  |
| Too many stocks? View smallcap stocks filtered by marketcap & sector |
| Marketcap: All SmallCap Stocks (default-no microcap), Large, Mid-Range, Small |
| Smallcap Sector: Tech, Finance, Energy, Staples, Retail, Industrial, Materials, & Medical |
|
Get the most comprehensive stock market coverage daily at 12Stocks.com ➞ Best Stocks Today ➞ Best Stocks Weekly ➞ Best Stocks Year-to-Date ➞ Best Stocks Trends ➞  Best Stocks Today 12Stocks.com Best Nasdaq Stocks ➞ Best S&P 500 Stocks ➞ Best Tech Stocks ➞ Best Biotech Stocks ➞ |
| Detailed Overview of SmallCap Stocks |
| SmallCap Technical Overview, Leaders & Laggards, Top SmallCap ETF Funds & Detailed SmallCap Stocks List, Charts, Trends & More |
| Smallcap: Technical Analysis, Trends & YTD Performance | |
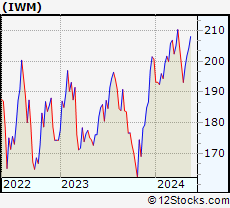
| SmallCap segment as represented by
IWM, an exchange-traded fund [ETF], holds basket of thousands of smallcap stocks from across all major sectors of the US stock market. The smallcap index (contains stocks like Riverbed & Sotheby's) is up by 0.59% and is currently underperforming the overall market by -6.29% year-to-date. Below is a quick view of technical charts and trends: | |
 IWM Weekly Chart |
|
| Long Term Trend: Not Good | |
| Medium Term Trend: Very Good | |
 IWM Daily Chart |
|
| Short Term Trend: Very Good | |
| Overall Trend Score: 69 | |
| YTD Performance: 0.59% | |
| **Trend Scores & Views Are Only For Educational Purposes And Not For Investing | |
| 12Stocks.com: Top Performing Small Cap Index Stocks | ||||||||||||||||||||||||||||||||||||||||||||||||
 The top performing Small Cap Index stocks year to date are
Now, more recently, over last week, the top performing Small Cap Index stocks on the move are


|
||||||||||||||||||||||||||||||||||||||||||||||||
| 12Stocks.com: Investing in Smallcap Index using Exchange Traded Funds | |
|
The following table shows list of key exchange traded funds (ETF) that
help investors track Smallcap index. The following list also includes leveraged ETF funds that track twice or thrice the daily returns of Smallcap indices. Short or inverse ETF funds move in the opposite direction to the index they track and are useful during market pullbacks or during bear markets. Quick View: Move mouse or cursor over ETF symbol (ticker) to view short-term technical chart and over ETF name to view long term chart. Click on ticker or stock name for detailed view. Click on to add stock symbol to your watchlist and to view watchlist. |
12Stocks.com List of ETFs that track Smallcap Index
| Ticker | ETF Name | Watchlist | Recent Price | Smart Investing & Trading Score | Change % | Week % | Year-to-date % |
| IWM | iShares Russell 2000 | | 201.90 | 69 | 0.99 | 1.77 | 0.59% |
| IJR | iShares Core S&P Small-Cap | | 107.13 | 82 | 0.75 | 1.4 | -1.03% |
| VTWO | Vanguard Russell 2000 ETF | | 81.61 | 69 | 0.94 | 1.73 | 0.63% |
| IWN | iShares Russell 2000 Value | | 154.21 | 100 | 0.87 | 2.03 | -0.72% |
| IJS | iShares S&P Small-Cap 600 Value | | 98.72 | 64 | 0.71 | 1.57 | -4.22% |
| IWO | iShares Russell 2000 Growth | | 256.87 | 57 | 0.99 | 1.49 | 1.84% |
| IJT | iShares S&P Small-Cap 600 Growth | | 127.76 | 95 | 0.82 | 1.32 | 2.09% |
| XSLV | PowerShares S&P SmallCap Low Volatil ETF | | 43.22 | 87 | 0.19 | 1.17 | -2.11% |
| SBB | ProShares Short SmallCap600 | | 16.16 | 13 | -1.28 | -1.37 | 1.44% |
| SDD | ProShares UltraShort SmallCap600 | | 18.84 | 23 | -2.41 | -2.61 | 2.27% |
| SAA | ProShares Ultra SmallCap600 | | 23.59 | 69 | 2.86 | 2.39 | -5.45% |
| SMLV | SPDR SSGA US Small Cap Low Volatil ETF | | 109.69 | 87 | 0.78 | 2.01 | -2.52% |
| 12Stocks.com: Charts, Trends, Fundamental Data and Performances of SmallCap Stocks | |
|
We now take in-depth look at all SmallCap stocks including charts, multi-period performances and overall trends (as measured by Smart Investing & Trading Score). One can sort SmallCap stocks (click link to choose) by Daily, Weekly and by Year-to-Date performances. Also, one can sort by size of the company or by market capitalization. |
| Select Your Default Chart Type: | |||||
| |||||
| Click on stock symbol or name for detailed view. Click on to add stock symbol to your watchlist and to view watchlist. Quick View: Move mouse or cursor over "Daily" to quickly view daily technical stock chart and over "Weekly" to view weekly technical stock chart. | |||||

 | IESC IES Holdings, Inc. |
| Sector: Industrials | |
| SubSector: General Contractors | |
| MarketCap: 380.963 Millions | |
| Recent Price: 161.39 Smart Investing & Trading Score: 100 | |
| Day Percent Change: 17.92% Day Change: 24.53 | |
| Week Change: 23.1% Year-to-date Change: 103.7% | |
| IESC Links: Profile News Message Board | |
| Charts:- Daily , Weekly | |
| Add IESC to Watchlist: View: Get Complete IESC Trend Analysis ➞ | |
 | ENVX Enovix Corporation |
| Sector: Industrials | |
| SubSector: Electrical Equipment & Parts | |
| MarketCap: 2740 Millions | |
| Recent Price: 9.96 Smart Investing & Trading Score: 100 | |
| Day Percent Change: 16.62% Day Change: 1.42 | |
| Week Change: 54.02% Year-to-date Change: -20.9% | |
| ENVX Links: Profile News Message Board | |
| Charts:- Daily , Weekly | |
| Add ENVX to Watchlist: View: Get Complete ENVX Trend Analysis ➞ | |
 | SWIM Latham Group, Inc. |
| Sector: Industrials | |
| SubSector: Building Products & Equipment | |
| MarketCap: 388 Millions | |
| Recent Price: 2.73 Smart Investing & Trading Score: 22 | |
| Day Percent Change: 13.51% Day Change: 0.33 | |
| Week Change: -10.49% Year-to-date Change: 3.4% | |
| SWIM Links: Profile News Message Board | |
| Charts:- Daily , Weekly | |
| Add SWIM to Watchlist: View: Get Complete SWIM Trend Analysis ➞ | |
 | ACA Arcosa, Inc. |
| Sector: Industrials | |
| SubSector: Farm & Construction Machinery | |
| MarketCap: 1692.57 Millions | |
| Recent Price: 85.33 Smart Investing & Trading Score: 100 | |
| Day Percent Change: 9.96% Day Change: 7.73 | |
| Week Change: 10.33% Year-to-date Change: 3.3% | |
| ACA Links: Profile News Message Board | |
| Charts:- Daily , Weekly | |
| Add ACA to Watchlist: View: Get Complete ACA Trend Analysis ➞ | |
 | TILE Interface, Inc. |
| Sector: Industrials | |
| SubSector: Textile Industrial | |
| MarketCap: 478 Millions | |
| Recent Price: 17.39 Smart Investing & Trading Score: 100 | |
| Day Percent Change: 9.65% Day Change: 1.53 | |
| Week Change: 11.4% Year-to-date Change: 37.8% | |
| TILE Links: Profile News Message Board | |
| Charts:- Daily , Weekly | |
| Add TILE to Watchlist: View: Get Complete TILE Trend Analysis ➞ | |
 | PCT PureCycle Technologies, Inc. |
| Sector: Industrials | |
| SubSector: Pollution & Treatment Controls | |
| MarketCap: 1610 Millions | |
| Recent Price: 5.34 Smart Investing & Trading Score: 49 | |
| Day Percent Change: 9.31% Day Change: 0.46 | |
| Week Change: 7.23% Year-to-date Change: 31.7% | |
| PCT Links: Profile News Message Board | |
| Charts:- Daily , Weekly | |
| Add PCT to Watchlist: View: Get Complete PCT Trend Analysis ➞ | |
 | EOSE Eos Energy Enterprises, Inc. |
| Sector: Industrials | |
| SubSector: Electrical Equipment & Parts | |
| MarketCap: 76627 Millions | |
| Recent Price: 0.75 Smart Investing & Trading Score: 22 | |
| Day Percent Change: 8.59% Day Change: 0.06 | |
| Week Change: -6.94% Year-to-date Change: -31.5% | |
| EOSE Links: Profile News Message Board | |
| Charts:- Daily , Weekly | |
| Add EOSE to Watchlist: View: Get Complete EOSE Trend Analysis ➞ | |
 | SPCE Virgin Galactic Holdings, Inc. |
| Sector: Industrials | |
| SubSector: Conglomerates | |
| MarketCap: 2612.48 Millions | |
| Recent Price: 0.95 Smart Investing & Trading Score: 54 | |
| Day Percent Change: 7.50% Day Change: 0.07 | |
| Week Change: 6.82% Year-to-date Change: -61.3% | |
| SPCE Links: Profile News Message Board | |
| Charts:- Daily , Weekly | |
| Add SPCE to Watchlist: View: Get Complete SPCE Trend Analysis ➞ | |
 | SPXC SPX Corporation |
| Sector: Industrials | |
| SubSector: Diversified Machinery | |
| MarketCap: 1415.56 Millions | |
| Recent Price: 130.94 Smart Investing & Trading Score: 100 | |
| Day Percent Change: 7.37% Day Change: 8.99 | |
| Week Change: 7.75% Year-to-date Change: 29.6% | |
| SPXC Links: Profile News Message Board | |
| Charts:- Daily , Weekly | |
| Add SPXC to Watchlist: View: Get Complete SPXC Trend Analysis ➞ | |
 | AMPX Amprius Technologies, Inc. |
| Sector: Industrials | |
| SubSector: Electrical Equipment & Parts | |
| MarketCap: 608 Millions | |
| Recent Price: 2.15 Smart Investing & Trading Score: 74 | |
| Day Percent Change: 7.21% Day Change: 0.15 | |
| Week Change: 23.85% Year-to-date Change: -57.0% | |
| AMPX Links: Profile News Message Board | |
| Charts:- Daily , Weekly | |
| Add AMPX to Watchlist: View: Get Complete AMPX Trend Analysis ➞ | |
 | GTLS Chart Industries, Inc. |
| Sector: Industrials | |
| SubSector: Metal Fabrication | |
| MarketCap: 751.15 Millions | |
| Recent Price: 155.00 Smart Investing & Trading Score: 83 | |
| Day Percent Change: 6.90% Day Change: 10.00 | |
| Week Change: 3.33% Year-to-date Change: 13.7% | |
| GTLS Links: Profile News Message Board | |
| Charts:- Daily , Weekly | |
| Add GTLS to Watchlist: View: Get Complete GTLS Trend Analysis ➞ | |
 | ATRO Astronics Corporation |
| Sector: Industrials | |
| SubSector: Aerospace/Defense Products & Services | |
| MarketCap: 287.201 Millions | |
| Recent Price: 18.37 Smart Investing & Trading Score: 64 | |
| Day Percent Change: 6.68% Day Change: 1.15 | |
| Week Change: 10.8% Year-to-date Change: 5.5% | |
| ATRO Links: Profile News Message Board | |
| Charts:- Daily , Weekly | |
| Add ATRO to Watchlist: View: Get Complete ATRO Trend Analysis ➞ | |
 | LNZA LanzaTech Global, Inc. |
| Sector: Industrials | |
| SubSector: Waste Management | |
| MarketCap: 1340 Millions | |
| Recent Price: 2.67 Smart Investing & Trading Score: 52 | |
| Day Percent Change: 6.18% Day Change: 0.16 | |
| Week Change: 19.78% Year-to-date Change: -46.1% | |
| LNZA Links: Profile News Message Board | |
| Charts:- Daily , Weekly | |
| Add LNZA to Watchlist: View: Get Complete LNZA Trend Analysis ➞ | |
 | LXFR Luxfer Holdings PLC |
| Sector: Industrials | |
| SubSector: Diversified Machinery | |
| MarketCap: 406.716 Millions | |
| Recent Price: 11.70 Smart Investing & Trading Score: 100 | |
| Day Percent Change: 5.69% Day Change: 0.63 | |
| Week Change: 20.25% Year-to-date Change: 30.9% | |
| LXFR Links: Profile News Message Board | |
| Charts:- Daily , Weekly | |
| Add LXFR to Watchlist: View: Get Complete LXFR Trend Analysis ➞ | |
 | FCEL FuelCell Energy, Inc. |
| Sector: Industrials | |
| SubSector: Industrial Electrical Equipment | |
| MarketCap: 347.079 Millions | |
| Recent Price: 0.90 Smart Investing & Trading Score: 30 | |
| Day Percent Change: 5.44% Day Change: 0.05 | |
| Week Change: 3.38% Year-to-date Change: -43.8% | |
| FCEL Links: Profile News Message Board | |
| Charts:- Daily , Weekly | |
| Add FCEL to Watchlist: View: Get Complete FCEL Trend Analysis ➞ | |
 | ASPN Aspen Aerogels, Inc. |
| Sector: Industrials | |
| SubSector: General Building Materials | |
| MarketCap: 150.153 Millions | |
| Recent Price: 25.11 Smart Investing & Trading Score: 100 | |
| Day Percent Change: 5.28% Day Change: 1.26 | |
| Week Change: 55.96% Year-to-date Change: 59.1% | |
| ASPN Links: Profile News Message Board | |
| Charts:- Daily , Weekly | |
| Add ASPN to Watchlist: View: Get Complete ASPN Trend Analysis ➞ | |
 | ERII Energy Recovery, Inc. |
| Sector: Industrials | |
| SubSector: Pollution & Treatment Controls | |
| MarketCap: 429.375 Millions | |
| Recent Price: 13.64 Smart Investing & Trading Score: 10 | |
| Day Percent Change: 4.60% Day Change: 0.60 | |
| Week Change: -3.94% Year-to-date Change: -27.6% | |
| ERII Links: Profile News Message Board | |
| Charts:- Daily , Weekly | |
| Add ERII to Watchlist: View: Get Complete ERII Trend Analysis ➞ | |
 | USLM United States Lime & Minerals, Inc. |
| Sector: Industrials | |
| SubSector: General Building Materials | |
| MarketCap: 427.653 Millions | |
| Recent Price: 340.19 Smart Investing & Trading Score: 100 | |
| Day Percent Change: 4.14% Day Change: 13.51 | |
| Week Change: 10.65% Year-to-date Change: 47.7% | |
| USLM Links: Profile News Message Board | |
| Charts:- Daily , Weekly | |
| Add USLM to Watchlist: View: Get Complete USLM Trend Analysis ➞ | |
 | KBH KB Home |
| Sector: Industrials | |
| SubSector: Residential Construction | |
| MarketCap: 1249.66 Millions | |
| Recent Price: 68.78 Smart Investing & Trading Score: 90 | |
| Day Percent Change: 4.04% Day Change: 2.67 | |
| Week Change: 4.85% Year-to-date Change: 10.1% | |
| KBH Links: Profile News Message Board | |
| Charts:- Daily , Weekly | |
| Add KBH to Watchlist: View: Get Complete KBH Trend Analysis ➞ | |
 | CRS Carpenter Technology Corporation |
| Sector: Industrials | |
| SubSector: Metal Fabrication | |
| MarketCap: 853.35 Millions | |
| Recent Price: 103.64 Smart Investing & Trading Score: 100 | |
| Day Percent Change: 3.74% Day Change: 3.74 | |
| Week Change: 23.38% Year-to-date Change: 46.4% | |
| CRS Links: Profile News Message Board | |
| Charts:- Daily , Weekly | |
| Add CRS to Watchlist: View: Get Complete CRS Trend Analysis ➞ | |
 | GVA Granite Construction Incorporated |
| Sector: Industrials | |
| SubSector: Heavy Construction | |
| MarketCap: 725.895 Millions | |
| Recent Price: 59.39 Smart Investing & Trading Score: 100 | |
| Day Percent Change: 3.72% Day Change: 2.13 | |
| Week Change: 6.95% Year-to-date Change: 16.8% | |
| GVA Links: Profile News Message Board | |
| Charts:- Daily , Weekly | |
| Add GVA to Watchlist: View: Get Complete GVA Trend Analysis ➞ | |
 | HLIO Helios Technologies, Inc. |
| Sector: Industrials | |
| SubSector: Diversified Machinery | |
| MarketCap: 1455.66 Millions | |
| Recent Price: 48.05 Smart Investing & Trading Score: 100 | |
| Day Percent Change: 3.62% Day Change: 1.68 | |
| Week Change: 5.44% Year-to-date Change: 6.0% | |
| HLIO Links: Profile News Message Board | |
| Charts:- Daily , Weekly | |
| Add HLIO to Watchlist: View: Get Complete HLIO Trend Analysis ➞ | |
 | RKLB Rocket Lab USA, Inc. |
| Sector: Industrials | |
| SubSector: Aerospace & Defense | |
| MarketCap: 2820 Millions | |
| Recent Price: 4.00 Smart Investing & Trading Score: 64 | |
| Day Percent Change: 3.62% Day Change: 0.14 | |
| Week Change: 6.37% Year-to-date Change: -27.3% | |
| RKLB Links: Profile News Message Board | |
| Charts:- Daily , Weekly | |
| Add RKLB to Watchlist: View: Get Complete RKLB Trend Analysis ➞ | |
 | RDW Redwire Corporation |
| Sector: Industrials | |
| SubSector: Aerospace & Defense | |
| MarketCap: 160 Millions | |
| Recent Price: 4.19 Smart Investing & Trading Score: 95 | |
| Day Percent Change: 3.46% Day Change: 0.14 | |
| Week Change: 5.81% Year-to-date Change: 47.0% | |
| RDW Links: Profile News Message Board | |
| Charts:- Daily , Weekly | |
| Add RDW to Watchlist: View: Get Complete RDW Trend Analysis ➞ | |
 | JOBY Joby Aviation, Inc. |
| Sector: Industrials | |
| SubSector: Airports & Air Services | |
| MarketCap: 5810 Millions | |
| Recent Price: 5.38 Smart Investing & Trading Score: 64 | |
| Day Percent Change: 3.46% Day Change: 0.18 | |
| Week Change: 0.56% Year-to-date Change: -19.0% | |
| JOBY Links: Profile News Message Board | |
| Charts:- Daily , Weekly | |
| Add JOBY to Watchlist: View: Get Complete JOBY Trend Analysis ➞ | |
| For tabular summary view of above stock list: Summary View ➞ 0 - 25 , 25 - 50 , 50 - 75 , 75 - 100 , 100 - 125 , 125 - 150 , 150 - 175 | ||
| Click To Change The Sort Order: By Market Cap or Company Size Performance: Year-to-date, Week and Day | |
| Select Chart Type: | ||
| Too many stocks? View smallcap stocks filtered by marketcap & sector |
| Marketcap: All SmallCap Stocks (default-no microcap), Large, Mid-Range, Small & MicroCap |
| Sector: Tech, Finance, Energy, Staples, Retail, Industrial, Materials, Utilities & Medical |
|
Best Stocks Today 12Stocks.com |
© 2024 12Stocks.com Terms & Conditions Privacy Contact Us
All Information Provided Only For Education And Not To Be Used For Investing or Trading. See Terms & Conditions


One More Thing ... Get Best Stocks Delivered Daily!
Never Ever Miss A Move With Our Top Ten Stocks Lists
Find Best Stocks In Any Market - Bull or Bear Market
Take A Peek At Our Top Ten Stocks Lists: Daily, Weekly, Year-to-Date & Top Trends
Find Best Stocks In Any Market - Bull or Bear Market
Take A Peek At Our Top Ten Stocks Lists: Daily, Weekly, Year-to-Date & Top Trends
Smallcap Stocks With Best Up Trends [0-bearish to 100-bullish]: Twist Bioscience[100], WideOpenWest [100], Joint [100], FTC Solar[100], Origin Materials[100], Alignment Healthcare[100], Clarus [100], IES [100], Emergent BioSolutions[100], Enovix [100], El Pollo[100]
Best Smallcap Stocks Year-to-Date:
Janux [482.74%], Viking [313.59%], Longboard [272.5%], Alpine Immune[239.29%], Bakkt [199.55%], Avidity Biosciences[192.48%], Vera [189.47%], Cullinan Oncology[176.9%], Super Micro[175.35%], Y-mAbs [151.47%], Sana [149.33%] Best Smallcap Stocks This Week:
Emergent BioSolutions[102.6%], Deciphera [73.24%], Origin Materials[66.52%], Eyenovia [60.78%], Cue Biopharma[56.04%], Aspen Aerogels[55.96%], Enovix [54.02%], Luna Innovations[53.77%], Codexis [47.37%], Carvana Co[44.31%], Office Properties[42.79%] Best Smallcap Stocks Daily:
Luna Innovations[36.00%], Twist Bioscience[28.74%], Ardelyx [28.42%], WideOpenWest [28.23%], 2U [26.63%], Joint [25.35%], FTC Solar[25.09%], Origin Materials[22.23%], Alignment Healthcare[21.97%], Clarus [18.67%], Aurora Innovation[18.09%]