
 Login Sign Up


| |||||
 |  | ||||

| 12Stocks.com Market Intelligence |
Best SmallCap Stocks
|
| In a hurry? Small Cap Stock Lists: Performance Trends Table, Stock Charts
Sort Small Cap stocks: Daily, Weekly, Year-to-Date, Market Cap & Trends. Filter Small Cap stocks list by sector: Show all, Tech, Finance, Energy, Staples, Retail, Industrial, Materials, Utilities and HealthCare Filter Small Cap stocks list by size: All Large Medium Small and MicroCap |
| 12Stocks.com Small Cap Stocks Performances & Trends Daily | |||||||||
|
|  The overall Smart Investing & Trading Score is 69 (0-bearish to 100-bullish) which puts Small Cap index in short term neutral to bullish trend. The Smart Investing & Trading Score from previous trading session is 49 and hence an improvement of trend.
| ||||||||
Here are the Smart Investing & Trading Scores of the most requested small cap stocks at 12Stocks.com (click stock name for detailed review):
|


| 12Stocks.com: Investing in Smallcap Index with Stocks | |
|
The following table helps investors and traders sort through current performance and trends (as measured by Smart Investing & Trading Score) of various
stocks in the Smallcap Index. Quick View: Move mouse or cursor over stock symbol (ticker) to view short-term technical chart and over stock name to view long term chart. Click on  to add stock symbol to your watchlist and to add stock symbol to your watchlist and  to view watchlist. Click on any ticker or stock name for detailed market intelligence report for that stock. to view watchlist. Click on any ticker or stock name for detailed market intelligence report for that stock. |
12Stocks.com Performance of Stocks in Smallcap Index
| Ticker | Stock Name | Watchlist | Category | Recent Price | Smart Investing & Trading Score | Change % | YTD Change% |
| ULCC | Frontier Group |   | Industrials | 5.92 | 27 | 0.34 | 9.02% |
| MWA | Mueller Water | | Industrials | 16.23 | 100 | 0.31 | 12.71% |
| OFLX | Omega Flex | | Industrials | 66.99 | 42 | 0.27 | -4.99% |
| ATI | Allegheny | | Industrials | 58.16 | 73 | 0.19 | 27.91% |
| FELE | Franklin Electric | | Industrials | 98.90 | 32 | 0.18 | 2.33% |
| RGR | Sturm Ruger | | Industrials | 46.92 | 95 | 0.15 | 3.23% |
| CWST | Casella Waste | | Industrials | 91.62 | 63 | 0.08 | 7.21% |
| HRT | HireRight | | Industrials | 14.33 | 75 | 0.07 | 6.54% |
| AIR | AAR | | Industrials | 69.92 | 83 | 0.04 | 12.05% |
| DOOR | Masonite | | Industrials | 132.70 | 78 | 0.00 | 56.74% |
| TRS | TriMas | | Industrials | 26.21 | 80 | -0.04 | 3.47% |
| GENC | Gencor Industries | | Industrials | 17.45 | 90 | -0.06 | 8.12% |
| APOG | Apogee Enterprises | | Industrials | 63.54 | 95 | -0.08 | 18.97% |
| MLI | Mueller Industries | | Industrials | 56.81 | 85 | -0.12 | 20.49% |
| OSIS | OSI Systems | | Industrials | 135.56 | 65 | -0.13 | 5.04% |
| PRLB | Proto Labs | | Industrials | 31.09 | 42 | -0.16 | -20.20% |
| RXO | RXO | | Industrials | 20.29 | 49 | -0.17 | -13.20% |
| CMPO | CompoSecure | | Industrials | 7.24 | 95 | -0.21 | 32.27% |
| TH | Target Hospitality | | Industrials | 11.20 | 95 | -0.27 | 15.11% |
| AGX | Argan | | Industrials | 60.84 | 78 | -0.29 | 30.03% |
| THR | Thermon Group | | Industrials | 32.74 | 90 | -0.30 | 0.52% |
| PRTH | Priority | | Industrials | 3.19 | 39 | -0.31 | -10.39% |
| MTW | Manitowoc | | Industrials | 12.43 | 32 | -0.32 | -25.52% |
| NPO | EnPro Industries | | Industrials | 152.00 | 39 | -0.33 | -3.02% |
| POWL | Powell Industries | | Industrials | 159.95 | 52 | -0.39 | 80.94% |
| For chart view version of above stock list: Chart View ➞ 0 - 25 , 25 - 50 , 50 - 75 , 75 - 100 , 100 - 125 , 125 - 150 , 150 - 175 | ||
 | Click To Change The Sort Order: By Market Cap or Company Size Performance: Year-to-date, Week and Day |  |
| Too many stocks? View smallcap stocks filtered by marketcap & sector |
| Marketcap: All SmallCap Stocks (default-no microcap), Large, Mid-Range, Small |
| Smallcap Sector: Tech, Finance, Energy, Staples, Retail, Industrial, Materials, & Medical |
|
Get the most comprehensive stock market coverage daily at 12Stocks.com ➞ Best Stocks Today ➞ Best Stocks Weekly ➞ Best Stocks Year-to-Date ➞ Best Stocks Trends ➞  Best Stocks Today 12Stocks.com Best Nasdaq Stocks ➞ Best S&P 500 Stocks ➞ Best Tech Stocks ➞ Best Biotech Stocks ➞ |
| Detailed Overview of SmallCap Stocks |
| SmallCap Technical Overview, Leaders & Laggards, Top SmallCap ETF Funds & Detailed SmallCap Stocks List, Charts, Trends & More |
| Smallcap: Technical Analysis, Trends & YTD Performance | |
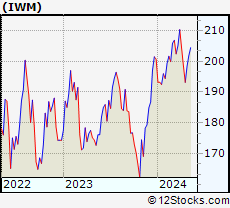
| SmallCap segment as represented by
IWM, an exchange-traded fund [ETF], holds basket of thousands of smallcap stocks from across all major sectors of the US stock market. The smallcap index (contains stocks like Riverbed & Sotheby's) is up by 0.59% and is currently underperforming the overall market by -6.29% year-to-date. Below is a quick view of technical charts and trends: | |
 IWM Weekly Chart |
|
| Long Term Trend: Not Good | |
| Medium Term Trend: Very Good | |
 IWM Daily Chart |
|
| Short Term Trend: Very Good | |
| Overall Trend Score: 69 | |
| YTD Performance: 0.59% | |
| **Trend Scores & Views Are Only For Educational Purposes And Not For Investing | |
| 12Stocks.com: Top Performing Small Cap Index Stocks | ||||||||||||||||||||||||||||||||||||||||||||||||
 The top performing Small Cap Index stocks year to date are
Now, more recently, over last week, the top performing Small Cap Index stocks on the move are


|
||||||||||||||||||||||||||||||||||||||||||||||||
| 12Stocks.com: Investing in Smallcap Index using Exchange Traded Funds | |
|
The following table shows list of key exchange traded funds (ETF) that
help investors track Smallcap index. The following list also includes leveraged ETF funds that track twice or thrice the daily returns of Smallcap indices. Short or inverse ETF funds move in the opposite direction to the index they track and are useful during market pullbacks or during bear markets. Quick View: Move mouse or cursor over ETF symbol (ticker) to view short-term technical chart and over ETF name to view long term chart. Click on ticker or stock name for detailed view. Click on to add stock symbol to your watchlist and to view watchlist. |
12Stocks.com List of ETFs that track Smallcap Index
| Ticker | ETF Name | Watchlist | Recent Price | Smart Investing & Trading Score | Change % | Week % | Year-to-date % |
| IWM | iShares Russell 2000 | | 201.90 | 69 | 0.99 | 1.77 | 0.59% |
| IJR | iShares Core S&P Small-Cap | | 107.13 | 82 | 0.75 | 1.4 | -1.03% |
| VTWO | Vanguard Russell 2000 ETF | | 81.61 | 69 | 0.94 | 1.73 | 0.63% |
| IWN | iShares Russell 2000 Value | | 154.21 | 100 | 0.87 | 2.03 | -0.72% |
| IJS | iShares S&P Small-Cap 600 Value | | 98.72 | 64 | 0.71 | 1.57 | -4.22% |
| IWO | iShares Russell 2000 Growth | | 256.87 | 57 | 0.99 | 1.49 | 1.84% |
| IJT | iShares S&P Small-Cap 600 Growth | | 127.76 | 95 | 0.82 | 1.32 | 2.09% |
| XSLV | PowerShares S&P SmallCap Low Volatil ETF | | 43.22 | 87 | 0.19 | 1.17 | -2.11% |
| SBB | ProShares Short SmallCap600 | | 16.16 | 13 | -1.28 | -1.37 | 1.44% |
| SDD | ProShares UltraShort SmallCap600 | | 18.84 | 23 | -2.41 | -2.61 | 2.27% |
| SAA | ProShares Ultra SmallCap600 | | 23.59 | 69 | 2.86 | 2.39 | -5.45% |
| SMLV | SPDR SSGA US Small Cap Low Volatil ETF | | 109.69 | 87 | 0.78 | 2.01 | -2.52% |
| 12Stocks.com: Charts, Trends, Fundamental Data and Performances of SmallCap Stocks | |
|
We now take in-depth look at all SmallCap stocks including charts, multi-period performances and overall trends (as measured by Smart Investing & Trading Score). One can sort SmallCap stocks (click link to choose) by Daily, Weekly and by Year-to-Date performances. Also, one can sort by size of the company or by market capitalization. |
| Select Your Default Chart Type: | |||||
| |||||
| Click on stock symbol or name for detailed view. Click on to add stock symbol to your watchlist and to view watchlist. Quick View: Move mouse or cursor over "Daily" to quickly view daily technical stock chart and over "Weekly" to view weekly technical stock chart. | |||||

 | ULCC Frontier Group Holdings, Inc. |
| Sector: Industrials | |
| SubSector: Airlines | |
| MarketCap: 2160 Millions | |
| Recent Price: 5.92 Smart Investing & Trading Score: 27 | |
| Day Percent Change: 0.34% Day Change: 0.02 | |
| Week Change: -3.27% Year-to-date Change: 9.0% | |
| ULCC Links: Profile News Message Board | |
| Charts:- Daily , Weekly | |
| Add ULCC to Watchlist: View: Get Complete ULCC Trend Analysis ➞ | |
 | MWA Mueller Water Products, Inc. |
| Sector: Industrials | |
| SubSector: Industrial Equipment & Components | |
| MarketCap: 1321.09 Millions | |
| Recent Price: 16.23 Smart Investing & Trading Score: 100 | |
| Day Percent Change: 0.31% Day Change: 0.05 | |
| Week Change: 1.56% Year-to-date Change: 12.7% | |
| MWA Links: Profile News Message Board | |
| Charts:- Daily , Weekly | |
| Add MWA to Watchlist: View: Get Complete MWA Trend Analysis ➞ | |
 | OFLX Omega Flex, Inc. |
| Sector: Industrials | |
| SubSector: Industrial Equipment & Components | |
| MarketCap: 590.609 Millions | |
| Recent Price: 66.99 Smart Investing & Trading Score: 42 | |
| Day Percent Change: 0.27% Day Change: 0.18 | |
| Week Change: 0.21% Year-to-date Change: -5.0% | |
| OFLX Links: Profile News Message Board | |
| Charts:- Daily , Weekly | |
| Add OFLX to Watchlist: View: Get Complete OFLX Trend Analysis ➞ | |
 | ATI Allegheny Technologies Incorporated |
| Sector: Industrials | |
| SubSector: Metal Fabrication | |
| MarketCap: 913.35 Millions | |
| Recent Price: 58.16 Smart Investing & Trading Score: 73 | |
| Day Percent Change: 0.19% Day Change: 0.11 | |
| Week Change: 12.39% Year-to-date Change: 27.9% | |
| ATI Links: Profile News Message Board | |
| Charts:- Daily , Weekly | |
| Add ATI to Watchlist: View: Get Complete ATI Trend Analysis ➞ | |
 | FELE Franklin Electric Co., Inc. |
| Sector: Industrials | |
| SubSector: Industrial Electrical Equipment | |
| MarketCap: 2397.89 Millions | |
| Recent Price: 98.90 Smart Investing & Trading Score: 32 | |
| Day Percent Change: 0.18% Day Change: 0.18 | |
| Week Change: -3.77% Year-to-date Change: 2.3% | |
| FELE Links: Profile News Message Board | |
| Charts:- Daily , Weekly | |
| Add FELE to Watchlist: View: Get Complete FELE Trend Analysis ➞ | |
 | RGR Sturm, Ruger & Company, Inc. |
| Sector: Industrials | |
| SubSector: Aerospace/Defense Products & Services | |
| MarketCap: 752 Millions | |
| Recent Price: 46.92 Smart Investing & Trading Score: 95 | |
| Day Percent Change: 0.15% Day Change: 0.07 | |
| Week Change: 0.97% Year-to-date Change: 3.2% | |
| RGR Links: Profile News Message Board | |
| Charts:- Daily , Weekly | |
| Add RGR to Watchlist: View: Get Complete RGR Trend Analysis ➞ | |
 | CWST Casella Waste Systems, Inc. |
| Sector: Industrials | |
| SubSector: Waste Management | |
| MarketCap: 2093.38 Millions | |
| Recent Price: 91.62 Smart Investing & Trading Score: 63 | |
| Day Percent Change: 0.08% Day Change: 0.07 | |
| Week Change: 1.73% Year-to-date Change: 7.2% | |
| CWST Links: Profile News Message Board | |
| Charts:- Daily , Weekly | |
| Add CWST to Watchlist: View: Get Complete CWST Trend Analysis ➞ | |
 | HRT HireRight Holdings Corporation |
| Sector: Industrials | |
| SubSector: Staffing & Employment Services | |
| MarketCap: 823 Millions | |
| Recent Price: 14.33 Smart Investing & Trading Score: 75 | |
| Day Percent Change: 0.07% Day Change: 0.01 | |
| Week Change: 0.28% Year-to-date Change: 6.5% | |
| HRT Links: Profile News Message Board | |
| Charts:- Daily , Weekly | |
| Add HRT to Watchlist: View: Get Complete HRT Trend Analysis ➞ | |
 | AIR AAR Corp. |
| Sector: Industrials | |
| SubSector: Aerospace/Defense Products & Services | |
| MarketCap: 591.701 Millions | |
| Recent Price: 69.92 Smart Investing & Trading Score: 83 | |
| Day Percent Change: 0.04% Day Change: 0.03 | |
| Week Change: 2.42% Year-to-date Change: 12.1% | |
| AIR Links: Profile News Message Board | |
| Charts:- Daily , Weekly | |
| Add AIR to Watchlist: View: Get Complete AIR Trend Analysis ➞ | |
 | DOOR Masonite International Corporation |
| Sector: Industrials | |
| SubSector: General Building Materials | |
| MarketCap: 1220.53 Millions | |
| Recent Price: 132.70 Smart Investing & Trading Score: 78 | |
| Day Percent Change: 0.00% Day Change: 0.00 | |
| Week Change: 0.83% Year-to-date Change: 56.7% | |
| DOOR Links: Profile News Message Board | |
| Charts:- Daily , Weekly | |
| Add DOOR to Watchlist: View: Get Complete DOOR Trend Analysis ➞ | |
 | TRS TriMas Corporation |
| Sector: Industrials | |
| SubSector: Industrial Equipment & Components | |
| MarketCap: 963.509 Millions | |
| Recent Price: 26.21 Smart Investing & Trading Score: 80 | |
| Day Percent Change: -0.04% Day Change: -0.01 | |
| Week Change: -1.02% Year-to-date Change: 3.5% | |
| TRS Links: Profile News Message Board | |
| Charts:- Daily , Weekly | |
| Add TRS to Watchlist: View: Get Complete TRS Trend Analysis ➞ | |
 | GENC Gencor Industries, Inc. |
| Sector: Industrials | |
| SubSector: Farm & Construction Machinery | |
| MarketCap: 147.607 Millions | |
| Recent Price: 17.45 Smart Investing & Trading Score: 90 | |
| Day Percent Change: -0.06% Day Change: -0.01 | |
| Week Change: 2.83% Year-to-date Change: 8.1% | |
| GENC Links: Profile News Message Board | |
| Charts:- Daily , Weekly | |
| Add GENC to Watchlist: View: Get Complete GENC Trend Analysis ➞ | |
 | APOG Apogee Enterprises, Inc. |
| Sector: Industrials | |
| SubSector: General Building Materials | |
| MarketCap: 510.653 Millions | |
| Recent Price: 63.54 Smart Investing & Trading Score: 95 | |
| Day Percent Change: -0.08% Day Change: -0.05 | |
| Week Change: 2.4% Year-to-date Change: 19.0% | |
| APOG Links: Profile News Message Board | |
| Charts:- Daily , Weekly | |
| Add APOG to Watchlist: View: Get Complete APOG Trend Analysis ➞ | |
 | MLI Mueller Industries, Inc. |
| Sector: Industrials | |
| SubSector: Metal Fabrication | |
| MarketCap: 1259.5 Millions | |
| Recent Price: 56.81 Smart Investing & Trading Score: 85 | |
| Day Percent Change: -0.12% Day Change: -0.07 | |
| Week Change: -0.91% Year-to-date Change: 20.5% | |
| MLI Links: Profile News Message Board | |
| Charts:- Daily , Weekly | |
| Add MLI to Watchlist: View: Get Complete MLI Trend Analysis ➞ | |
 | OSIS OSI Systems, Inc. |
| Sector: Industrials | |
| SubSector: Industrial Electrical Equipment | |
| MarketCap: 1100.39 Millions | |
| Recent Price: 135.56 Smart Investing & Trading Score: 65 | |
| Day Percent Change: -0.13% Day Change: -0.18 | |
| Week Change: 0.55% Year-to-date Change: 5.0% | |
| OSIS Links: Profile News Message Board | |
| Charts:- Daily , Weekly | |
| Add OSIS to Watchlist: View: Get Complete OSIS Trend Analysis ➞ | |
 | PRLB Proto Labs, Inc. |
| Sector: Industrials | |
| SubSector: Machine Tools & Accessories | |
| MarketCap: 1944.78 Millions | |
| Recent Price: 31.09 Smart Investing & Trading Score: 42 | |
| Day Percent Change: -0.16% Day Change: -0.05 | |
| Week Change: -0.89% Year-to-date Change: -20.2% | |
| PRLB Links: Profile News Message Board | |
| Charts:- Daily , Weekly | |
| Add PRLB to Watchlist: View: Get Complete PRLB Trend Analysis ➞ | |
 | RXO RXO, Inc. |
| Sector: Industrials | |
| SubSector: Trucking | |
| MarketCap: 2550 Millions | |
| Recent Price: 20.29 Smart Investing & Trading Score: 49 | |
| Day Percent Change: -0.17% Day Change: -0.04 | |
| Week Change: 4.78% Year-to-date Change: -13.2% | |
| RXO Links: Profile News Message Board | |
| Charts:- Daily , Weekly | |
| Add RXO to Watchlist: View: Get Complete RXO Trend Analysis ➞ | |
 | CMPO CompoSecure, Inc. |
| Sector: Industrials | |
| SubSector: Metal Fabrication | |
| MarketCap: 535 Millions | |
| Recent Price: 7.24 Smart Investing & Trading Score: 95 | |
| Day Percent Change: -0.21% Day Change: -0.01 | |
| Week Change: 3.8% Year-to-date Change: 32.3% | |
| CMPO Links: Profile News Message Board | |
| Charts:- Daily , Weekly | |
| Add CMPO to Watchlist: View: Get Complete CMPO Trend Analysis ➞ | |
 | TH Target Hospitality Corp. |
| Sector: Industrials | |
| SubSector: Conglomerates | |
| MarketCap: 218.048 Millions | |
| Recent Price: 11.20 Smart Investing & Trading Score: 95 | |
| Day Percent Change: -0.27% Day Change: -0.03 | |
| Week Change: 0.72% Year-to-date Change: 15.1% | |
| TH Links: Profile News Message Board | |
| Charts:- Daily , Weekly | |
| Add TH to Watchlist: View: Get Complete TH Trend Analysis ➞ | |
 | AGX Argan, Inc. |
| Sector: Industrials | |
| SubSector: Heavy Construction | |
| MarketCap: 664.095 Millions | |
| Recent Price: 60.84 Smart Investing & Trading Score: 78 | |
| Day Percent Change: -0.29% Day Change: -0.18 | |
| Week Change: -1.84% Year-to-date Change: 30.0% | |
| AGX Links: Profile News Message Board | |
| Charts:- Daily , Weekly | |
| Add AGX to Watchlist: View: Get Complete AGX Trend Analysis ➞ | |
 | THR Thermon Group Holdings, Inc. |
| Sector: Industrials | |
| SubSector: Diversified Machinery | |
| MarketCap: 492.816 Millions | |
| Recent Price: 32.74 Smart Investing & Trading Score: 90 | |
| Day Percent Change: -0.30% Day Change: -0.10 | |
| Week Change: 2.86% Year-to-date Change: 0.5% | |
| THR Links: Profile News Message Board | |
| Charts:- Daily , Weekly | |
| Add THR to Watchlist: View: Get Complete THR Trend Analysis ➞ | |
 | PRTH Priority Technology Holdings, Inc. |
| Sector: Industrials | |
| SubSector: Conglomerates | |
| MarketCap: 116.548 Millions | |
| Recent Price: 3.19 Smart Investing & Trading Score: 39 | |
| Day Percent Change: -0.31% Day Change: -0.01 | |
| Week Change: 0.79% Year-to-date Change: -10.4% | |
| PRTH Links: Profile News Message Board | |
| Charts:- Daily , Weekly | |
| Add PRTH to Watchlist: View: Get Complete PRTH Trend Analysis ➞ | |
 | MTW The Manitowoc Company, Inc. |
| Sector: Industrials | |
| SubSector: Farm & Construction Machinery | |
| MarketCap: 373.707 Millions | |
| Recent Price: 12.43 Smart Investing & Trading Score: 32 | |
| Day Percent Change: -0.32% Day Change: -0.04 | |
| Week Change: -1.66% Year-to-date Change: -25.5% | |
| MTW Links: Profile News Message Board | |
| Charts:- Daily , Weekly | |
| Add MTW to Watchlist: View: Get Complete MTW Trend Analysis ➞ | |
 | NPO EnPro Industries, Inc. |
| Sector: Industrials | |
| SubSector: Industrial Equipment & Components | |
| MarketCap: 734.309 Millions | |
| Recent Price: 152.00 Smart Investing & Trading Score: 39 | |
| Day Percent Change: -0.33% Day Change: -0.50 | |
| Week Change: 0.9% Year-to-date Change: -3.0% | |
| NPO Links: Profile News Message Board | |
| Charts:- Daily , Weekly | |
| Add NPO to Watchlist: View: Get Complete NPO Trend Analysis ➞ | |
 | POWL Powell Industries, Inc. |
| Sector: Industrials | |
| SubSector: Diversified Machinery | |
| MarketCap: 257.216 Millions | |
| Recent Price: 159.95 Smart Investing & Trading Score: 52 | |
| Day Percent Change: -0.39% Day Change: -0.63 | |
| Week Change: 7.48% Year-to-date Change: 80.9% | |
| POWL Links: Profile News Message Board | |
| Charts:- Daily , Weekly | |
| Add POWL to Watchlist: View: Get Complete POWL Trend Analysis ➞ | |
| For tabular summary view of above stock list: Summary View ➞ 0 - 25 , 25 - 50 , 50 - 75 , 75 - 100 , 100 - 125 , 125 - 150 , 150 - 175 | ||
| Click To Change The Sort Order: By Market Cap or Company Size Performance: Year-to-date, Week and Day | |
| Select Chart Type: | ||
| Too many stocks? View smallcap stocks filtered by marketcap & sector |
| Marketcap: All SmallCap Stocks (default-no microcap), Large, Mid-Range, Small & MicroCap |
| Sector: Tech, Finance, Energy, Staples, Retail, Industrial, Materials, Utilities & Medical |
|
Best Stocks Today 12Stocks.com |
© 2024 12Stocks.com Terms & Conditions Privacy Contact Us
All Information Provided Only For Education And Not To Be Used For Investing or Trading. See Terms & Conditions


One More Thing ... Get Best Stocks Delivered Daily!
Never Ever Miss A Move With Our Top Ten Stocks Lists
Find Best Stocks In Any Market - Bull or Bear Market
Take A Peek At Our Top Ten Stocks Lists: Daily, Weekly, Year-to-Date & Top Trends
Find Best Stocks In Any Market - Bull or Bear Market
Take A Peek At Our Top Ten Stocks Lists: Daily, Weekly, Year-to-Date & Top Trends
Smallcap Stocks With Best Up Trends [0-bearish to 100-bullish]: Twist Bioscience[100], WideOpenWest [100], Joint [100], FTC Solar[100], Origin Materials[100], Alignment Healthcare[100], Clarus [100], IES [100], Emergent BioSolutions[100], Enovix [100], El Pollo[100]
Best Smallcap Stocks Year-to-Date:
Janux [482.74%], Viking [313.59%], Longboard [272.5%], Alpine Immune[239.29%], Bakkt [199.55%], Avidity Biosciences[192.48%], Vera [189.47%], Cullinan Oncology[176.9%], Super Micro[175.35%], Y-mAbs [151.47%], Sana [149.33%] Best Smallcap Stocks This Week:
Emergent BioSolutions[102.6%], Deciphera [73.24%], Origin Materials[66.52%], Eyenovia [60.78%], Cue Biopharma[56.04%], Aspen Aerogels[55.96%], Enovix [54.02%], Luna Innovations[53.77%], Codexis [47.37%], Carvana Co[44.31%], Office Properties[42.79%] Best Smallcap Stocks Daily:
Luna Innovations[36.00%], Twist Bioscience[28.74%], Ardelyx [28.42%], WideOpenWest [28.23%], 2U [26.63%], Joint [25.35%], FTC Solar[25.09%], Origin Materials[22.23%], Alignment Healthcare[21.97%], Clarus [18.67%], Aurora Innovation[18.09%]