
 Login Sign Up


| |||||
 |  | ||||

| 12Stocks.com Market Intelligence |
Best SmallCap Stocks
|
| In a hurry? Small Cap Stock Lists: Performance Trends Table, Stock Charts
Sort Small Cap stocks: Daily, Weekly, Year-to-Date, Market Cap & Trends. Filter Small Cap stocks list by sector: Show all, Tech, Finance, Energy, Staples, Retail, Industrial, Materials, Utilities and HealthCare Filter Small Cap stocks list by size: All Large Medium Small and MicroCap |
| 12Stocks.com Small Cap Stocks Performances & Trends Daily | |||||||||
|
|  The overall Smart Investing & Trading Score is 69 (0-bearish to 100-bullish) which puts Small Cap index in short term neutral to bullish trend. The Smart Investing & Trading Score from previous trading session is 49 and hence an improvement of trend.
| ||||||||
Here are the Smart Investing & Trading Scores of the most requested small cap stocks at 12Stocks.com (click stock name for detailed review):
|


| 12Stocks.com: Investing in Smallcap Index with Stocks | |
|
The following table helps investors and traders sort through current performance and trends (as measured by Smart Investing & Trading Score) of various
stocks in the Smallcap Index. Quick View: Move mouse or cursor over stock symbol (ticker) to view short-term technical chart and over stock name to view long term chart. Click on  to add stock symbol to your watchlist and to add stock symbol to your watchlist and  to view watchlist. Click on any ticker or stock name for detailed market intelligence report for that stock. to view watchlist. Click on any ticker or stock name for detailed market intelligence report for that stock. |
12Stocks.com Performance of Stocks in Smallcap Index
| Ticker | Stock Name | Watchlist | Category | Recent Price | Smart Investing & Trading Score | Change % | YTD Change% |
| BWMN | Bowman Consulting |   | Industrials | 31.01 | 22 | 1.79 | -11.93% |
| TMHC | Taylor Morrison | | Industrials | 57.20 | 73 | 1.69 | 7.22% |
| CCS | Century Communities | | Industrials | 83.27 | 49 | 1.66 | -8.64% |
| NX | Quanex Building | | Industrials | 34.78 | 45 | 1.64 | 13.77% |
| CODI | Compass Diversified | | Industrials | 21.68 | 10 | 1.64 | -3.43% |
| SNCY | Sun Country | | Industrials | 13.86 | 42 | 1.61 | -12.36% |
| SSD | Simpson | | Industrials | 181.05 | 42 | 1.59 | -8.55% |
| KMT | Kennametal | | Industrials | 24.54 | 67 | 1.57 | -4.85% |
| TEX | Terex | | Industrials | 58.35 | 58 | 1.55 | 1.55% |
| DCO | Ducommun | | Industrials | 55.90 | 100 | 1.51 | 7.38% |
| PSN | Parsons | | Industrials | 78.47 | 25 | 1.51 | 25.13% |
| PCH | PotlatchDeltic | | Industrials | 42.00 | 42 | 1.42 | -14.46% |
| CVCO | Cavco Industries | | Industrials | 377.30 | 73 | 1.42 | 8.85% |
| LEGH | Legacy Housing | | Industrials | 21.27 | 64 | 1.38 | -15.66% |
| BBCP | Concrete Pumping | | Industrials | 6.77 | 49 | 1.35 | -17.44% |
| HI | Hillenbrand | | Industrials | 42.44 | 7 | 1.31 | -11.31% |
| SMR | NuScale Power | | Industrials | 6.05 | 83 | 1.26 | 87.60% |
| WTTR | Select Energy | | Industrials | 9.16 | 54 | 1.22 | 20.69% |
| AIN | Albany | | Industrials | 84.67 | 32 | 1.21 | -13.80% |
| CMCO | Columbus McKinnon | | Industrials | 42.56 | 85 | 1.21 | 9.07% |
| BCC | Boise Cascade | | Industrials | 136.05 | 45 | 1.17 | 5.17% |
| AZZ | AZZ | | Industrials | 75.02 | 63 | 1.08 | 29.14% |
| EVEX | Eve Holding | | Industrials | 5.42 | 62 | 1.03 | -26.43% |
| ENS | EnerSys | | Industrials | 93.28 | 90 | 1.00 | -7.61% |
| UFPI | Universal Forest | | Industrials | 116.65 | 90 | 1.00 | -7.09% |
| For chart view version of above stock list: Chart View ➞ 0 - 25 , 25 - 50 , 50 - 75 , 75 - 100 , 100 - 125 , 125 - 150 , 150 - 175 | ||
 | Click To Change The Sort Order: By Market Cap or Company Size Performance: Year-to-date, Week and Day |  |
| Too many stocks? View smallcap stocks filtered by marketcap & sector |
| Marketcap: All SmallCap Stocks (default-no microcap), Large, Mid-Range, Small |
| Smallcap Sector: Tech, Finance, Energy, Staples, Retail, Industrial, Materials, & Medical |
|
Get the most comprehensive stock market coverage daily at 12Stocks.com ➞ Best Stocks Today ➞ Best Stocks Weekly ➞ Best Stocks Year-to-Date ➞ Best Stocks Trends ➞  Best Stocks Today 12Stocks.com Best Nasdaq Stocks ➞ Best S&P 500 Stocks ➞ Best Tech Stocks ➞ Best Biotech Stocks ➞ |
| Detailed Overview of SmallCap Stocks |
| SmallCap Technical Overview, Leaders & Laggards, Top SmallCap ETF Funds & Detailed SmallCap Stocks List, Charts, Trends & More |
| Smallcap: Technical Analysis, Trends & YTD Performance | |
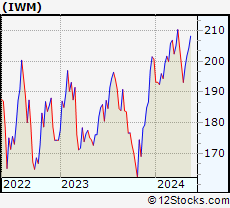
| SmallCap segment as represented by
IWM, an exchange-traded fund [ETF], holds basket of thousands of smallcap stocks from across all major sectors of the US stock market. The smallcap index (contains stocks like Riverbed & Sotheby's) is up by 0.59% and is currently underperforming the overall market by -6.29% year-to-date. Below is a quick view of technical charts and trends: | |
 IWM Weekly Chart |
|
| Long Term Trend: Not Good | |
| Medium Term Trend: Very Good | |
 IWM Daily Chart |
|
| Short Term Trend: Very Good | |
| Overall Trend Score: 69 | |
| YTD Performance: 0.59% | |
| **Trend Scores & Views Are Only For Educational Purposes And Not For Investing | |
| 12Stocks.com: Top Performing Small Cap Index Stocks | ||||||||||||||||||||||||||||||||||||||||||||||||
 The top performing Small Cap Index stocks year to date are
Now, more recently, over last week, the top performing Small Cap Index stocks on the move are


|
||||||||||||||||||||||||||||||||||||||||||||||||
| 12Stocks.com: Investing in Smallcap Index using Exchange Traded Funds | |
|
The following table shows list of key exchange traded funds (ETF) that
help investors track Smallcap index. The following list also includes leveraged ETF funds that track twice or thrice the daily returns of Smallcap indices. Short or inverse ETF funds move in the opposite direction to the index they track and are useful during market pullbacks or during bear markets. Quick View: Move mouse or cursor over ETF symbol (ticker) to view short-term technical chart and over ETF name to view long term chart. Click on ticker or stock name for detailed view. Click on to add stock symbol to your watchlist and to view watchlist. |
12Stocks.com List of ETFs that track Smallcap Index
| Ticker | ETF Name | Watchlist | Recent Price | Smart Investing & Trading Score | Change % | Week % | Year-to-date % |
| IWM | iShares Russell 2000 | | 201.90 | 69 | 0.99 | 1.77 | 0.59% |
| IJR | iShares Core S&P Small-Cap | | 107.13 | 82 | 0.75 | 1.4 | -1.03% |
| VTWO | Vanguard Russell 2000 ETF | | 81.61 | 69 | 0.94 | 1.73 | 0.63% |
| IWN | iShares Russell 2000 Value | | 154.21 | 100 | 0.87 | 2.03 | -0.72% |
| IJS | iShares S&P Small-Cap 600 Value | | 98.72 | 64 | 0.71 | 1.57 | -4.22% |
| IWO | iShares Russell 2000 Growth | | 256.87 | 57 | 0.99 | 1.49 | 1.84% |
| IJT | iShares S&P Small-Cap 600 Growth | | 127.76 | 95 | 0.82 | 1.32 | 2.09% |
| XSLV | PowerShares S&P SmallCap Low Volatil ETF | | 43.22 | 87 | 0.19 | 1.17 | -2.11% |
| SBB | ProShares Short SmallCap600 | | 16.16 | 13 | -1.28 | -1.37 | 1.44% |
| SDD | ProShares UltraShort SmallCap600 | | 18.84 | 23 | -2.41 | -2.61 | 2.27% |
| SAA | ProShares Ultra SmallCap600 | | 23.59 | 69 | 2.86 | 2.39 | -5.45% |
| SMLV | SPDR SSGA US Small Cap Low Volatil ETF | | 109.69 | 87 | 0.78 | 2.01 | -2.52% |
| 12Stocks.com: Charts, Trends, Fundamental Data and Performances of SmallCap Stocks | |
|
We now take in-depth look at all SmallCap stocks including charts, multi-period performances and overall trends (as measured by Smart Investing & Trading Score). One can sort SmallCap stocks (click link to choose) by Daily, Weekly and by Year-to-Date performances. Also, one can sort by size of the company or by market capitalization. |
| Select Your Default Chart Type: | |||||
| |||||
| Click on stock symbol or name for detailed view. Click on to add stock symbol to your watchlist and to view watchlist. Quick View: Move mouse or cursor over "Daily" to quickly view daily technical stock chart and over "Weekly" to view weekly technical stock chart. | |||||

 | BWMN Bowman Consulting Group Ltd. |
| Sector: Industrials | |
| SubSector: Engineering & Construction | |
| MarketCap: 443 Millions | |
| Recent Price: 31.01 Smart Investing & Trading Score: 22 | |
| Day Percent Change: 1.79% Day Change: 0.55 | |
| Week Change: -5.89% Year-to-date Change: -11.9% | |
| BWMN Links: Profile News Message Board | |
| Charts:- Daily , Weekly | |
| Add BWMN to Watchlist: View: Get Complete BWMN Trend Analysis ➞ | |
 | TMHC Taylor Morrison Home Corporation |
| Sector: Industrials | |
| SubSector: Residential Construction | |
| MarketCap: 1336.76 Millions | |
| Recent Price: 57.20 Smart Investing & Trading Score: 73 | |
| Day Percent Change: 1.69% Day Change: 0.95 | |
| Week Change: -0.63% Year-to-date Change: 7.2% | |
| TMHC Links: Profile News Message Board | |
| Charts:- Daily , Weekly | |
| Add TMHC to Watchlist: View: Get Complete TMHC Trend Analysis ➞ | |
 | CCS Century Communities, Inc. |
| Sector: Industrials | |
| SubSector: Residential Construction | |
| MarketCap: 459.206 Millions | |
| Recent Price: 83.27 Smart Investing & Trading Score: 49 | |
| Day Percent Change: 1.66% Day Change: 1.36 | |
| Week Change: 5.65% Year-to-date Change: -8.6% | |
| CCS Links: Profile News Message Board | |
| Charts:- Daily , Weekly | |
| Add CCS to Watchlist: View: Get Complete CCS Trend Analysis ➞ | |
 | NX Quanex Building Products Corporation |
| Sector: Industrials | |
| SubSector: General Building Materials | |
| MarketCap: 315.453 Millions | |
| Recent Price: 34.78 Smart Investing & Trading Score: 45 | |
| Day Percent Change: 1.64% Day Change: 0.56 | |
| Week Change: 2.87% Year-to-date Change: 13.8% | |
| NX Links: Profile News Message Board | |
| Charts:- Daily , Weekly | |
| Add NX to Watchlist: View: Get Complete NX Trend Analysis ➞ | |
 | CODI Compass Diversified Holdings LLC |
| Sector: Industrials | |
| SubSector: Conglomerates | |
| MarketCap: 803.348 Millions | |
| Recent Price: 21.68 Smart Investing & Trading Score: 10 | |
| Day Percent Change: 1.64% Day Change: 0.35 | |
| Week Change: -4.16% Year-to-date Change: -3.4% | |
| CODI Links: Profile News Message Board | |
| Charts:- Daily , Weekly | |
| Add CODI to Watchlist: View: Get Complete CODI Trend Analysis ➞ | |
 | SNCY Sun Country Airlines Holdings, Inc. |
| Sector: Industrials | |
| SubSector: Airlines | |
| MarketCap: 1230 Millions | |
| Recent Price: 13.86 Smart Investing & Trading Score: 42 | |
| Day Percent Change: 1.61% Day Change: 0.22 | |
| Week Change: 1.46% Year-to-date Change: -12.4% | |
| SNCY Links: Profile News Message Board | |
| Charts:- Daily , Weekly | |
| Add SNCY to Watchlist: View: Get Complete SNCY Trend Analysis ➞ | |
 | SSD Simpson Manufacturing Co., Inc. |
| Sector: Industrials | |
| SubSector: Small Tools & Accessories | |
| MarketCap: 2850.16 Millions | |
| Recent Price: 181.05 Smart Investing & Trading Score: 42 | |
| Day Percent Change: 1.59% Day Change: 2.84 | |
| Week Change: 4.29% Year-to-date Change: -8.6% | |
| SSD Links: Profile News Message Board | |
| Charts:- Daily , Weekly | |
| Add SSD to Watchlist: View: Get Complete SSD Trend Analysis ➞ | |
 | KMT Kennametal Inc. |
| Sector: Industrials | |
| SubSector: Machine Tools & Accessories | |
| MarketCap: 1486.48 Millions | |
| Recent Price: 24.54 Smart Investing & Trading Score: 67 | |
| Day Percent Change: 1.57% Day Change: 0.38 | |
| Week Change: 2.08% Year-to-date Change: -4.9% | |
| KMT Links: Profile News Message Board | |
| Charts:- Daily , Weekly | |
| Add KMT to Watchlist: View: Get Complete KMT Trend Analysis ➞ | |
 | TEX Terex Corporation |
| Sector: Industrials | |
| SubSector: Farm & Construction Machinery | |
| MarketCap: 1083.07 Millions | |
| Recent Price: 58.35 Smart Investing & Trading Score: 58 | |
| Day Percent Change: 1.55% Day Change: 0.89 | |
| Week Change: -2.08% Year-to-date Change: 1.6% | |
| TEX Links: Profile News Message Board | |
| Charts:- Daily , Weekly | |
| Add TEX to Watchlist: View: Get Complete TEX Trend Analysis ➞ | |
 | DCO Ducommun Incorporated |
| Sector: Industrials | |
| SubSector: Aerospace/Defense Products & Services | |
| MarketCap: 261.101 Millions | |
| Recent Price: 55.90 Smart Investing & Trading Score: 100 | |
| Day Percent Change: 1.51% Day Change: 0.83 | |
| Week Change: 3.63% Year-to-date Change: 7.4% | |
| DCO Links: Profile News Message Board | |
| Charts:- Daily , Weekly | |
| Add DCO to Watchlist: View: Get Complete DCO Trend Analysis ➞ | |
 | PSN Parsons Corporation |
| Sector: Industrials | |
| SubSector: Diversified Machinery | |
| MarketCap: 3021.16 Millions | |
| Recent Price: 78.47 Smart Investing & Trading Score: 25 | |
| Day Percent Change: 1.51% Day Change: 1.17 | |
| Week Change: -1.58% Year-to-date Change: 25.1% | |
| PSN Links: Profile News Message Board | |
| Charts:- Daily , Weekly | |
| Add PSN to Watchlist: View: Get Complete PSN Trend Analysis ➞ | |
 | PCH PotlatchDeltic Corporation |
| Sector: Industrials | |
| SubSector: Lumber, Wood Production | |
| MarketCap: 2314.68 Millions | |
| Recent Price: 42.00 Smart Investing & Trading Score: 42 | |
| Day Percent Change: 1.42% Day Change: 0.59 | |
| Week Change: 2.31% Year-to-date Change: -14.5% | |
| PCH Links: Profile News Message Board | |
| Charts:- Daily , Weekly | |
| Add PCH to Watchlist: View: Get Complete PCH Trend Analysis ➞ | |
 | CVCO Cavco Industries, Inc. |
| Sector: Industrials | |
| SubSector: Residential Construction | |
| MarketCap: 1375.86 Millions | |
| Recent Price: 377.30 Smart Investing & Trading Score: 73 | |
| Day Percent Change: 1.42% Day Change: 5.28 | |
| Week Change: 1.26% Year-to-date Change: 8.9% | |
| CVCO Links: Profile News Message Board | |
| Charts:- Daily , Weekly | |
| Add CVCO to Watchlist: View: Get Complete CVCO Trend Analysis ➞ | |
 | LEGH Legacy Housing Corporation |
| Sector: Industrials | |
| SubSector: Residential Construction | |
| MarketCap: 298.006 Millions | |
| Recent Price: 21.27 Smart Investing & Trading Score: 64 | |
| Day Percent Change: 1.38% Day Change: 0.29 | |
| Week Change: 4.78% Year-to-date Change: -15.7% | |
| LEGH Links: Profile News Message Board | |
| Charts:- Daily , Weekly | |
| Add LEGH to Watchlist: View: Get Complete LEGH Trend Analysis ➞ | |
 | BBCP Concrete Pumping Holdings, Inc. |
| Sector: Industrials | |
| SubSector: General Building Materials | |
| MarketCap: 263.653 Millions | |
| Recent Price: 6.77 Smart Investing & Trading Score: 49 | |
| Day Percent Change: 1.35% Day Change: 0.09 | |
| Week Change: -0.59% Year-to-date Change: -17.4% | |
| BBCP Links: Profile News Message Board | |
| Charts:- Daily , Weekly | |
| Add BBCP to Watchlist: View: Get Complete BBCP Trend Analysis ➞ | |
 | HI Hillenbrand, Inc. |
| Sector: Industrials | |
| SubSector: Diversified Machinery | |
| MarketCap: 1389.86 Millions | |
| Recent Price: 42.44 Smart Investing & Trading Score: 7 | |
| Day Percent Change: 1.31% Day Change: 0.55 | |
| Week Change: -14.11% Year-to-date Change: -11.3% | |
| HI Links: Profile News Message Board | |
| Charts:- Daily , Weekly | |
| Add HI to Watchlist: View: Get Complete HI Trend Analysis ➞ | |
 | SMR NuScale Power Corporation |
| Sector: Industrials | |
| SubSector: Specialty Industrial Machinery | |
| MarketCap: 1510 Millions | |
| Recent Price: 6.05 Smart Investing & Trading Score: 83 | |
| Day Percent Change: 1.26% Day Change: 0.08 | |
| Week Change: -0.17% Year-to-date Change: 87.6% | |
| SMR Links: Profile News Message Board | |
| Charts:- Daily , Weekly | |
| Add SMR to Watchlist: View: Get Complete SMR Trend Analysis ➞ | |
 | WTTR Select Energy Services, Inc. |
| Sector: Industrials | |
| SubSector: Pollution & Treatment Controls | |
| MarketCap: 347.075 Millions | |
| Recent Price: 9.16 Smart Investing & Trading Score: 54 | |
| Day Percent Change: 1.22% Day Change: 0.11 | |
| Week Change: -3.38% Year-to-date Change: 20.7% | |
| WTTR Links: Profile News Message Board | |
| Charts:- Daily , Weekly | |
| Add WTTR to Watchlist: View: Get Complete WTTR Trend Analysis ➞ | |
 | AIN Albany International Corp. |
| Sector: Industrials | |
| SubSector: Textile Industrial | |
| MarketCap: 1538.4 Millions | |
| Recent Price: 84.67 Smart Investing & Trading Score: 32 | |
| Day Percent Change: 1.21% Day Change: 1.01 | |
| Week Change: -3.43% Year-to-date Change: -13.8% | |
| AIN Links: Profile News Message Board | |
| Charts:- Daily , Weekly | |
| Add AIN to Watchlist: View: Get Complete AIN Trend Analysis ➞ | |
 | CMCO Columbus McKinnon Corporation |
| Sector: Industrials | |
| SubSector: Farm & Construction Machinery | |
| MarketCap: 598.807 Millions | |
| Recent Price: 42.56 Smart Investing & Trading Score: 85 | |
| Day Percent Change: 1.21% Day Change: 0.51 | |
| Week Change: 1.5% Year-to-date Change: 9.1% | |
| CMCO Links: Profile News Message Board | |
| Charts:- Daily , Weekly | |
| Add CMCO to Watchlist: View: Get Complete CMCO Trend Analysis ➞ | |
 | BCC Boise Cascade Company |
| Sector: Industrials | |
| SubSector: Lumber, Wood Production | |
| MarketCap: 963.938 Millions | |
| Recent Price: 136.05 Smart Investing & Trading Score: 45 | |
| Day Percent Change: 1.17% Day Change: 1.57 | |
| Week Change: -2.42% Year-to-date Change: 5.2% | |
| BCC Links: Profile News Message Board | |
| Charts:- Daily , Weekly | |
| Add BCC to Watchlist: View: Get Complete BCC Trend Analysis ➞ | |
 | AZZ AZZ Inc. |
| Sector: Industrials | |
| SubSector: Diversified Machinery | |
| MarketCap: 743.416 Millions | |
| Recent Price: 75.02 Smart Investing & Trading Score: 63 | |
| Day Percent Change: 1.08% Day Change: 0.80 | |
| Week Change: 4.94% Year-to-date Change: 29.1% | |
| AZZ Links: Profile News Message Board | |
| Charts:- Daily , Weekly | |
| Add AZZ to Watchlist: View: Get Complete AZZ Trend Analysis ➞ | |
 | EVEX Eve Holding, Inc. |
| Sector: Industrials | |
| SubSector: Aerospace & Defense | |
| MarketCap: 2830 Millions | |
| Recent Price: 5.42 Smart Investing & Trading Score: 62 | |
| Day Percent Change: 1.03% Day Change: 0.05 | |
| Week Change: 1.03% Year-to-date Change: -26.4% | |
| EVEX Links: Profile News Message Board | |
| Charts:- Daily , Weekly | |
| Add EVEX to Watchlist: View: Get Complete EVEX Trend Analysis ➞ | |
 | ENS EnerSys |
| Sector: Industrials | |
| SubSector: Industrial Electrical Equipment | |
| MarketCap: 2068.79 Millions | |
| Recent Price: 93.28 Smart Investing & Trading Score: 90 | |
| Day Percent Change: 1.00% Day Change: 0.92 | |
| Week Change: 2.19% Year-to-date Change: -7.6% | |
| ENS Links: Profile News Message Board | |
| Charts:- Daily , Weekly | |
| Add ENS to Watchlist: View: Get Complete ENS Trend Analysis ➞ | |
 | UFPI Universal Forest Products, Inc. |
| Sector: Industrials | |
| SubSector: Lumber, Wood Production | |
| MarketCap: 2263.38 Millions | |
| Recent Price: 116.65 Smart Investing & Trading Score: 90 | |
| Day Percent Change: 1.00% Day Change: 1.16 | |
| Week Change: 2.65% Year-to-date Change: -7.1% | |
| UFPI Links: Profile News Message Board | |
| Charts:- Daily , Weekly | |
| Add UFPI to Watchlist: View: Get Complete UFPI Trend Analysis ➞ | |
| For tabular summary view of above stock list: Summary View ➞ 0 - 25 , 25 - 50 , 50 - 75 , 75 - 100 , 100 - 125 , 125 - 150 , 150 - 175 | ||
| Click To Change The Sort Order: By Market Cap or Company Size Performance: Year-to-date, Week and Day | |
| Select Chart Type: | ||
| Too many stocks? View smallcap stocks filtered by marketcap & sector |
| Marketcap: All SmallCap Stocks (default-no microcap), Large, Mid-Range, Small & MicroCap |
| Sector: Tech, Finance, Energy, Staples, Retail, Industrial, Materials, Utilities & Medical |
|
Best Stocks Today 12Stocks.com |
© 2024 12Stocks.com Terms & Conditions Privacy Contact Us
All Information Provided Only For Education And Not To Be Used For Investing or Trading. See Terms & Conditions


One More Thing ... Get Best Stocks Delivered Daily!
Never Ever Miss A Move With Our Top Ten Stocks Lists
Find Best Stocks In Any Market - Bull or Bear Market
Take A Peek At Our Top Ten Stocks Lists: Daily, Weekly, Year-to-Date & Top Trends
Find Best Stocks In Any Market - Bull or Bear Market
Take A Peek At Our Top Ten Stocks Lists: Daily, Weekly, Year-to-Date & Top Trends
Smallcap Stocks With Best Up Trends [0-bearish to 100-bullish]: Twist Bioscience[100], WideOpenWest [100], Joint [100], FTC Solar[100], Origin Materials[100], Alignment Healthcare[100], Clarus [100], IES [100], Emergent BioSolutions[100], Enovix [100], El Pollo[100]
Best Smallcap Stocks Year-to-Date:
Janux [482.74%], Viking [313.59%], Longboard [272.5%], Alpine Immune[239.29%], Bakkt [199.55%], Avidity Biosciences[192.48%], Vera [189.47%], Cullinan Oncology[176.9%], Super Micro[175.35%], Y-mAbs [151.47%], Sana [149.33%] Best Smallcap Stocks This Week:
Emergent BioSolutions[102.6%], Deciphera [73.24%], Origin Materials[66.52%], Eyenovia [60.78%], Cue Biopharma[56.04%], Aspen Aerogels[55.96%], Enovix [54.02%], Luna Innovations[53.77%], Codexis [47.37%], Carvana Co[44.31%], Office Properties[42.79%] Best Smallcap Stocks Daily:
Luna Innovations[36.00%], Twist Bioscience[28.74%], Ardelyx [28.42%], WideOpenWest [28.23%], 2U [26.63%], Joint [25.35%], FTC Solar[25.09%], Origin Materials[22.23%], Alignment Healthcare[21.97%], Clarus [18.67%], Aurora Innovation[18.09%]