
 Login Sign Up


| |||||
 |  | ||||

| 12Stocks.com Market Intelligence |
Best SmallCap Stocks
|
| In a hurry? Small Cap Stock Lists: Performance Trends Table, Stock Charts
Sort Small Cap stocks: Daily, Weekly, Year-to-Date, Market Cap & Trends. Filter Small Cap stocks list by sector: Show all, Tech, Finance, Energy, Staples, Retail, Industrial, Materials, Utilities and HealthCare Filter Small Cap stocks list by size: All Large Medium Small and MicroCap |
| 12Stocks.com Small Cap Stocks Performances & Trends Daily | |||||||||
|
|  The overall Smart Investing & Trading Score is 58 (0-bearish to 100-bullish) which puts Small Cap index in short term neutral trend. The Smart Investing & Trading Score from previous trading session is 63 and hence a deterioration of trend.
| ||||||||
Here are the Smart Investing & Trading Scores of the most requested small cap stocks at 12Stocks.com (click stock name for detailed review):
|


| 12Stocks.com: Investing in Smallcap Index with Stocks | |
|
The following table helps investors and traders sort through current performance and trends (as measured by Smart Investing & Trading Score) of various
stocks in the Smallcap Index. Quick View: Move mouse or cursor over stock symbol (ticker) to view short-term technical chart and over stock name to view long term chart. Click on  to add stock symbol to your watchlist and to add stock symbol to your watchlist and  to view watchlist. Click on any ticker or stock name for detailed market intelligence report for that stock. to view watchlist. Click on any ticker or stock name for detailed market intelligence report for that stock. |
12Stocks.com Performance of Stocks in Smallcap Index
| Ticker | Stock Name | Watchlist | Category | Recent Price | Smart Investing & Trading Score | Change % | YTD Change% |
| BW | Babcock & Wilcox Enterprises |   | Industrials | 1.13 | 54 | 22.66 | -22.95% |
| POWL | Powell Industries | | Industrials | 150.63 | 95 | 5.05 | 70.40% |
| MLI | Mueller Industries | | Industrials | 59.23 | 100 | 3.11 | 25.61% |
| IESC | IES | | Industrials | 130.21 | 80 | 2.01 | 64.37% |
| MHO | M/I Homes | | Industrials | 121.84 | 49 | 1.98 | -11.54% |
| TH | Target Hospitality | | Industrials | 11.02 | 88 | 1.94 | 13.26% |
| TPIC | TPI Composites | | Industrials | 2.64 | 27 | 1.93 | -36.23% |
| HSHP | Himalaya Shipping | | Industrials | 7.71 | 43 | 1.45 | 14.22% |
| SMR | NuScale Power | | Industrials | 5.55 | 75 | 1.28 | 72.09% |
| STRL | Sterling Construction | | Industrials | 102.55 | 58 | 0.98 | 16.62% |
| LYTS | LSI Industries | | Industrials | 14.65 | 51 | 0.93 | 4.08% |
| FIX | Comfort Systems | | Industrials | 311.19 | 70 | 0.88 | 51.31% |
| PL | Planet Labs | | Industrials | 1.78 | 37 | 0.85 | -28.02% |
| ZIP | ZipRecruiter | | Industrials | 10.51 | 20 | 0.82 | -25.04% |
| AAON | AAON | | Industrials | 89.26 | 75 | 0.79 | 20.83% |
| LZ | LegalZoom.com | | Industrials | 12.26 | 63 | 0.70 | 7.93% |
| RYI | Ryerson Holding | | Industrials | 9.45 | 10 | 0.64 | -10.12% |
| BWMN | Bowman Consulting | | Industrials | 31.52 | 52 | 0.62 | -10.48% |
| PACK | Ranpak | | Industrials | 7.48 | 75 | 0.54 | 28.52% |
| BV | BrightView | | Industrials | 11.57 | 75 | 0.43 | 37.41% |
| MEG | Montrose Environmental | | Industrials | 41.45 | 68 | 0.36 | 28.89% |
| ERII | Energy Recovery | | Industrials | 13.93 | 42 | 0.29 | -26.06% |
| OFLX | Omega Flex | | Industrials | 67.65 | 42 | 0.22 | -4.06% |
| PLPC | Preformed Line | | Industrials | 123.53 | 43 | 0.21 | -7.72% |
| DOOR | Masonite | | Industrials | 131.51 | 75 | 0.18 | 55.34% |
| For chart view version of above stock list: Chart View ➞ 0 - 25 , 25 - 50 , 50 - 75 , 75 - 100 , 100 - 125 , 125 - 150 | ||
 | Click To Change The Sort Order: By Market Cap or Company Size Performance: Year-to-date, Week and Day |  |
| Too many stocks? View smallcap stocks filtered by marketcap & sector |
| Marketcap: All SmallCap Stocks (default-no microcap), Large, Mid-Range, Small |
| Smallcap Sector: Tech, Finance, Energy, Staples, Retail, Industrial, Materials, & Medical |
|
Get the most comprehensive stock market coverage daily at 12Stocks.com ➞ Best Stocks Today ➞ Best Stocks Weekly ➞ Best Stocks Year-to-Date ➞ Best Stocks Trends ➞  Best Stocks Today 12Stocks.com Best Nasdaq Stocks ➞ Best S&P 500 Stocks ➞ Best Tech Stocks ➞ Best Biotech Stocks ➞ |
| Detailed Overview of SmallCap Stocks |
| SmallCap Technical Overview, Leaders & Laggards, Top SmallCap ETF Funds & Detailed SmallCap Stocks List, Charts, Trends & More |
| Smallcap: Technical Analysis, Trends & YTD Performance | |
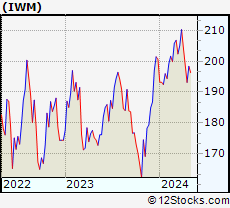
| SmallCap segment as represented by
IWM, an exchange-traded fund [ETF], holds basket of thousands of smallcap stocks from across all major sectors of the US stock market. The smallcap index (contains stocks like Riverbed & Sotheby's) is down by -1.75% and is currently underperforming the overall market by -7.09% year-to-date. Below is a quick view of technical charts and trends: | |
 IWM Weekly Chart |
|
| Long Term Trend: Good | |
| Medium Term Trend: Not Good | |
 IWM Daily Chart |
|
| Short Term Trend: Very Good | |
| Overall Trend Score: 58 | |
| YTD Performance: -1.75% | |
| **Trend Scores & Views Are Only For Educational Purposes And Not For Investing | |
| 12Stocks.com: Top Performing Small Cap Index Stocks | ||||||||||||||||||||||||||||||||||||||||||||||||
 The top performing Small Cap Index stocks year to date are
Now, more recently, over last week, the top performing Small Cap Index stocks on the move are


|
||||||||||||||||||||||||||||||||||||||||||||||||
| 12Stocks.com: Investing in Smallcap Index using Exchange Traded Funds | |
|
The following table shows list of key exchange traded funds (ETF) that
help investors track Smallcap index. The following list also includes leveraged ETF funds that track twice or thrice the daily returns of Smallcap indices. Short or inverse ETF funds move in the opposite direction to the index they track and are useful during market pullbacks or during bear markets. Quick View: Move mouse or cursor over ETF symbol (ticker) to view short-term technical chart and over ETF name to view long term chart. Click on ticker or stock name for detailed view. Click on to add stock symbol to your watchlist and to view watchlist. |
12Stocks.com List of ETFs that track Smallcap Index
| Ticker | ETF Name | Watchlist | Recent Price | Smart Investing & Trading Score | Change % | Week % | Year-to-date % |
| IWM | iShares Russell 2000 | | 197.19 | 58 | -0.69 | 2.1 | -1.75% |
| IJR | iShares Core S&P Small-Cap | | 105.72 | 85 | -0.23 | 2.42 | -2.34% |
| IWN | iShares Russell 2000 Value | | 151.29 | 75 | -0.30 | 2.38 | -2.6% |
| IWO | iShares Russell 2000 Growth | | 252.75 | 58 | 0.15 | 3.04 | 0.21% |
| 12Stocks.com: Charts, Trends, Fundamental Data and Performances of SmallCap Stocks | |
|
We now take in-depth look at all SmallCap stocks including charts, multi-period performances and overall trends (as measured by Smart Investing & Trading Score). One can sort SmallCap stocks (click link to choose) by Daily, Weekly and by Year-to-Date performances. Also, one can sort by size of the company or by market capitalization. |
| Select Your Default Chart Type: | |||||
| |||||
| Click on stock symbol or name for detailed view. Click on to add stock symbol to your watchlist and to view watchlist. Quick View: Move mouse or cursor over "Daily" to quickly view daily technical stock chart and over "Weekly" to view weekly technical stock chart. | |||||

 | BW Babcock & Wilcox Enterprises, Inc. |
| Sector: Industrials | |
| SubSector: Industrial Electrical Equipment | |
| MarketCap: 59.0879 Millions | |
| Recent Price: 1.13 Smart Investing & Trading Score: 54 | |
| Day Percent Change: 22.66% Day Change: 0.21 | |
| Week Change: 21.24% Year-to-date Change: -23.0% | |
| BW Links: Profile News Message Board | |
| Charts:- Daily , Weekly | |
| Add BW to Watchlist: View: Get Complete BW Trend Analysis ➞ | |
 | POWL Powell Industries, Inc. |
| Sector: Industrials | |
| SubSector: Diversified Machinery | |
| MarketCap: 257.216 Millions | |
| Recent Price: 150.63 Smart Investing & Trading Score: 95 | |
| Day Percent Change: 5.05% Day Change: 7.24 | |
| Week Change: 15.57% Year-to-date Change: 70.4% | |
| POWL Links: Profile News Message Board | |
| Charts:- Daily , Weekly | |
| Add POWL to Watchlist: View: Get Complete POWL Trend Analysis ➞ | |
 | MLI Mueller Industries, Inc. |
| Sector: Industrials | |
| SubSector: Metal Fabrication | |
| MarketCap: 1259.5 Millions | |
| Recent Price: 59.23 Smart Investing & Trading Score: 100 | |
| Day Percent Change: 3.11% Day Change: 1.79 | |
| Week Change: 13.28% Year-to-date Change: 25.6% | |
| MLI Links: Profile News Message Board | |
| Charts:- Daily , Weekly | |
| Add MLI to Watchlist: View: Get Complete MLI Trend Analysis ➞ | |
 | IESC IES Holdings, Inc. |
| Sector: Industrials | |
| SubSector: General Contractors | |
| MarketCap: 380.963 Millions | |
| Recent Price: 130.21 Smart Investing & Trading Score: 80 | |
| Day Percent Change: 2.01% Day Change: 2.56 | |
| Week Change: 12.73% Year-to-date Change: 64.4% | |
| IESC Links: Profile News Message Board | |
| Charts:- Daily , Weekly | |
| Add IESC to Watchlist: View: Get Complete IESC Trend Analysis ➞ | |
 | MHO M/I Homes, Inc. |
| Sector: Industrials | |
| SubSector: Residential Construction | |
| MarketCap: 437.106 Millions | |
| Recent Price: 121.84 Smart Investing & Trading Score: 49 | |
| Day Percent Change: 1.98% Day Change: 2.37 | |
| Week Change: 9.68% Year-to-date Change: -11.5% | |
| MHO Links: Profile News Message Board | |
| Charts:- Daily , Weekly | |
| Add MHO to Watchlist: View: Get Complete MHO Trend Analysis ➞ | |
 | TH Target Hospitality Corp. |
| Sector: Industrials | |
| SubSector: Conglomerates | |
| MarketCap: 218.048 Millions | |
| Recent Price: 11.02 Smart Investing & Trading Score: 88 | |
| Day Percent Change: 1.94% Day Change: 0.21 | |
| Week Change: 1.19% Year-to-date Change: 13.3% | |
| TH Links: Profile News Message Board | |
| Charts:- Daily , Weekly | |
| Add TH to Watchlist: View: Get Complete TH Trend Analysis ➞ | |
 | TPIC TPI Composites, Inc. |
| Sector: Industrials | |
| SubSector: Diversified Machinery | |
| MarketCap: 451.016 Millions | |
| Recent Price: 2.64 Smart Investing & Trading Score: 27 | |
| Day Percent Change: 1.93% Day Change: 0.05 | |
| Week Change: -1.49% Year-to-date Change: -36.2% | |
| TPIC Links: Profile News Message Board | |
| Charts:- Daily , Weekly | |
| Add TPIC to Watchlist: View: Get Complete TPIC Trend Analysis ➞ | |
 | HSHP Himalaya Shipping Ltd. |
| Sector: Industrials | |
| SubSector: Marine Shipping | |
| MarketCap: 179 Millions | |
| Recent Price: 7.71 Smart Investing & Trading Score: 43 | |
| Day Percent Change: 1.45% Day Change: 0.11 | |
| Week Change: -4.34% Year-to-date Change: 14.2% | |
| HSHP Links: Profile News Message Board | |
| Charts:- Daily , Weekly | |
| Add HSHP to Watchlist: View: Get Complete HSHP Trend Analysis ➞ | |
 | SMR NuScale Power Corporation |
| Sector: Industrials | |
| SubSector: Specialty Industrial Machinery | |
| MarketCap: 1510 Millions | |
| Recent Price: 5.55 Smart Investing & Trading Score: 75 | |
| Day Percent Change: 1.28% Day Change: 0.07 | |
| Week Change: 14.43% Year-to-date Change: 72.1% | |
| SMR Links: Profile News Message Board | |
| Charts:- Daily , Weekly | |
| Add SMR to Watchlist: View: Get Complete SMR Trend Analysis ➞ | |
 | STRL Sterling Construction Company, Inc. |
| Sector: Industrials | |
| SubSector: Heavy Construction | |
| MarketCap: 237.395 Millions | |
| Recent Price: 102.55 Smart Investing & Trading Score: 58 | |
| Day Percent Change: 0.98% Day Change: 1.00 | |
| Week Change: 6.2% Year-to-date Change: 16.6% | |
| STRL Links: Profile News Message Board | |
| Charts:- Daily , Weekly | |
| Add STRL to Watchlist: View: Get Complete STRL Trend Analysis ➞ | |
 | LYTS LSI Industries Inc. |
| Sector: Industrials | |
| SubSector: Industrial Electrical Equipment | |
| MarketCap: 85.7879 Millions | |
| Recent Price: 14.65 Smart Investing & Trading Score: 51 | |
| Day Percent Change: 0.93% Day Change: 0.13 | |
| Week Change: -0.31% Year-to-date Change: 4.1% | |
| LYTS Links: Profile News Message Board | |
| Charts:- Daily , Weekly | |
| Add LYTS to Watchlist: View: Get Complete LYTS Trend Analysis ➞ | |
 | FIX Comfort Systems USA, Inc. |
| Sector: Industrials | |
| SubSector: General Contractors | |
| MarketCap: 1440.63 Millions | |
| Recent Price: 311.19 Smart Investing & Trading Score: 70 | |
| Day Percent Change: 0.88% Day Change: 2.72 | |
| Week Change: 7.04% Year-to-date Change: 51.3% | |
| FIX Links: Profile News Message Board | |
| Charts:- Daily , Weekly | |
| Add FIX to Watchlist: View: Get Complete FIX Trend Analysis ➞ | |
 | PL Planet Labs PBC |
| Sector: Industrials | |
| SubSector: Aerospace & Defense | |
| MarketCap: 874 Millions | |
| Recent Price: 1.78 Smart Investing & Trading Score: 37 | |
| Day Percent Change: 0.85% Day Change: 0.01 | |
| Week Change: 2% Year-to-date Change: -28.0% | |
| PL Links: Profile News Message Board | |
| Charts:- Daily , Weekly | |
| Add PL to Watchlist: View: Get Complete PL Trend Analysis ➞ | |
 | ZIP ZipRecruiter, Inc. |
| Sector: Industrials | |
| SubSector: Staffing & Employment Services | |
| MarketCap: 1730 Millions | |
| Recent Price: 10.51 Smart Investing & Trading Score: 20 | |
| Day Percent Change: 0.82% Day Change: 0.09 | |
| Week Change: -0.14% Year-to-date Change: -25.0% | |
| ZIP Links: Profile News Message Board | |
| Charts:- Daily , Weekly | |
| Add ZIP to Watchlist: View: Get Complete ZIP Trend Analysis ➞ | |
 | AAON AAON, Inc. |
| Sector: Industrials | |
| SubSector: General Building Materials | |
| MarketCap: 2533.63 Millions | |
| Recent Price: 89.26 Smart Investing & Trading Score: 75 | |
| Day Percent Change: 0.79% Day Change: 0.70 | |
| Week Change: 4.51% Year-to-date Change: 20.8% | |
| AAON Links: Profile News Message Board | |
| Charts:- Daily , Weekly | |
| Add AAON to Watchlist: View: Get Complete AAON Trend Analysis ➞ | |
 | LZ LegalZoom.com, Inc. |
| Sector: Industrials | |
| SubSector: Specialty Business Services | |
| MarketCap: 2330 Millions | |
| Recent Price: 12.26 Smart Investing & Trading Score: 63 | |
| Day Percent Change: 0.70% Day Change: 0.09 | |
| Week Change: 4.48% Year-to-date Change: 7.9% | |
| LZ Links: Profile News Message Board | |
| Charts:- Daily , Weekly | |
| Add LZ to Watchlist: View: Get Complete LZ Trend Analysis ➞ | |
 | RYI Ryerson Holding Corporation |
| Sector: Industrials | |
| SubSector: Metal Fabrication | |
| MarketCap: 202.55 Millions | |
| Recent Price: 9.45 Smart Investing & Trading Score: 10 | |
| Day Percent Change: 0.64% Day Change: 0.06 | |
| Week Change: -2.59% Year-to-date Change: -10.1% | |
| RYI Links: Profile News Message Board | |
| Charts:- Daily , Weekly | |
| Add RYI to Watchlist: View: Get Complete RYI Trend Analysis ➞ | |
 | BWMN Bowman Consulting Group Ltd. |
| Sector: Industrials | |
| SubSector: Engineering & Construction | |
| MarketCap: 443 Millions | |
| Recent Price: 31.52 Smart Investing & Trading Score: 52 | |
| Day Percent Change: 0.62% Day Change: 0.20 | |
| Week Change: 4.2% Year-to-date Change: -10.5% | |
| BWMN Links: Profile News Message Board | |
| Charts:- Daily , Weekly | |
| Add BWMN to Watchlist: View: Get Complete BWMN Trend Analysis ➞ | |
 | PACK Ranpak Holdings Corp. |
| Sector: Industrials | |
| SubSector: Conglomerates | |
| MarketCap: 492.648 Millions | |
| Recent Price: 7.48 Smart Investing & Trading Score: 75 | |
| Day Percent Change: 0.54% Day Change: 0.04 | |
| Week Change: 4.03% Year-to-date Change: 28.5% | |
| PACK Links: Profile News Message Board | |
| Charts:- Daily , Weekly | |
| Add PACK to Watchlist: View: Get Complete PACK Trend Analysis ➞ | |
 | BV BrightView Holdings, Inc. |
| Sector: Industrials | |
| SubSector: General Contractors | |
| MarketCap: 973.763 Millions | |
| Recent Price: 11.57 Smart Investing & Trading Score: 75 | |
| Day Percent Change: 0.43% Day Change: 0.05 | |
| Week Change: 4.61% Year-to-date Change: 37.4% | |
| BV Links: Profile News Message Board | |
| Charts:- Daily , Weekly | |
| Add BV to Watchlist: View: Get Complete BV Trend Analysis ➞ | |
 | MEG Montrose Environmental Group, Inc. |
| Sector: Industrials | |
| SubSector: Waste Management | |
| MarketCap: 71627 Millions | |
| Recent Price: 41.45 Smart Investing & Trading Score: 68 | |
| Day Percent Change: 0.36% Day Change: 0.15 | |
| Week Change: 2.65% Year-to-date Change: 28.9% | |
| MEG Links: Profile News Message Board | |
| Charts:- Daily , Weekly | |
| Add MEG to Watchlist: View: Get Complete MEG Trend Analysis ➞ | |
 | ERII Energy Recovery, Inc. |
| Sector: Industrials | |
| SubSector: Pollution & Treatment Controls | |
| MarketCap: 429.375 Millions | |
| Recent Price: 13.93 Smart Investing & Trading Score: 42 | |
| Day Percent Change: 0.29% Day Change: 0.04 | |
| Week Change: 1.6% Year-to-date Change: -26.1% | |
| ERII Links: Profile News Message Board | |
| Charts:- Daily , Weekly | |
| Add ERII to Watchlist: View: Get Complete ERII Trend Analysis ➞ | |
 | OFLX Omega Flex, Inc. |
| Sector: Industrials | |
| SubSector: Industrial Equipment & Components | |
| MarketCap: 590.609 Millions | |
| Recent Price: 67.65 Smart Investing & Trading Score: 42 | |
| Day Percent Change: 0.22% Day Change: 0.15 | |
| Week Change: 0.97% Year-to-date Change: -4.1% | |
| OFLX Links: Profile News Message Board | |
| Charts:- Daily , Weekly | |
| Add OFLX to Watchlist: View: Get Complete OFLX Trend Analysis ➞ | |
 | PLPC Preformed Line Products Company |
| Sector: Industrials | |
| SubSector: Industrial Electrical Equipment | |
| MarketCap: 221.779 Millions | |
| Recent Price: 123.53 Smart Investing & Trading Score: 43 | |
| Day Percent Change: 0.21% Day Change: 0.26 | |
| Week Change: -0.91% Year-to-date Change: -7.7% | |
| PLPC Links: Profile News Message Board | |
| Charts:- Daily , Weekly | |
| Add PLPC to Watchlist: View: Get Complete PLPC Trend Analysis ➞ | |
 | DOOR Masonite International Corporation |
| Sector: Industrials | |
| SubSector: General Building Materials | |
| MarketCap: 1220.53 Millions | |
| Recent Price: 131.51 Smart Investing & Trading Score: 75 | |
| Day Percent Change: 0.18% Day Change: 0.23 | |
| Week Change: 0.09% Year-to-date Change: 55.3% | |
| DOOR Links: Profile News Message Board | |
| Charts:- Daily , Weekly | |
| Add DOOR to Watchlist: View: Get Complete DOOR Trend Analysis ➞ | |
| For tabular summary view of above stock list: Summary View ➞ 0 - 25 , 25 - 50 , 50 - 75 , 75 - 100 , 100 - 125 , 125 - 150 | ||
| Click To Change The Sort Order: By Market Cap or Company Size Performance: Year-to-date, Week and Day | |
| Select Chart Type: | ||
| Too many stocks? View smallcap stocks filtered by marketcap & sector |
| Marketcap: All SmallCap Stocks (default-no microcap), Large, Mid-Range, Small & MicroCap |
| Sector: Tech, Finance, Energy, Staples, Retail, Industrial, Materials, Utilities & Medical |
|
Best Stocks Today 12Stocks.com |
© 2024 12Stocks.com Terms & Conditions Privacy Contact Us
All Information Provided Only For Education And Not To Be Used For Investing or Trading. See Terms & Conditions


One More Thing ... Get Best Stocks Delivered Daily!
Never Ever Miss A Move With Our Top Ten Stocks Lists
Find Best Stocks In Any Market - Bull or Bear Market
Take A Peek At Our Top Ten Stocks Lists: Daily, Weekly, Year-to-Date & Top Trends
Find Best Stocks In Any Market - Bull or Bear Market
Take A Peek At Our Top Ten Stocks Lists: Daily, Weekly, Year-to-Date & Top Trends
Smallcap Stocks With Best Up Trends [0-bearish to 100-bullish]: Ribbon [100], B. Riley[100], Group 1[100], Trustmark [100], Integer [100], Mueller Industries[100], Glaukos [100], A10 s[100], Uniti Group[100], Wolverine World[100], Jamf Holding[100]
Best Smallcap Stocks Year-to-Date:
Janux [352.07%], Viking [259.7%], Alpine Immune[239.18%], Longboard [230.61%], Avidity Biosciences[176.77%], Super Micro[166.58%], Vera [149.61%], Hippo [131.72%], MicroStrategy [104.08%], SoundHound AI[103.27%], Trevi [101.87%] Best Smallcap Stocks This Week:
Matterport [166.09%], B. Riley[39.52%], Riot Blockchain[30.12%], Seres [30.01%], Ribbon [29.84%], ProKidney [23.28%], SoundHound AI[22.54%], Cipher Mining[22.14%], Babcock & Wilcox Enterprises[21.24%], Hibbett Sports[21.01%], Marathon Patent[20.06%] Best Smallcap Stocks Daily:
Ribbon [30.35%], B. Riley[28.41%], Babcock & Wilcox Enterprises[22.66%], Innodata [12.20%], Navitas Semiconductor[8.83%], K12 [8.21%], Cullinan Oncology[8.11%], Sage [8.03%], Vigil Neuroscience[7.92%], Annexon [7.66%], Group 1[5.92%]