
 Login Sign Up


| |||||
 |  | ||||

| 12Stocks.com Market Intelligence |
Best SmallCap Stocks
|
| In a hurry? Small Cap Stock Lists: Performance Trends Table, Stock Charts
Sort Small Cap stocks: Daily, Weekly, Year-to-Date, Market Cap & Trends. Filter Small Cap stocks list by sector: Show all, Tech, Finance, Energy, Staples, Retail, Industrial, Materials, Utilities and HealthCare Filter Small Cap stocks list by size: All Large Medium Small and MicroCap |
| 12Stocks.com Small Cap Stocks Performances & Trends Daily | |||||||||
|
|  The overall Smart Investing & Trading Score is 80 (0-bearish to 100-bullish) which puts Small Cap index in short term neutral to bullish trend. The Smart Investing & Trading Score from previous trading session is 50 and an improvement of trend continues.
| ||||||||
Here are the Smart Investing & Trading Scores of the most requested small cap stocks at 12Stocks.com (click stock name for detailed review):
|


| 12Stocks.com: Investing in Smallcap Index with Stocks | |
|
The following table helps investors and traders sort through current performance and trends (as measured by Smart Investing & Trading Score) of various
stocks in the Smallcap Index. Quick View: Move mouse or cursor over stock symbol (ticker) to view short-term technical chart and over stock name to view long term chart. Click on  to add stock symbol to your watchlist and to add stock symbol to your watchlist and  to view watchlist. Click on any ticker or stock name for detailed market intelligence report for that stock. to view watchlist. Click on any ticker or stock name for detailed market intelligence report for that stock. |
12Stocks.com Performance of Stocks in Smallcap Index
| Ticker | Stock Name | Watchlist | Category | Recent Price | Smart Investing & Trading Score | Change % | YTD Change% |
| MSTR | Strategy |   | Technology | 329.71 | 30 | -1.61% | 9.90% |
| CVNA | Carvana Co | | Services & Goods | 378.06 | 80 | 3.69% | 89.45% |
| PSTX | Poseida | | Health Care | 9.50 | 50 | -0.63% | 1.06% |
| MPLN | MultiPlan | | Health Care | 20.99 | 40 | -9.33% | 62.08% |
| INZY | Inozyme Pharma | | Health Care | 4.00 | 50 | 0.00% | 40.35% |
| B | Barrick Mining | | Materials | 29.48 | 90 | 2.22% | 86.62% |
| BIGC | BigCommerce | | Technology | 4.49 | 0 | -6.07% | -27.35% |
| PTVE | Pactiv Evergreen | | Services & Goods | 18.01 | 50 | -0.06% | 3.15% |
| NARI | Inari Medical | | Health Care | 79.97 | 60 | 0.00% | 54.38% |
| ACCD | Accolade | | Health Care | 7.02 | 60 | 0.00% | 105.26% |
| INSM | Insmed | | Health Care | 144.78 | 40 | 0.02% | 106.98% |
| ALVR | AlloVir | | Health Care | 11.47 | 100 | 16.92% | 10.82% |
| FIX | Comfort Systems | | Industrials | 762.91 | 60 | -1.84% | 78.44% |
| CRDO | Credo | | Technology | 164.44 | 56 | 4.59% | 64.95% |
| SMCI | Super Micro | | Technology | 44.90 | 60 | -0.02% | 49.42% |
| RKLB | Rocket Lab | | Industrials | 48.08 | 40 | 1.77% | 92.63% |
| CERE | Cerevel | | Health Care | 44.96 | 50 | 0.00% | 0.00% |
| SATS | EchoStar Corp | | Technology | 71.81 | 50 | 2.88% | 215.65% |
| SMMT | Summit | | Health Care | 18.09 | 30 | -0.17% | -1.42% |
| FTAI | FTAI Aviation | | Industrials | 174.04 | 90 | 0.17% | 21.42% |
| COOP | Mr. Cooper | | Financials | 220.90 | 80 | 2.16% | 135.00% |
| SFM | Sprouts Farmers | | Consumer Staples | 123.36 | 0 | -1.72% | -7.22% |
| BE | Bloom Energy | | Industrials | 79.67 | 100 | 8.71% | 240.91% |
| FN | Fabrinet | | Technology | 358.21 | 50 | 0.75% | 62.55% |
| IONQ | IonQ | | Technology | 65.44 | 100 | 5.11% | 51.83% |


| Too many stocks? View smallcap stocks filtered by marketcap & sector |
| Marketcap: All SmallCap Stocks (default-no microcap), Large, Mid-Range, Small |
| Smallcap Sector: Tech, Finance, Energy, Staples, Retail, Industrial, Materials, & Medical |
|
Get the most comprehensive stock market coverage daily at 12Stocks.com ➞ Best Stocks Today ➞ Best Stocks Weekly ➞ Best Stocks Year-to-Date ➞ Best Stocks Trends ➞  Best Stocks Today 12Stocks.com Best Nasdaq Stocks ➞ Best S&P 500 Stocks ➞ Best Tech Stocks ➞ Best Biotech Stocks ➞ |
| Detailed Overview of SmallCap Stocks |
| SmallCap Technical Overview, Leaders & Laggards, Top SmallCap ETF Funds & Detailed SmallCap Stocks List, Charts, Trends & More |
| Smallcap: Technical Analysis, Trends & YTD Performance | |
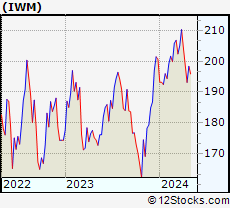
| SmallCap segment as represented by
IWM, an exchange-traded fund [ETF], holds basket of thousands of smallcap stocks from across all major sectors of the US stock market. The smallcap index (contains stocks like Riverbed & Sotheby's) is up by 8.58223% and is currently underperforming the overall market by -4.56457% year-to-date. Below is a quick view of technical charts and trends: | |
 IWM Weekly Chart |
|
| Long Term Trend: Very Good | |
| Medium Term Trend: Good | |
 IWM Daily Chart |
|
| Short Term Trend: Good | |
| Overall Trend Score: 80 | |
| YTD Performance: 8.58223% | |
| **Trend Scores & Views Are Only For Educational Purposes And Not For Investing | |
| 12Stocks.com: Top Performing Small Cap Index Stocks | ||||||||||||||||||||||||||||||||||||||||||||||||
 The top performing Small Cap Index stocks year to date are
Now, more recently, over last week, the top performing Small Cap Index stocks on the move are


|
||||||||||||||||||||||||||||||||||||||||||||||||
| 12Stocks.com: Investing in Smallcap Index using Exchange Traded Funds | |
|
The following table shows list of key exchange traded funds (ETF) that
help investors track Smallcap index. The following list also includes leveraged ETF funds that track twice or thrice the daily returns of Smallcap indices. Short or inverse ETF funds move in the opposite direction to the index they track and are useful during market pullbacks or during bear markets. Quick View: Move mouse or cursor over ETF symbol (ticker) to view short-term technical chart and over ETF name to view long term chart. Click on ticker or stock name for detailed view. Click on to add stock symbol to your watchlist and to view watchlist. |
12Stocks.com List of ETFs that track Smallcap Index
| Ticker | ETF Name | Watchlist | Recent Price | Smart Investing & Trading Score | Change % | Week % | Year-to-date % |
| IWM | iShares Russell 2000 ETF | | 238.92 | 80 | 0.268592 | 0.873971 | 8.58223% |
| IJR | iShares Core S&P Small-Cap ETF | | 117.95 | 30 | -0.025428 | 0.0339242 | 3.2819% |
| VTWO | Vanguard Russell 2000 Index ETF | | 96.93 | 80 | 0.248216 | 1.16898 | 9.0639% |
| IWN | iShares Russell 2000 Value ETF | | 175.07 | 50 | 0.0457169 | 0.206056 | 7.63206% |
| IWO | iShares Russell 2000 Growth ETF | | 315.01 | 80 | 0.283331 | 1.34805 | 9.36063% |
| IJS | iShares S&P Small-Cap 600 Value ETF | | 109.96 | 50 | 0.0728067 | 0.10925 | 2.50291% |
| IJT | iShares S&P Small-Cap 600 Growth ETF | | 140.39 | 30 | -0.0356024 | 0.0641483 | 3.99182% |
| XSLV | Invesco S&P SmallCap Low Volatility ETF | | 46.84 | 30 | 0.0168688 | -1.11885 | 0.602455% |
| SAA | ProShares Ultra SmallCap600 2x Shares | | 25.41 | 50 | -0.0220337 | 0.913423 | -1.51659% |
| SBB | ProShares Short SmallCap600 -1x Shares | | 14.05 | 50 | 0.0698006 | -0.473202 | -2.76282% |
| SMLV | SPDR SSGA US Small Cap Low Volatility Index ETF | | 132.22 | 70 | 0.731373 | 0.254769 | 6.04408% |
| SDD | ProShares UltraShort SmallCap600 -2x Shares | | 13.45 | 50 | 0.114649 | 0.694122 | -11.0908% |
| 12Stocks.com: Charts, Trends, Fundamental Data and Performances of SmallCap Stocks | |
|
We now take in-depth look at all SmallCap stocks including charts, multi-period performances and overall trends (as measured by Smart Investing & Trading Score). One can sort SmallCap stocks (click link to choose) by Daily, Weekly and by Year-to-Date performances. Also, one can sort by size of the company or by market capitalization. |
| Select Your Default Chart Type: | |||||
| |||||
| Click on stock symbol or name for detailed view. Click on to add stock symbol to your watchlist and to view watchlist. Quick View: Move mouse or cursor over "Daily" to quickly view daily technical stock chart and over "Weekly" to view weekly technical stock chart. | |||||

 | MSTR Strategy Inc |
| Sector: Technology | |
| SubSector: Software - Application | |
| MarketCap: 95236.8 Millions | |
| Recent Price: 329.71 Smart Investing & Trading Score: 30 | |
| Day Percent Change: -1.60554% Day Change: -6.79 | |
| Week Change: 0.359176% Year-to-date Change: 9.9% | |
| MSTR Links: Profile News Message Board | |
| Charts:- Daily , Weekly | |
| Add MSTR to Watchlist: View: Get Complete MSTR Trend Analysis ➞ | |
 | CVNA Carvana Co |
| Sector: Services & Goods | |
| SubSector: Auto & Truck Dealerships | |
| MarketCap: 79384.2 Millions | |
| Recent Price: 378.06 Smart Investing & Trading Score: 80 | |
| Day Percent Change: 3.69456% Day Change: 0.46 | |
| Week Change: 0.816% Year-to-date Change: 89.4% | |
| CVNA Links: Profile News Message Board | |
| Charts:- Daily , Weekly | |
| Add CVNA to Watchlist: View: Get Complete CVNA Trend Analysis ➞ | |
 | PSTX Poseida Therapeutics, Inc. |
| Sector: Health Care | |
| SubSector: Biotechnology | |
| MarketCap: 64487 Millions | |
| Recent Price: 9.50 Smart Investing & Trading Score: 50 | |
| Day Percent Change: -0.627615% Day Change: -9999 | |
| Week Change: 0.849257% Year-to-date Change: 1.1% | |
| PSTX Links: Profile News Message Board | |
| Charts:- Daily , Weekly | |
| Add PSTX to Watchlist: View: Get Complete PSTX Trend Analysis ➞ | |
 | MPLN MultiPlan Corporation |
| Sector: Health Care | |
| SubSector: Healthcare Plans | |
| MarketCap: 56087 Millions | |
| Recent Price: 20.99 Smart Investing & Trading Score: 40 | |
| Day Percent Change: -9.33045% Day Change: -9999 | |
| Week Change: -28.775% Year-to-date Change: 62.1% | |
| MPLN Links: Profile News Message Board | |
| Charts:- Daily , Weekly | |
| Add MPLN to Watchlist: View: Get Complete MPLN Trend Analysis ➞ | |
 | INZY Inozyme Pharma, Inc. |
| Sector: Health Care | |
| SubSector: Biotechnology | |
| MarketCap: 53487 Millions | |
| Recent Price: 4.00 Smart Investing & Trading Score: 50 | |
| Day Percent Change: 0% Day Change: -9999 | |
| Week Change: 0.250627% Year-to-date Change: 40.4% | |
| INZY Links: Profile News Message Board | |
| Charts:- Daily , Weekly | |
| Add INZY to Watchlist: View: Get Complete INZY Trend Analysis ➞ | |
 | B Barrick Mining Corp |
| Sector: Materials | |
| SubSector: Gold | |
| MarketCap: 48467.2 Millions | |
| Recent Price: 29.48 Smart Investing & Trading Score: 90 | |
| Day Percent Change: 2.21914% Day Change: 0.69 | |
| Week Change: 1.09739% Year-to-date Change: 86.6% | |
| B Links: Profile News Message Board | |
| Charts:- Daily , Weekly | |
| Add B to Watchlist: View: Get Complete B Trend Analysis ➞ | |
 | BIGC BigCommerce Holdings, Inc. |
| Sector: Technology | |
| SubSector: Software Application | |
| MarketCap: 47587 Millions | |
| Recent Price: 4.49 Smart Investing & Trading Score: 0 | |
| Day Percent Change: -6.06695% Day Change: -9999 | |
| Week Change: -10.9127% Year-to-date Change: -27.3% | |
| BIGC Links: Profile News Message Board | |
| Charts:- Daily , Weekly | |
| Add BIGC to Watchlist: View: Get Complete BIGC Trend Analysis ➞ | |
 | PTVE Pactiv Evergreen Inc. |
| Sector: Services & Goods | |
| SubSector: Packaging & Containers | |
| MarketCap: 33427 Millions | |
| Recent Price: 18.01 Smart Investing & Trading Score: 50 | |
| Day Percent Change: -0.0554939% Day Change: -9999 | |
| Week Change: 0.44618% Year-to-date Change: 3.2% | |
| PTVE Links: Profile News Message Board | |
| Charts:- Daily , Weekly | |
| Add PTVE to Watchlist: View: Get Complete PTVE Trend Analysis ➞ | |
 | NARI Inari Medical, Inc. |
| Sector: Health Care | |
| SubSector: Medical Devices | |
| MarketCap: 33287 Millions | |
| Recent Price: 79.97 Smart Investing & Trading Score: 60 | |
| Day Percent Change: 0% Day Change: -9999 | |
| Week Change: 0.137741% Year-to-date Change: 54.4% | |
| NARI Links: Profile News Message Board | |
| Charts:- Daily , Weekly | |
| Add NARI to Watchlist: View: Get Complete NARI Trend Analysis ➞ | |
 | ACCD Accolade, Inc. |
| Sector: Health Care | |
| SubSector: Health Information Services | |
| MarketCap: 32987 Millions | |
| Recent Price: 7.02 Smart Investing & Trading Score: 60 | |
| Day Percent Change: 0% Day Change: -9999 | |
| Week Change: 0.573066% Year-to-date Change: 105.3% | |
| ACCD Links: Profile News Message Board | |
| Charts:- Daily , Weekly | |
| Add ACCD to Watchlist: View: Get Complete ACCD Trend Analysis ➞ | |
 | INSM Insmed Inc |
| Sector: Health Care | |
| SubSector: Biotechnology | |
| MarketCap: 30670.5 Millions | |
| Recent Price: 144.78 Smart Investing & Trading Score: 40 | |
| Day Percent Change: 0.0207254% Day Change: 3.15 | |
| Week Change: -1.64402% Year-to-date Change: 107.0% | |
| INSM Links: Profile News Message Board | |
| Charts:- Daily , Weekly | |
| Add INSM to Watchlist: View: Get Complete INSM Trend Analysis ➞ | |
 | ALVR AlloVir, Inc. |
| Sector: Health Care | |
| SubSector: Biotechnology | |
| MarketCap: 25787 Millions | |
| Recent Price: 11.47 Smart Investing & Trading Score: 100 | |
| Day Percent Change: 16.9215% Day Change: -9999 | |
| Week Change: 20.8641% Year-to-date Change: 10.8% | |
| ALVR Links: Profile News Message Board | |
| Charts:- Daily , Weekly | |
| Add ALVR to Watchlist: View: Get Complete ALVR Trend Analysis ➞ | |
 | FIX Comfort Systems USA, Inc |
| Sector: Industrials | |
| SubSector: Engineering & Construction | |
| MarketCap: 24919.6 Millions | |
| Recent Price: 762.91 Smart Investing & Trading Score: 60 | |
| Day Percent Change: -1.83613% Day Change: 12.92 | |
| Week Change: 7.52329% Year-to-date Change: 78.4% | |
| FIX Links: Profile News Message Board | |
| Charts:- Daily , Weekly | |
| Add FIX to Watchlist: View: Get Complete FIX Trend Analysis ➞ | |
 | CRDO Credo Technology Group Holding Ltd |
| Sector: Technology | |
| SubSector: Semiconductors | |
| MarketCap: 24361.2 Millions | |
| Recent Price: 164.44 Smart Investing & Trading Score: 56 | |
| Day Percent Change: 4.59% Day Change: 4.87 | |
| Week Change: -5.51% Year-to-date Change: 65.0% | |
| CRDO Links: Profile News Message Board | |
| Charts:- Daily , Weekly | |
| Add CRDO to Watchlist: View: Get Complete CRDO Trend Analysis ➞ | |
 | SMCI Super Micro Computer Inc |
| Sector: Technology | |
| SubSector: Computer Hardware | |
| MarketCap: 24014.6 Millions | |
| Recent Price: 44.90 Smart Investing & Trading Score: 60 | |
| Day Percent Change: -0.0222668% Day Change: -0.3 | |
| Week Change: 4.61323% Year-to-date Change: 49.4% | |
| SMCI Links: Profile News Message Board | |
| Charts:- Daily , Weekly | |
| Add SMCI to Watchlist: View: Get Complete SMCI Trend Analysis ➞ | |
 | RKLB Rocket Lab Corp |
| Sector: Industrials | |
| SubSector: Aerospace & Defense | |
| MarketCap: 22113.8 Millions | |
| Recent Price: 48.08 Smart Investing & Trading Score: 40 | |
| Day Percent Change: 1.76738% Day Change: 0.84 | |
| Week Change: 2.23262% Year-to-date Change: 92.6% | |
| RKLB Links: Profile News Message Board | |
| Charts:- Daily , Weekly | |
| Add RKLB to Watchlist: View: Get Complete RKLB Trend Analysis ➞ | |
 | CERE Cerevel Therapeutics Holdings, Inc. |
| Sector: Health Care | |
| SubSector: Biotechnology | |
| MarketCap: 21587 Millions | |
| Recent Price: 44.96 Smart Investing & Trading Score: 50 | |
| Day Percent Change: 0% Day Change: -9999 | |
| Week Change: 3.66613% Year-to-date Change: 0.0% | |
| CERE Links: Profile News Message Board | |
| Charts:- Daily , Weekly | |
| Add CERE to Watchlist: View: Get Complete CERE Trend Analysis ➞ | |
 | SATS EchoStar Corp |
| Sector: Technology | |
| SubSector: Telecom Services | |
| MarketCap: 19346.1 Millions | |
| Recent Price: 71.81 Smart Investing & Trading Score: 50 | |
| Day Percent Change: 2.87966% Day Change: -0.15 | |
| Week Change: -14.072% Year-to-date Change: 215.6% | |
| SATS Links: Profile News Message Board | |
| Charts:- Daily , Weekly | |
| Add SATS to Watchlist: View: Get Complete SATS Trend Analysis ➞ | |
 | SMMT Summit Therapeutics Inc |
| Sector: Health Care | |
| SubSector: Biotechnology | |
| MarketCap: 19294.6 Millions | |
| Recent Price: 18.09 Smart Investing & Trading Score: 30 | |
| Day Percent Change: -0.165563% Day Change: 0.14 | |
| Week Change: -3.90438% Year-to-date Change: -1.4% | |
| SMMT Links: Profile News Message Board | |
| Charts:- Daily , Weekly | |
| Add SMMT to Watchlist: View: Get Complete SMMT Trend Analysis ➞ | |
 | FTAI FTAI Aviation Ltd |
| Sector: Industrials | |
| SubSector: Rental & Leasing Services | |
| MarketCap: 15795.9 Millions | |
| Recent Price: 174.04 Smart Investing & Trading Score: 90 | |
| Day Percent Change: 0.166906% Day Change: 5.69 | |
| Week Change: 5.23006% Year-to-date Change: 21.4% | |
| FTAI Links: Profile News Message Board | |
| Charts:- Daily , Weekly | |
| Add FTAI to Watchlist: View: Get Complete FTAI Trend Analysis ➞ | |
 | COOP Mr. Cooper Group Inc |
| Sector: Financials | |
| SubSector: Mortgage Finance | |
| MarketCap: 13637.6 Millions | |
| Recent Price: 220.90 Smart Investing & Trading Score: 80 | |
| Day Percent Change: 2.16446% Day Change: -2.14 | |
| Week Change: 2.60579% Year-to-date Change: 135.0% | |
| COOP Links: Profile News Message Board | |
| Charts:- Daily , Weekly | |
| Add COOP to Watchlist: View: Get Complete COOP Trend Analysis ➞ | |
 | SFM Sprouts Farmers Market Inc |
| Sector: Consumer Staples | |
| SubSector: Grocery Stores | |
| MarketCap: 13567.3 Millions | |
| Recent Price: 123.36 Smart Investing & Trading Score: 0 | |
| Day Percent Change: -1.72084% Day Change: -2.65 | |
| Week Change: -9.30412% Year-to-date Change: -7.2% | |
| SFM Links: Profile News Message Board | |
| Charts:- Daily , Weekly | |
| Add SFM to Watchlist: View: Get Complete SFM Trend Analysis ➞ | |
 | BE Bloom Energy Corp |
| Sector: Industrials | |
| SubSector: Electrical Equipment & Parts | |
| MarketCap: 13354.3 Millions | |
| Recent Price: 79.67 Smart Investing & Trading Score: 100 | |
| Day Percent Change: 8.70514% Day Change: 0.32 | |
| Week Change: 44.8545% Year-to-date Change: 240.9% | |
| BE Links: Profile News Message Board | |
| Charts:- Daily , Weekly | |
| Add BE to Watchlist: View: Get Complete BE Trend Analysis ➞ | |
 | FN Fabrinet |
| Sector: Technology | |
| SubSector: Electronic Components | |
| MarketCap: 13221 Millions | |
| Recent Price: 358.21 Smart Investing & Trading Score: 50 | |
| Day Percent Change: 0.753804% Day Change: -3.29 | |
| Week Change: -2.94779% Year-to-date Change: 62.5% | |
| FN Links: Profile News Message Board | |
| Charts:- Daily , Weekly | |
| Add FN to Watchlist: View: Get Complete FN Trend Analysis ➞ | |
 | IONQ IonQ Inc |
| Sector: Technology | |
| SubSector: Computer Hardware | |
| MarketCap: 12443.1 Millions | |
| Recent Price: 65.44 Smart Investing & Trading Score: 100 | |
| Day Percent Change: 5.10761% Day Change: 0.38 | |
| Week Change: 48.7273% Year-to-date Change: 51.8% | |
| IONQ Links: Profile News Message Board | |
| Charts:- Daily , Weekly | |
| Add IONQ to Watchlist: View: Get Complete IONQ Trend Analysis ➞ | |
| Too many stocks? View smallcap stocks filtered by marketcap & sector |
| Marketcap: All SmallCap Stocks (default-no microcap), Large, Mid-Range, Small & MicroCap |
| Sector: Tech, Finance, Energy, Staples, Retail, Industrial, Materials, Utilities & Medical |
|
Best Stocks Today 12Stocks.com |
© 2025 12Stocks.com Terms & Conditions Privacy Contact Us
All Information Provided Only For Education And Not To Be Used For Investing or Trading. See Terms & Conditions


One More Thing ... Get Best Stocks Delivered Daily!
Never Ever Miss A Move With Our Top Ten Stocks Lists
Find Best Stocks In Any Market - Bull or Bear Market
Take A Peek At Our Top Ten Stocks Lists: Daily, Weekly, Year-to-Date & Top Trends
Find Best Stocks In Any Market - Bull or Bear Market
Take A Peek At Our Top Ten Stocks Lists: Daily, Weekly, Year-to-Date & Top Trends
Smallcap Stocks With Best Up Trends [0-bearish to 100-bullish]: AlloVir [100], Cara [100], Assertio [100], Fuelcell Energy[100], B. Riley[100], Bandwidth [100], P.A.M. Transportation[100], Veritone [100], Parsons Corp[100], ACM Research[100], Bloom Energy[100]
Best Smallcap Stocks Year-to-Date:
FiscalNote [323.077%], Celcuity [315.842%], Immuneering Corp[265.158%], Precigen [253.704%], OptimizeRx Corp[241.267%], Bloom Energy[240.907%], CommScope Holding[215.891%], EchoStar Corp[215.648%], Centrus Energy[210.804%], 908 Devices[198.174%], Digital Turbine[194.886%] Best Smallcap Stocks This Week:
Textainer Group[258.475%], United Community[163.439%], Lakeland Bancorp[147.684%], Office Properties[146.649%], Dominion Midstream[118.502%], PDL BioPharma[112.645%], GTx [108.706%], Overseas Shipholding[77.0318%], PGT Innovations[65.2536%], Vimeo [60.9148%], Babcock & Wilcox Enterprises[53.2338%] Best Smallcap Stocks Daily:
AlloVir [16.9215%], Cara [14.3396%], Tyra Biosciences[14.26%], Zura Bio[13.71%], Assertio [12.692%], Fuelcell Energy[12.6657%], B. Riley[11.5556%], Bandwidth [10.7143%], Waldencast [10.6742%], Scilex Holding[10.6383%], P.A.M. Transportation[10.5477%]