
 Login Sign Up


| |||||
 |  | ||||

| 12Stocks.com Market Intelligence |
Best SmallCap Stocks
|
| In a hurry? Small Cap Stock Lists: Performance Trends Table, Stock Charts
Sort Small Cap stocks: Daily, Weekly, Year-to-Date, Market Cap & Trends. Filter Small Cap stocks list by sector: Show all, Tech, Finance, Energy, Staples, Retail, Industrial, Materials, Utilities and HealthCare Filter Small Cap stocks list by size: All Large Medium Small and MicroCap |
| 12Stocks.com Small Cap Stocks Performances & Trends Daily | |||||||||
|
|  The overall Smart Investing & Trading Score is 100 (0-bearish to 100-bullish) which puts Small Cap index in short term bullish trend. The Smart Investing & Trading Score from previous trading session is 93 and an improvement of trend continues.
| ||||||||
Here are the Smart Investing & Trading Scores of the most requested small cap stocks at 12Stocks.com (click stock name for detailed review):
|


| 12Stocks.com: Investing in Smallcap Index with Stocks | |
|
The following table helps investors and traders sort through current performance and trends (as measured by Smart Investing & Trading Score) of various
stocks in the Smallcap Index. Quick View: Move mouse or cursor over stock symbol (ticker) to view short-term technical chart and over stock name to view long term chart. Click on  to add stock symbol to your watchlist and to add stock symbol to your watchlist and  to view watchlist. Click on any ticker or stock name for detailed market intelligence report for that stock. to view watchlist. Click on any ticker or stock name for detailed market intelligence report for that stock. |
12Stocks.com Performance of Stocks in Smallcap Index
| Ticker | Stock Name | Watchlist | Category | Recent Price | Smart Investing & Trading Score | Change % | YTD Change% |
| CLDT | Chatham Lodging |   | Financials | 7.27 | 93 | 0.14% | -17.75% |
| CZNC | Citizens & Northern | | Financials | 20.10 | 100 | 1.77% | 9.50% |
| IBCP | Independent Bank | | Financials | 34.60 | 100 | 2.52% | 0.07% |
| WTBA | West Ban | | Financials | 21.09 | 100 | 1.88% | -1.48% |
| EQBK | Equity Bancshares | | Financials | 43.33 | 100 | 1.64% | 2.53% |
| SMBC | Southern Missouri | | Financials | 58.13 | 100 | 2.56% | 1.71% |
| OBIO | Orchestra BioMed | | Health Care | 2.89 | 52 | 0.35% | -27.75% |
| NEXT | NextDecade | | Energy | 9.14 | 100 | 2.24% | 18.55% |
| IIIN | Insteel Industries | | Materials | 39.23 | 100 | 0.51% | 45.41% |
| AFCG | AFC Gamma | | Financials | 4.70 | 67 | -0.42% | -41.36% |
| LE | Lands | | Services & Goods | 11.65 | 88 | 0.60% | -11.34% |
| TBBK | Bancorp | | Financials | 58.90 | 95 | 1.19% | 11.91% |
| CENX | Century Aluminum | | Materials | 18.85 | 85 | -0.11% | 3.46% |
| MITK | Mitek Systems | | Technology | 10.35 | 100 | 1.17% | -7.01% |
| CDZI | Cadiz | | Utilities | 3.17 | 83 | 3.59% | -39.04% |
| FNLC | First Bancorp | | Financials | 27.04 | 100 | 2.42% | 1.71% |
| BLFS | BioLife Solutions | | Health Care | 22.84 | 64 | 0.40% | -12.02% |
| BLFY | Blue Foundry | | Financials | 9.87 | 95 | 1.02% | 0.61% |
| BBCP | Concrete Pumping | | Industrials | 6.43 | 100 | 1.58% | 8.97% |
| MGNX | MacroGenics | | Health Care | 1.46 | 59 | 5.80% | -55.08% |
| BBSI | Barrett Business | | Services & Goods | 43.17 | 100 | 0.90% | -0.42% |
| KOS | Kosmos Energy | | Energy | 1.98 | 73 | 0.00% | -42.11% |
| VPG | Vishay Precision | | Technology | 29.58 | 100 | 1.09% | 26.03% |
| DCO | Ducommun | | Industrials | 84.91 | 85 | 2.49% | 33.38% |
| TDUP | ThredUp | | Services & Goods | 8.00 | 83 | 5.68% | 475.54% |
| For chart view version of above stock list: Chart View ➞ 0 - 25 , 25 - 50 , 50 - 75 , 75 - 100 , 100 - 125 , 125 - 150 , 150 - 175 , 175 - 200 , 200 - 225 , 225 - 250 , 250 - 275 , 275 - 300 , 300 - 325 , 325 - 350 , 350 - 375 , 375 - 400 , 400 - 425 , 425 - 450 , 450 - 475 , 475 - 500 , 500 - 525 , 525 - 550 , 550 - 575 , 575 - 600 , 600 - 625 , 625 - 650 , 650 - 675 , 675 - 700 , 700 - 725 , 725 - 750 , 750 - 775 , 775 - 800 , 800 - 825 , 825 - 850 , 850 - 875 , 875 - 900 , 900 - 925 , 925 - 950 , 950 - 975 , 975 - 1000 , 1000 - 1025 , 1025 - 1050 , 1050 - 1075 , 1075 - 1100 , 1100 - 1125 , 1125 - 1150 , 1150 - 1175 , 1175 - 1200 , 1200 - 1225 , 1225 - 1250 , 1250 - 1275 , 1275 - 1300 , 1300 - 1325 , 1325 - 1350 , 1350 - 1375 , 1375 - 1400 , 1400 - 1425 , 1425 - 1450 , 1450 - 1475 | ||
 | Click To Change The Sort Order: By Market Cap or Company Size Performance: Year-to-date, Week and Day |  |
| Too many stocks? View smallcap stocks filtered by marketcap & sector |
| Marketcap: All SmallCap Stocks (default-no microcap), Large, Mid-Range, Small |
| Smallcap Sector: Tech, Finance, Energy, Staples, Retail, Industrial, Materials, & Medical |
|
Get the most comprehensive stock market coverage daily at 12Stocks.com ➞ Best Stocks Today ➞ Best Stocks Weekly ➞ Best Stocks Year-to-Date ➞ Best Stocks Trends ➞  Best Stocks Today 12Stocks.com Best Nasdaq Stocks ➞ Best S&P 500 Stocks ➞ Best Tech Stocks ➞ Best Biotech Stocks ➞ |
| Detailed Overview of SmallCap Stocks |
| SmallCap Technical Overview, Leaders & Laggards, Top SmallCap ETF Funds & Detailed SmallCap Stocks List, Charts, Trends & More |
| Smallcap: Technical Analysis, Trends & YTD Performance | |
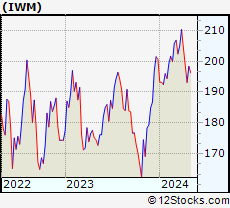
| SmallCap segment as represented by
IWM, an exchange-traded fund [ETF], holds basket of thousands of smallcap stocks from across all major sectors of the US stock market. The smallcap index (contains stocks like Riverbed & Sotheby's) is up by 1.19% and is currently underperforming the overall market by -5.47% year-to-date. Below is a quick view of technical charts and trends: | |
 IWM Weekly Chart |
|
| Long Term Trend: Very Good | |
| Medium Term Trend: Very Good | |
 IWM Daily Chart |
|
| Short Term Trend: Very Good | |
| Overall Trend Score: 100 | |
| YTD Performance: 1.19% | |
| **Trend Scores & Views Are Only For Educational Purposes And Not For Investing | |
| 12Stocks.com: Top Performing Small Cap Index Stocks | ||||||||||||||||||||||||||||||||||||||||||||||||
 The top performing Small Cap Index stocks year to date are
Now, more recently, over last week, the top performing Small Cap Index stocks on the move are


|
||||||||||||||||||||||||||||||||||||||||||||||||
| 12Stocks.com: Investing in Smallcap Index using Exchange Traded Funds | |
|
The following table shows list of key exchange traded funds (ETF) that
help investors track Smallcap index. The following list also includes leveraged ETF funds that track twice or thrice the daily returns of Smallcap indices. Short or inverse ETF funds move in the opposite direction to the index they track and are useful during market pullbacks or during bear markets. Quick View: Move mouse or cursor over ETF symbol (ticker) to view short-term technical chart and over ETF name to view long term chart. Click on ticker or stock name for detailed view. Click on to add stock symbol to your watchlist and to view watchlist. |
12Stocks.com List of ETFs that track Smallcap Index
| Ticker | ETF Name | Watchlist | Recent Price | Smart Investing & Trading Score | Change % | Week % | Year-to-date % |
| IWM | iShares Russell 2000 | | 223.08 | 100 | 0.93 | 3.53 | 1.19% |
| 12Stocks.com: Charts, Trends, Fundamental Data and Performances of SmallCap Stocks | |
|
We now take in-depth look at all SmallCap stocks including charts, multi-period performances and overall trends (as measured by Smart Investing & Trading Score). One can sort SmallCap stocks (click link to choose) by Daily, Weekly and by Year-to-Date performances. Also, one can sort by size of the company or by market capitalization. |
| Select Your Default Chart Type: | |||||
| |||||
| Click on stock symbol or name for detailed view. Click on to add stock symbol to your watchlist and to view watchlist. Quick View: Move mouse or cursor over "Daily" to quickly view daily technical stock chart and over "Weekly" to view weekly technical stock chart. | |||||

 | CLDT Chatham Lodging Trust |
| Sector: Financials | |
| SubSector: REIT - Hotel/Motel | |
| MarketCap: 274.734 Millions | |
| Recent Price: 7.27 Smart Investing & Trading Score: 93 | |
| Day Percent Change: 0.14% Day Change: 0.01 | |
| Week Change: 1.39% Year-to-date Change: -17.8% | |
| CLDT Links: Profile News Message Board | |
| Charts:- Daily , Weekly | |
| Add CLDT to Watchlist: View: Get Complete CLDT Trend Analysis ➞ | |
 | CZNC Citizens & Northern Corporation |
| Sector: Financials | |
| SubSector: Regional - Mid-Atlantic Banks | |
| MarketCap: 274.459 Millions | |
| Recent Price: 20.10 Smart Investing & Trading Score: 100 | |
| Day Percent Change: 1.77% Day Change: 0.35 | |
| Week Change: 4.85% Year-to-date Change: 9.5% | |
| CZNC Links: Profile News Message Board | |
| Charts:- Daily , Weekly | |
| Add CZNC to Watchlist: View: Get Complete CZNC Trend Analysis ➞ | |
 | IBCP Independent Bank Corporation |
| Sector: Financials | |
| SubSector: Regional - Midwest Banks | |
| MarketCap: 273.67 Millions | |
| Recent Price: 34.60 Smart Investing & Trading Score: 100 | |
| Day Percent Change: 2.52% Day Change: 0.85 | |
| Week Change: 6.07% Year-to-date Change: 0.1% | |
| IBCP Links: Profile News Message Board | |
| Charts:- Daily , Weekly | |
| Add IBCP to Watchlist: View: Get Complete IBCP Trend Analysis ➞ | |
 | WTBA West Bancorporation, Inc. |
| Sector: Financials | |
| SubSector: Regional - Southwest Banks | |
| MarketCap: 272.965 Millions | |
| Recent Price: 21.09 Smart Investing & Trading Score: 100 | |
| Day Percent Change: 1.88% Day Change: 0.39 | |
| Week Change: 6.03% Year-to-date Change: -1.5% | |
| WTBA Links: Profile News Message Board | |
| Charts:- Daily , Weekly | |
| Add WTBA to Watchlist: View: Get Complete WTBA Trend Analysis ➞ | |
 | EQBK Equity Bancshares, Inc. |
| Sector: Financials | |
| SubSector: Regional - Midwest Banks | |
| MarketCap: 272.87 Millions | |
| Recent Price: 43.33 Smart Investing & Trading Score: 100 | |
| Day Percent Change: 1.64% Day Change: 0.7 | |
| Week Change: 5.04% Year-to-date Change: 2.5% | |
| EQBK Links: Profile News Message Board | |
| Charts:- Daily , Weekly | |
| Add EQBK to Watchlist: View: Get Complete EQBK Trend Analysis ➞ | |
 | SMBC Southern Missouri Bancorp, Inc. |
| Sector: Financials | |
| SubSector: Savings & Loans | |
| MarketCap: 272.53 Millions | |
| Recent Price: 58.13 Smart Investing & Trading Score: 100 | |
| Day Percent Change: 2.56% Day Change: 1.45 | |
| Week Change: 6.48% Year-to-date Change: 1.7% | |
| SMBC Links: Profile News Message Board | |
| Charts:- Daily , Weekly | |
| Add SMBC to Watchlist: View: Get Complete SMBC Trend Analysis ➞ | |
 | OBIO Orchestra BioMed Holdings, Inc. |
| Sector: Health Care | |
| SubSector: Biotechnology | |
| MarketCap: 271 Millions | |
| Recent Price: 2.89 Smart Investing & Trading Score: 52 | |
| Day Percent Change: 0.35% Day Change: 0.01 | |
| Week Change: 3.96% Year-to-date Change: -27.8% | |
| OBIO Links: Profile News Message Board | |
| Charts:- Daily , Weekly | |
| Add OBIO to Watchlist: View: Get Complete OBIO Trend Analysis ➞ | |
 | NEXT NextDecade Corporation |
| Sector: Energy | |
| SubSector: Independent Oil & Gas | |
| MarketCap: 270.893 Millions | |
| Recent Price: 9.14 Smart Investing & Trading Score: 100 | |
| Day Percent Change: 2.24% Day Change: 0.2 | |
| Week Change: 5.18% Year-to-date Change: 18.6% | |
| NEXT Links: Profile News Message Board | |
| Charts:- Daily , Weekly | |
| Add NEXT to Watchlist: View: Get Complete NEXT Trend Analysis ➞ | |
 | IIIN Insteel Industries, Inc. |
| Sector: Materials | |
| SubSector: Steel & Iron | |
| MarketCap: 269.488 Millions | |
| Recent Price: 39.23 Smart Investing & Trading Score: 100 | |
| Day Percent Change: 0.51% Day Change: 0.2 | |
| Week Change: 3.92% Year-to-date Change: 45.4% | |
| IIIN Links: Profile News Message Board | |
| Charts:- Daily , Weekly | |
| Add IIIN to Watchlist: View: Get Complete IIIN Trend Analysis ➞ | |
 | AFCG AFC Gamma, Inc. |
| Sector: Financials | |
| SubSector: REIT - Specialty | |
| MarketCap: 269 Millions | |
| Recent Price: 4.70 Smart Investing & Trading Score: 67 | |
| Day Percent Change: -0.42% Day Change: -0.02 | |
| Week Change: -1.26% Year-to-date Change: -41.4% | |
| AFCG Links: Profile News Message Board | |
| Charts:- Daily , Weekly | |
| Add AFCG to Watchlist: View: Get Complete AFCG Trend Analysis ➞ | |
 | LE Lands End, Inc. |
| Sector: Services & Goods | |
| SubSector: Catalog & Mail Order Houses | |
| MarketCap: 268.692 Millions | |
| Recent Price: 11.65 Smart Investing & Trading Score: 88 | |
| Day Percent Change: 0.6% Day Change: 0.07 | |
| Week Change: 10.11% Year-to-date Change: -11.3% | |
| LE Links: Profile News Message Board | |
| Charts:- Daily , Weekly | |
| Add LE to Watchlist: View: Get Complete LE Trend Analysis ➞ | |
 | TBBK The Bancorp, Inc. |
| Sector: Financials | |
| SubSector: Regional - Mid-Atlantic Banks | |
| MarketCap: 267.859 Millions | |
| Recent Price: 58.90 Smart Investing & Trading Score: 95 | |
| Day Percent Change: 1.19% Day Change: 0.69 | |
| Week Change: 3.13% Year-to-date Change: 11.9% | |
| TBBK Links: Profile News Message Board | |
| Charts:- Daily , Weekly | |
| Add TBBK to Watchlist: View: Get Complete TBBK Trend Analysis ➞ | |
 | CENX Century Aluminum Company |
| Sector: Materials | |
| SubSector: Aluminum | |
| MarketCap: 266.408 Millions | |
| Recent Price: 18.85 Smart Investing & Trading Score: 85 | |
| Day Percent Change: -0.11% Day Change: -0.02 | |
| Week Change: 4.43% Year-to-date Change: 3.5% | |
| CENX Links: Profile News Message Board | |
| Charts:- Daily , Weekly | |
| Add CENX to Watchlist: View: Get Complete CENX Trend Analysis ➞ | |
 | MITK Mitek Systems, Inc. |
| Sector: Technology | |
| SubSector: Application Software | |
| MarketCap: 265.962 Millions | |
| Recent Price: 10.35 Smart Investing & Trading Score: 100 | |
| Day Percent Change: 1.17% Day Change: 0.12 | |
| Week Change: 5.08% Year-to-date Change: -7.0% | |
| MITK Links: Profile News Message Board | |
| Charts:- Daily , Weekly | |
| Add MITK to Watchlist: View: Get Complete MITK Trend Analysis ➞ | |
 | CDZI Cadiz Inc. |
| Sector: Utilities | |
| SubSector: Water Utilities | |
| MarketCap: 265.502 Millions | |
| Recent Price: 3.17 Smart Investing & Trading Score: 83 | |
| Day Percent Change: 3.59% Day Change: 0.11 | |
| Week Change: 1.6% Year-to-date Change: -39.0% | |
| CDZI Links: Profile News Message Board | |
| Charts:- Daily , Weekly | |
| Add CDZI to Watchlist: View: Get Complete CDZI Trend Analysis ➞ | |
 | FNLC The First Bancorp, Inc. |
| Sector: Financials | |
| SubSector: Regional - Northeast Banks | |
| MarketCap: 264.799 Millions | |
| Recent Price: 27.04 Smart Investing & Trading Score: 100 | |
| Day Percent Change: 2.42% Day Change: 0.64 | |
| Week Change: 6.67% Year-to-date Change: 1.7% | |
| FNLC Links: Profile News Message Board | |
| Charts:- Daily , Weekly | |
| Add FNLC to Watchlist: View: Get Complete FNLC Trend Analysis ➞ | |
 | BLFS BioLife Solutions, Inc. |
| Sector: Health Care | |
| SubSector: Medical Instruments & Supplies | |
| MarketCap: 264.36 Millions | |
| Recent Price: 22.84 Smart Investing & Trading Score: 64 | |
| Day Percent Change: 0.4% Day Change: 0.09 | |
| Week Change: 6.28% Year-to-date Change: -12.0% | |
| BLFS Links: Profile News Message Board | |
| Charts:- Daily , Weekly | |
| Add BLFS to Watchlist: View: Get Complete BLFS Trend Analysis ➞ | |
 | BLFY Blue Foundry Bancorp |
| Sector: Financials | |
| SubSector: Banks - Regional | |
| MarketCap: 264 Millions | |
| Recent Price: 9.87 Smart Investing & Trading Score: 95 | |
| Day Percent Change: 1.02% Day Change: 0.1 | |
| Week Change: 1.75% Year-to-date Change: 0.6% | |
| BLFY Links: Profile News Message Board | |
| Charts:- Daily , Weekly | |
| Add BLFY to Watchlist: View: Get Complete BLFY Trend Analysis ➞ | |
 | BBCP Concrete Pumping Holdings, Inc. |
| Sector: Industrials | |
| SubSector: General Building Materials | |
| MarketCap: 263.653 Millions | |
| Recent Price: 6.43 Smart Investing & Trading Score: 100 | |
| Day Percent Change: 1.58% Day Change: 0.1 | |
| Week Change: 3.21% Year-to-date Change: 9.0% | |
| BBCP Links: Profile News Message Board | |
| Charts:- Daily , Weekly | |
| Add BBCP to Watchlist: View: Get Complete BBCP Trend Analysis ➞ | |
 | MGNX MacroGenics, Inc. |
| Sector: Health Care | |
| SubSector: Biotechnology | |
| MarketCap: 262.785 Millions | |
| Recent Price: 1.46 Smart Investing & Trading Score: 59 | |
| Day Percent Change: 5.8% Day Change: 0.08 | |
| Week Change: 22.69% Year-to-date Change: -55.1% | |
| MGNX Links: Profile News Message Board | |
| Charts:- Daily , Weekly | |
| Add MGNX to Watchlist: View: Get Complete MGNX Trend Analysis ➞ | |
 | BBSI Barrett Business Services, Inc. |
| Sector: Services & Goods | |
| SubSector: Staffing & Outsourcing Services | |
| MarketCap: 262.028 Millions | |
| Recent Price: 43.17 Smart Investing & Trading Score: 100 | |
| Day Percent Change: 0.9% Day Change: 0.38 | |
| Week Change: 3.06% Year-to-date Change: -0.4% | |
| BBSI Links: Profile News Message Board | |
| Charts:- Daily , Weekly | |
| Add BBSI to Watchlist: View: Get Complete BBSI Trend Analysis ➞ | |
 | KOS Kosmos Energy Ltd. |
| Sector: Energy | |
| SubSector: Independent Oil & Gas | |
| MarketCap: 261.693 Millions | |
| Recent Price: 1.98 Smart Investing & Trading Score: 73 | |
| Day Percent Change: 0% Day Change: 0 | |
| Week Change: 8.2% Year-to-date Change: -42.1% | |
| KOS Links: Profile News Message Board | |
| Charts:- Daily , Weekly | |
| Add KOS to Watchlist: View: Get Complete KOS Trend Analysis ➞ | |
 | VPG Vishay Precision Group, Inc. |
| Sector: Technology | |
| SubSector: Scientific & Technical Instruments | |
| MarketCap: 261.553 Millions | |
| Recent Price: 29.58 Smart Investing & Trading Score: 100 | |
| Day Percent Change: 1.09% Day Change: 0.32 | |
| Week Change: 4.49% Year-to-date Change: 26.0% | |
| VPG Links: Profile News Message Board | |
| Charts:- Daily , Weekly | |
| Add VPG to Watchlist: View: Get Complete VPG Trend Analysis ➞ | |
 | DCO Ducommun Incorporated |
| Sector: Industrials | |
| SubSector: Aerospace/Defense Products & Services | |
| MarketCap: 261.101 Millions | |
| Recent Price: 84.91 Smart Investing & Trading Score: 85 | |
| Day Percent Change: 2.49% Day Change: 2.06 | |
| Week Change: -1.58% Year-to-date Change: 33.4% | |
| DCO Links: Profile News Message Board | |
| Charts:- Daily , Weekly | |
| Add DCO to Watchlist: View: Get Complete DCO Trend Analysis ➞ | |
 | TDUP ThredUp Inc. |
| Sector: Services & Goods | |
| SubSector: Internet Retail | |
| MarketCap: 258 Millions | |
| Recent Price: 8.00 Smart Investing & Trading Score: 83 | |
| Day Percent Change: 5.68% Day Change: 0.43 | |
| Week Change: 7.38% Year-to-date Change: 475.5% | |
| TDUP Links: Profile News Message Board | |
| Charts:- Daily , Weekly | |
| Add TDUP to Watchlist: View: Get Complete TDUP Trend Analysis ➞ | |
| For tabular summary view of above stock list: Summary View ➞ 0 - 25 , 25 - 50 , 50 - 75 , 75 - 100 , 100 - 125 , 125 - 150 , 150 - 175 , 175 - 200 , 200 - 225 , 225 - 250 , 250 - 275 , 275 - 300 , 300 - 325 , 325 - 350 , 350 - 375 , 375 - 400 , 400 - 425 , 425 - 450 , 450 - 475 , 475 - 500 , 500 - 525 , 525 - 550 , 550 - 575 , 575 - 600 , 600 - 625 , 625 - 650 , 650 - 675 , 675 - 700 , 700 - 725 , 725 - 750 , 750 - 775 , 775 - 800 , 800 - 825 , 825 - 850 , 850 - 875 , 875 - 900 , 900 - 925 , 925 - 950 , 950 - 975 , 975 - 1000 , 1000 - 1025 , 1025 - 1050 , 1050 - 1075 , 1075 - 1100 , 1100 - 1125 , 1125 - 1150 , 1150 - 1175 , 1175 - 1200 , 1200 - 1225 , 1225 - 1250 , 1250 - 1275 , 1275 - 1300 , 1300 - 1325 , 1325 - 1350 , 1350 - 1375 , 1375 - 1400 , 1400 - 1425 , 1425 - 1450 , 1450 - 1475 | ||
| Click To Change The Sort Order: By Market Cap or Company Size Performance: Year-to-date, Week and Day | |
| Select Chart Type: | ||
| Too many stocks? View smallcap stocks filtered by marketcap & sector |
| Marketcap: All SmallCap Stocks (default-no microcap), Large, Mid-Range, Small & MicroCap |
| Sector: Tech, Finance, Energy, Staples, Retail, Industrial, Materials, Utilities & Medical |
|
Best Stocks Today 12Stocks.com |
© 2025 12Stocks.com Terms & Conditions Privacy Contact Us
All Information Provided Only For Education And Not To Be Used For Investing or Trading. See Terms & Conditions


One More Thing ... Get Best Stocks Delivered Daily!
Never Ever Miss A Move With Our Top Ten Stocks Lists
Find Best Stocks In Any Market - Bull or Bear Market
Take A Peek At Our Top Ten Stocks Lists: Daily, Weekly, Year-to-Date & Top Trends
Find Best Stocks In Any Market - Bull or Bear Market
Take A Peek At Our Top Ten Stocks Lists: Daily, Weekly, Year-to-Date & Top Trends
Smallcap Stocks With Best Up Trends [0-bearish to 100-bullish]: Xponential Fitness[100], Fluence Energy[100], Agenus [100], Shoals [100], Sana [100], EVI Industries[100], Verrica [100], Kingsway Financial[100], Nextracker [100], Summit [100], MeiraGTx [100]
Best Smallcap Stocks Year-to-Date:
System1 [572.38%], ThredUp [475.54%], RAPT [409.49%], Digital Turbine[256.8%], 908 Devices[202.27%], OptimizeRx [176.34%], PaySign [168.21%], Centrus Energy[163.7%], X4 [157.49%], National Vision[129.37%], Agenus [121.53%] Best Smallcap Stocks This Week:
FiscalNote [55.83%], Cipher Mining[42.02%], Tilly s[38.4%], Fluence Energy[36.97%], Altimmune [36%], Verrica [35.23%], Commercial Vehicle[32.89%], Xponential Fitness[32.89%], BigBear.ai [32.71%], Energy Vault[30.73%], Ispire [29.57%] Best Smallcap Stocks Daily:
Xponential Fitness[35.39%], Olo [13.58%], Fluence Energy[12.43%], Array [11.93%], Planet Labs[11.56%], Agenus [10.16%], Weave [10.15%], ProKidney [10.11%], Priority [10.03%], Shoals [9.32%], Sana [9.25%]