
 Login Sign Up


| |||||
 |  | ||||

| 12Stocks.com Market Intelligence |
Best SmallCap Stocks
|
| In a hurry? Small Cap Stock Lists: Performance Trends Table, Stock Charts
Sort Small Cap stocks: Daily, Weekly, Year-to-Date, Market Cap & Trends. Filter Small Cap stocks list by sector: Show all, Tech, Finance, Energy, Staples, Retail, Industrial, Materials, Utilities and HealthCare Filter Small Cap stocks list by size: All Large Medium Small and MicroCap |
| 12Stocks.com Small Cap Stocks Performances & Trends Daily | |||||||||
|
|  The overall Smart Investing & Trading Score is 76 (0-bearish to 100-bullish) which puts Small Cap index in short term neutral to bullish trend. The Smart Investing & Trading Score from previous trading session is 100 and hence a deterioration of trend.
| ||||||||
Here are the Smart Investing & Trading Scores of the most requested small cap stocks at 12Stocks.com (click stock name for detailed review):
|


| 12Stocks.com: Investing in Smallcap Index with Stocks | |
|
The following table helps investors and traders sort through current performance and trends (as measured by Smart Investing & Trading Score) of various
stocks in the Smallcap Index. Quick View: Move mouse or cursor over stock symbol (ticker) to view short-term technical chart and over stock name to view long term chart. Click on  to add stock symbol to your watchlist and to add stock symbol to your watchlist and  to view watchlist. Click on any ticker or stock name for detailed market intelligence report for that stock. to view watchlist. Click on any ticker or stock name for detailed market intelligence report for that stock. |
12Stocks.com Performance of Stocks in Smallcap Index
| Ticker | Stock Name | Watchlist | Category | Recent Price | Smart Investing & Trading Score | Change % | YTD Change% |
| GPI | Group 1 |   | Services & Goods | 477.22 | 95 | -0.61% | 13.35% |
| WHD | Cactus | | Energy | 45.90 | 93 | -0.17% | -21.16% |
| PMT | PennyMac Mortgage | | Financials | 12.59 | 15 | -4.19% | 3.27% |
| ALTI | AlTi Global | | Financials | 4.07 | 44 | -0.25% | -7.71% |
| SKY | Skyline Champion | | Industrials | 66.59 | 54 | -1.84% | -24.42% |
| BKE | Buckle | | Services & Goods | 47.35 | 71 | 0.51% | -0.38% |
| MD | MEDNAX | | Health Care | 13.12 | 26 | -2.81% | 0.00% |
| ATI | Allegheny | | Industrials | 89.31 | 90 | 1.43% | 62.26% |
| FBP | First Ban | | Financials | 22.03 | 95 | 1.01% | 19.57% |
| SMP | Standard Motor | | Consumer Staples | 32.91 | 63 | -1.88% | 7.30% |
| EGBN | Eagle Bancorp | | Financials | 21.01 | 76 | -1.41% | -18.79% |
| LKFN | Lakeland Financial | | Financials | 65.04 | 83 | -1.00% | -3.82% |
| ROAD | Construction Partners | | Industrials | 105.23 | 78 | -0.03% | 18.96% |
| FCF | First Commonwealth | | Financials | 17.00 | 83 | -1.05% | 1.24% |
| JBSS | John B. | | Consumer Staples | 67.38 | 88 | 0.30% | -22.65% |
| RCKT | Rocket | | Health Care | 2.96 | 42 | -6.33% | -76.45% |
| YMAB | Y-mAbs | | Health Care | 4.36 | 66 | -3.54% | -44.32% |
| AMRC | Ameresco | | Services & Goods | 17.96 | 100 | 1.13% | -23.51% |
| WALD | Waldencast | | Technology | 2.54 | 42 | -1.17% | -36.82% |
| WGO | Winnebago Industries | | Consumer Staples | 33.33 | 100 | -0.24% | -28.94% |
| BRKL | Brookline Bancorp | | Financials | 11.00 | 63 | -1.61% | -5.75% |
| SES | SES AI | | Services & Goods | 0.93 | 90 | -2.38% | -57.64% |
| RXST | RxSight | | Health Care | 8.00 | 17 | -5.44% | -76.73% |
| FLR | Fluor | | Industrials | 52.27 | 95 | 0.44% | 5.98% |
| SFL | SFL | | Transports | 9.19 | 100 | 1.55% | -7.14% |
| For chart view version of above stock list: Chart View ➞ 0 - 25 , 25 - 50 , 50 - 75 , 75 - 100 , 100 - 125 , 125 - 150 , 150 - 175 , 175 - 200 , 200 - 225 , 225 - 250 , 250 - 275 , 275 - 300 , 300 - 325 , 325 - 350 , 350 - 375 , 375 - 400 , 400 - 425 , 425 - 450 , 450 - 475 , 475 - 500 , 500 - 525 , 525 - 550 , 550 - 575 , 575 - 600 , 600 - 625 , 625 - 650 , 650 - 675 , 675 - 700 , 700 - 725 , 725 - 750 , 750 - 775 , 775 - 800 , 800 - 825 , 825 - 850 , 850 - 875 , 875 - 900 , 900 - 925 , 925 - 950 , 950 - 975 , 975 - 1000 , 1000 - 1025 , 1025 - 1050 , 1050 - 1075 , 1075 - 1100 , 1100 - 1125 , 1125 - 1150 , 1150 - 1175 , 1175 - 1200 , 1200 - 1225 , 1225 - 1250 , 1250 - 1275 , 1275 - 1300 , 1300 - 1325 , 1325 - 1350 , 1350 - 1375 , 1375 - 1400 , 1400 - 1425 , 1425 - 1450 , 1450 - 1475 | ||
 | Click To Change The Sort Order: By Market Cap or Company Size Performance: Year-to-date, Week and Day |  |
| Too many stocks? View smallcap stocks filtered by marketcap & sector |
| Marketcap: All SmallCap Stocks (default-no microcap), Large, Mid-Range, Small |
| Smallcap Sector: Tech, Finance, Energy, Staples, Retail, Industrial, Materials, & Medical |
|
Get the most comprehensive stock market coverage daily at 12Stocks.com ➞ Best Stocks Today ➞ Best Stocks Weekly ➞ Best Stocks Year-to-Date ➞ Best Stocks Trends ➞  Best Stocks Today 12Stocks.com Best Nasdaq Stocks ➞ Best S&P 500 Stocks ➞ Best Tech Stocks ➞ Best Biotech Stocks ➞ |
| Detailed Overview of SmallCap Stocks |
| SmallCap Technical Overview, Leaders & Laggards, Top SmallCap ETF Funds & Detailed SmallCap Stocks List, Charts, Trends & More |
| Smallcap: Technical Analysis, Trends & YTD Performance | |
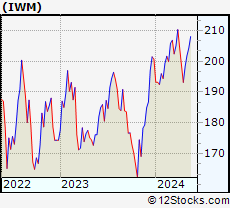
| SmallCap segment as represented by
IWM, an exchange-traded fund [ETF], holds basket of thousands of smallcap stocks from across all major sectors of the US stock market. The smallcap index (contains stocks like Riverbed & Sotheby's) is up by 0.56% and is currently underperforming the overall market by -5.75% year-to-date. Below is a quick view of technical charts and trends: | |
 IWM Weekly Chart |
|
| Long Term Trend: Very Good | |
| Medium Term Trend: Very Good | |
 IWM Daily Chart |
|
| Short Term Trend: Good | |
| Overall Trend Score: 76 | |
| YTD Performance: 0.56% | |
| **Trend Scores & Views Are Only For Educational Purposes And Not For Investing | |
| 12Stocks.com: Top Performing Small Cap Index Stocks | ||||||||||||||||||||||||||||||||||||||||||||||||
 The top performing Small Cap Index stocks year to date are
Now, more recently, over last week, the top performing Small Cap Index stocks on the move are


|
||||||||||||||||||||||||||||||||||||||||||||||||
| 12Stocks.com: Investing in Smallcap Index using Exchange Traded Funds | |
|
The following table shows list of key exchange traded funds (ETF) that
help investors track Smallcap index. The following list also includes leveraged ETF funds that track twice or thrice the daily returns of Smallcap indices. Short or inverse ETF funds move in the opposite direction to the index they track and are useful during market pullbacks or during bear markets. Quick View: Move mouse or cursor over ETF symbol (ticker) to view short-term technical chart and over ETF name to view long term chart. Click on ticker or stock name for detailed view. Click on to add stock symbol to your watchlist and to view watchlist. |
12Stocks.com List of ETFs that track Smallcap Index
| Ticker | ETF Name | Watchlist | Recent Price | Smart Investing & Trading Score | Change % | Week % | Year-to-date % |
| IWM | iShares Russell 2000 | | 221.70 | 76 | -1.38 | -0.62 | 0.56% |
| 12Stocks.com: Charts, Trends, Fundamental Data and Performances of SmallCap Stocks | |
|
We now take in-depth look at all SmallCap stocks including charts, multi-period performances and overall trends (as measured by Smart Investing & Trading Score). One can sort SmallCap stocks (click link to choose) by Daily, Weekly and by Year-to-Date performances. Also, one can sort by size of the company or by market capitalization. |
| Select Your Default Chart Type: | |||||
| |||||
| Click on stock symbol or name for detailed view. Click on to add stock symbol to your watchlist and to view watchlist. Quick View: Move mouse or cursor over "Daily" to quickly view daily technical stock chart and over "Weekly" to view weekly technical stock chart. | |||||

 | GPI Group 1 Automotive, Inc. |
| Sector: Services & Goods | |
| SubSector: Auto Dealerships | |
| MarketCap: 921.021 Millions | |
| Recent Price: 477.22 Smart Investing & Trading Score: 95 | |
| Day Percent Change: -0.61% Day Change: -2.91 | |
| Week Change: 2.41% Year-to-date Change: 13.4% | |
| GPI Links: Profile News Message Board | |
| Charts:- Daily , Weekly | |
| Add GPI to Watchlist: View: Get Complete GPI Trend Analysis ➞ | |
 | WHD Cactus, Inc. |
| Sector: Energy | |
| SubSector: Oil & Gas Equipment & Services | |
| MarketCap: 920.261 Millions | |
| Recent Price: 45.90 Smart Investing & Trading Score: 93 | |
| Day Percent Change: -0.17% Day Change: -0.08 | |
| Week Change: 1.39% Year-to-date Change: -21.2% | |
| WHD Links: Profile News Message Board | |
| Charts:- Daily , Weekly | |
| Add WHD to Watchlist: View: Get Complete WHD Trend Analysis ➞ | |
 | PMT PennyMac Mortgage Investment Trust |
| Sector: Financials | |
| SubSector: Mortgage Investment | |
| MarketCap: 917.639 Millions | |
| Recent Price: 12.59 Smart Investing & Trading Score: 15 | |
| Day Percent Change: -4.19% Day Change: -0.55 | |
| Week Change: -4.84% Year-to-date Change: 3.3% | |
| PMT Links: Profile News Message Board | |
| Charts:- Daily , Weekly | |
| Add PMT to Watchlist: View: Get Complete PMT Trend Analysis ➞ | |
 | ALTI AlTi Global, Inc. |
| Sector: Financials | |
| SubSector: Asset Management | |
| MarketCap: 917 Millions | |
| Recent Price: 4.07 Smart Investing & Trading Score: 44 | |
| Day Percent Change: -0.25% Day Change: -0.01 | |
| Week Change: -1.69% Year-to-date Change: -7.7% | |
| ALTI Links: Profile News Message Board | |
| Charts:- Daily , Weekly | |
| Add ALTI to Watchlist: View: Get Complete ALTI Trend Analysis ➞ | |
 | SKY Skyline Champion Corporation |
| Sector: Industrials | |
| SubSector: Manufactured Housing | |
| MarketCap: 915.145 Millions | |
| Recent Price: 66.59 Smart Investing & Trading Score: 54 | |
| Day Percent Change: -1.84% Day Change: -1.25 | |
| Week Change: -0.48% Year-to-date Change: -24.4% | |
| SKY Links: Profile News Message Board | |
| Charts:- Daily , Weekly | |
| Add SKY to Watchlist: View: Get Complete SKY Trend Analysis ➞ | |
 | BKE The Buckle, Inc. |
| Sector: Services & Goods | |
| SubSector: Apparel Stores | |
| MarketCap: 913.808 Millions | |
| Recent Price: 47.35 Smart Investing & Trading Score: 71 | |
| Day Percent Change: 0.51% Day Change: 0.24 | |
| Week Change: -0.65% Year-to-date Change: -0.4% | |
| BKE Links: Profile News Message Board | |
| Charts:- Daily , Weekly | |
| Add BKE to Watchlist: View: Get Complete BKE Trend Analysis ➞ | |
 | MD MEDNAX, Inc. |
| Sector: Health Care | |
| SubSector: Specialized Health Services | |
| MarketCap: 913.656 Millions | |
| Recent Price: 13.12 Smart Investing & Trading Score: 26 | |
| Day Percent Change: -2.81% Day Change: -0.38 | |
| Week Change: -4.79% Year-to-date Change: 0.0% | |
| MD Links: Profile News Message Board | |
| Charts:- Daily , Weekly | |
| Add MD to Watchlist: View: Get Complete MD Trend Analysis ➞ | |
 | ATI Allegheny Technologies Incorporated |
| Sector: Industrials | |
| SubSector: Metal Fabrication | |
| MarketCap: 913.35 Millions | |
| Recent Price: 89.31 Smart Investing & Trading Score: 90 | |
| Day Percent Change: 1.43% Day Change: 1.26 | |
| Week Change: 2.83% Year-to-date Change: 62.3% | |
| ATI Links: Profile News Message Board | |
| Charts:- Daily , Weekly | |
| Add ATI to Watchlist: View: Get Complete ATI Trend Analysis ➞ | |
 | FBP First BanCorp. |
| Sector: Financials | |
| SubSector: Foreign Regional Banks | |
| MarketCap: 913.079 Millions | |
| Recent Price: 22.03 Smart Investing & Trading Score: 95 | |
| Day Percent Change: 1.01% Day Change: 0.22 | |
| Week Change: 0.46% Year-to-date Change: 19.6% | |
| FBP Links: Profile News Message Board | |
| Charts:- Daily , Weekly | |
| Add FBP to Watchlist: View: Get Complete FBP Trend Analysis ➞ | |
 | SMP Standard Motor Products, Inc. |
| Sector: Consumer Staples | |
| SubSector: Auto Parts | |
| MarketCap: 909.939 Millions | |
| Recent Price: 32.91 Smart Investing & Trading Score: 63 | |
| Day Percent Change: -1.88% Day Change: -0.63 | |
| Week Change: -1.56% Year-to-date Change: 7.3% | |
| SMP Links: Profile News Message Board | |
| Charts:- Daily , Weekly | |
| Add SMP to Watchlist: View: Get Complete SMP Trend Analysis ➞ | |
 | EGBN Eagle Bancorp, Inc. |
| Sector: Financials | |
| SubSector: Regional - Mid-Atlantic Banks | |
| MarketCap: 906.559 Millions | |
| Recent Price: 21.01 Smart Investing & Trading Score: 76 | |
| Day Percent Change: -1.41% Day Change: -0.3 | |
| Week Change: 0.86% Year-to-date Change: -18.8% | |
| EGBN Links: Profile News Message Board | |
| Charts:- Daily , Weekly | |
| Add EGBN to Watchlist: View: Get Complete EGBN Trend Analysis ➞ | |
 | LKFN Lakeland Financial Corporation |
| Sector: Financials | |
| SubSector: Regional - Midwest Banks | |
| MarketCap: 903.27 Millions | |
| Recent Price: 65.04 Smart Investing & Trading Score: 83 | |
| Day Percent Change: -1% Day Change: -0.66 | |
| Week Change: -0.32% Year-to-date Change: -3.8% | |
| LKFN Links: Profile News Message Board | |
| Charts:- Daily , Weekly | |
| Add LKFN to Watchlist: View: Get Complete LKFN Trend Analysis ➞ | |
 | ROAD Construction Partners, Inc. |
| Sector: Industrials | |
| SubSector: Heavy Construction | |
| MarketCap: 903.095 Millions | |
| Recent Price: 105.23 Smart Investing & Trading Score: 78 | |
| Day Percent Change: -0.03% Day Change: -0.03 | |
| Week Change: -2.91% Year-to-date Change: 19.0% | |
| ROAD Links: Profile News Message Board | |
| Charts:- Daily , Weekly | |
| Add ROAD to Watchlist: View: Get Complete ROAD Trend Analysis ➞ | |
 | FCF First Commonwealth Financial Corporation |
| Sector: Financials | |
| SubSector: Regional - Northeast Banks | |
| MarketCap: 900.299 Millions | |
| Recent Price: 17.00 Smart Investing & Trading Score: 83 | |
| Day Percent Change: -1.05% Day Change: -0.18 | |
| Week Change: -1.51% Year-to-date Change: 1.2% | |
| FCF Links: Profile News Message Board | |
| Charts:- Daily , Weekly | |
| Add FCF to Watchlist: View: Get Complete FCF Trend Analysis ➞ | |
 | JBSS John B. Sanfilippo & Son, Inc. |
| Sector: Consumer Staples | |
| SubSector: Processed & Packaged Goods | |
| MarketCap: 899.748 Millions | |
| Recent Price: 67.38 Smart Investing & Trading Score: 88 | |
| Day Percent Change: 0.3% Day Change: 0.2 | |
| Week Change: 1.92% Year-to-date Change: -22.7% | |
| JBSS Links: Profile News Message Board | |
| Charts:- Daily , Weekly | |
| Add JBSS to Watchlist: View: Get Complete JBSS Trend Analysis ➞ | |
 | RCKT Rocket Pharmaceuticals, Inc. |
| Sector: Health Care | |
| SubSector: Biotechnology | |
| MarketCap: 899.585 Millions | |
| Recent Price: 2.96 Smart Investing & Trading Score: 42 | |
| Day Percent Change: -6.33% Day Change: -0.2 | |
| Week Change: 2.07% Year-to-date Change: -76.5% | |
| RCKT Links: Profile News Message Board | |
| Charts:- Daily , Weekly | |
| Add RCKT to Watchlist: View: Get Complete RCKT Trend Analysis ➞ | |
 | YMAB Y-mAbs Therapeutics, Inc. |
| Sector: Health Care | |
| SubSector: Biotechnology | |
| MarketCap: 899.585 Millions | |
| Recent Price: 4.36 Smart Investing & Trading Score: 66 | |
| Day Percent Change: -3.54% Day Change: -0.16 | |
| Week Change: 1.4% Year-to-date Change: -44.3% | |
| YMAB Links: Profile News Message Board | |
| Charts:- Daily , Weekly | |
| Add YMAB to Watchlist: View: Get Complete YMAB Trend Analysis ➞ | |
 | AMRC Ameresco, Inc. |
| Sector: Services & Goods | |
| SubSector: Technical Services | |
| MarketCap: 898.91 Millions | |
| Recent Price: 17.96 Smart Investing & Trading Score: 100 | |
| Day Percent Change: 1.13% Day Change: 0.2 | |
| Week Change: 6.84% Year-to-date Change: -23.5% | |
| AMRC Links: Profile News Message Board | |
| Charts:- Daily , Weekly | |
| Add AMRC to Watchlist: View: Get Complete AMRC Trend Analysis ➞ | |
 | WALD Waldencast plc |
| Sector: Technology | |
| SubSector: Software - Application | |
| MarketCap: 897 Millions | |
| Recent Price: 2.54 Smart Investing & Trading Score: 42 | |
| Day Percent Change: -1.17% Day Change: -0.03 | |
| Week Change: -9.93% Year-to-date Change: -36.8% | |
| WALD Links: Profile News Message Board | |
| Charts:- Daily , Weekly | |
| Add WALD to Watchlist: View: Get Complete WALD Trend Analysis ➞ | |
 | WGO Winnebago Industries, Inc. |
| Sector: Consumer Staples | |
| SubSector: Recreational Vehicles | |
| MarketCap: 896.559 Millions | |
| Recent Price: 33.33 Smart Investing & Trading Score: 100 | |
| Day Percent Change: -0.24% Day Change: -0.08 | |
| Week Change: 5.71% Year-to-date Change: -28.9% | |
| WGO Links: Profile News Message Board | |
| Charts:- Daily , Weekly | |
| Add WGO to Watchlist: View: Get Complete WGO Trend Analysis ➞ | |
 | BRKL Brookline Bancorp, Inc. |
| Sector: Financials | |
| SubSector: Savings & Loans | |
| MarketCap: 894.43 Millions | |
| Recent Price: 11.00 Smart Investing & Trading Score: 63 | |
| Day Percent Change: -1.61% Day Change: -0.18 | |
| Week Change: -2.65% Year-to-date Change: -5.8% | |
| BRKL Links: Profile News Message Board | |
| Charts:- Daily , Weekly | |
| Add BRKL to Watchlist: View: Get Complete BRKL Trend Analysis ➞ | |
 | SES SES AI Corporation |
| Sector: Services & Goods | |
| SubSector: Auto Parts | |
| MarketCap: 893 Millions | |
| Recent Price: 0.93 Smart Investing & Trading Score: 90 | |
| Day Percent Change: -2.38% Day Change: -0.02 | |
| Week Change: 5.16% Year-to-date Change: -57.6% | |
| SES Links: Profile News Message Board | |
| Charts:- Daily , Weekly | |
| Add SES to Watchlist: View: Get Complete SES Trend Analysis ➞ | |
 | RXST RxSight, Inc. |
| Sector: Health Care | |
| SubSector: Medical Devices | |
| MarketCap: 893 Millions | |
| Recent Price: 8.00 Smart Investing & Trading Score: 17 | |
| Day Percent Change: -5.44% Day Change: -0.46 | |
| Week Change: -38.7% Year-to-date Change: -76.7% | |
| RXST Links: Profile News Message Board | |
| Charts:- Daily , Weekly | |
| Add RXST to Watchlist: View: Get Complete RXST Trend Analysis ➞ | |
 | FLR Fluor Corporation |
| Sector: Industrials | |
| SubSector: Heavy Construction | |
| MarketCap: 891.495 Millions | |
| Recent Price: 52.27 Smart Investing & Trading Score: 95 | |
| Day Percent Change: 0.44% Day Change: 0.23 | |
| Week Change: -0.93% Year-to-date Change: 6.0% | |
| FLR Links: Profile News Message Board | |
| Charts:- Daily , Weekly | |
| Add FLR to Watchlist: View: Get Complete FLR Trend Analysis ➞ | |
 | SFL SFL Corporation Ltd. |
| Sector: Transports | |
| SubSector: Shipping | |
| MarketCap: 890.414 Millions | |
| Recent Price: 9.19 Smart Investing & Trading Score: 100 | |
| Day Percent Change: 1.55% Day Change: 0.14 | |
| Week Change: 3.26% Year-to-date Change: -7.1% | |
| SFL Links: Profile News Message Board | |
| Charts:- Daily , Weekly | |
| Add SFL to Watchlist: View: Get Complete SFL Trend Analysis ➞ | |
| For tabular summary view of above stock list: Summary View ➞ 0 - 25 , 25 - 50 , 50 - 75 , 75 - 100 , 100 - 125 , 125 - 150 , 150 - 175 , 175 - 200 , 200 - 225 , 225 - 250 , 250 - 275 , 275 - 300 , 300 - 325 , 325 - 350 , 350 - 375 , 375 - 400 , 400 - 425 , 425 - 450 , 450 - 475 , 475 - 500 , 500 - 525 , 525 - 550 , 550 - 575 , 575 - 600 , 600 - 625 , 625 - 650 , 650 - 675 , 675 - 700 , 700 - 725 , 725 - 750 , 750 - 775 , 775 - 800 , 800 - 825 , 825 - 850 , 850 - 875 , 875 - 900 , 900 - 925 , 925 - 950 , 950 - 975 , 975 - 1000 , 1000 - 1025 , 1025 - 1050 , 1050 - 1075 , 1075 - 1100 , 1100 - 1125 , 1125 - 1150 , 1150 - 1175 , 1175 - 1200 , 1200 - 1225 , 1225 - 1250 , 1250 - 1275 , 1275 - 1300 , 1300 - 1325 , 1325 - 1350 , 1350 - 1375 , 1375 - 1400 , 1400 - 1425 , 1425 - 1450 , 1450 - 1475 | ||
| Click To Change The Sort Order: By Market Cap or Company Size Performance: Year-to-date, Week and Day | |
| Select Chart Type: | ||
| Too many stocks? View smallcap stocks filtered by marketcap & sector |
| Marketcap: All SmallCap Stocks (default-no microcap), Large, Mid-Range, Small & MicroCap |
| Sector: Tech, Finance, Energy, Staples, Retail, Industrial, Materials, Utilities & Medical |
|
Best Stocks Today 12Stocks.com |
© 2025 12Stocks.com Terms & Conditions Privacy Contact Us
All Information Provided Only For Education And Not To Be Used For Investing or Trading. See Terms & Conditions


One More Thing ... Get Best Stocks Delivered Daily!
Never Ever Miss A Move With Our Top Ten Stocks Lists
Find Best Stocks In Any Market - Bull or Bear Market
Take A Peek At Our Top Ten Stocks Lists: Daily, Weekly, Year-to-Date & Top Trends
Find Best Stocks In Any Market - Bull or Bear Market
Take A Peek At Our Top Ten Stocks Lists: Daily, Weekly, Year-to-Date & Top Trends
Smallcap Stocks With Best Up Trends [0-bearish to 100-bullish]: Agenus [100], NextDecade [100], Ramaco Resources[100], Kratos Defense[100], Harrow Health[100], Central Garden[100], Central Garden[100], Hecla Mining[100], Century Aluminum[100], Green Plains[100], Centrus Energy[100]
Best Smallcap Stocks Year-to-Date:
System1 [589.08%], RAPT [435.44%], ThredUp [409.35%], 908 Devices[215.45%], Centrus Energy[209.86%], Digital Turbine[200.59%], ProKidney [168.64%], OptimizeRx [161.32%], PaySign [159.93%], Agenus [157.66%], Sana [156.44%] Best Smallcap Stocks This Week:
ProKidney [612.49%], Cogint [44.85%], Ramaco Resources[44.42%], Prime Medicine[39.87%], Amprius [37.61%], Inhibrx [33.31%], Rhythm [31.82%], Ventyx Biosciences[31.73%], B. Riley[31.1%], Sana [31.03%], Rimini Street[25.66%] Best Smallcap Stocks Daily:
Agenus [19.26%], NextDecade [16.94%], Astronics [16.15%], Ramaco Resources[15.72%], Kratos Defense[11.76%], Harrow Health[11.35%], AeroVironment [11.04%], Central Garden[10.61%], Central Garden[9.88%], Pulmonx [9.43%], Hecla Mining[7.3%]