
 Login Sign Up


| |||||
 |  | ||||

| 12Stocks.com Market Intelligence |
Best SmallCap Stocks
|
| In a hurry? Small Cap Stock Lists: Performance Trends Table, Stock Charts
Sort Small Cap stocks: Daily, Weekly, Year-to-Date, Market Cap & Trends. Filter Small Cap stocks list by sector: Show all, Tech, Finance, Energy, Staples, Retail, Industrial, Materials, Utilities and HealthCare Filter Small Cap stocks list by size: All Large Medium Small and MicroCap |
| 12Stocks.com Small Cap Stocks Performances & Trends Daily | |||||||||
|
|  The overall Smart Investing & Trading Score is 93 (0-bearish to 100-bullish) which puts Small Cap index in short term bullish trend. The Smart Investing & Trading Score from previous trading session is 76 and hence an improvement of trend.
| ||||||||
Here are the Smart Investing & Trading Scores of the most requested small cap stocks at 12Stocks.com (click stock name for detailed review):
|


| 12Stocks.com: Investing in Smallcap Index with Stocks | |
|
The following table helps investors and traders sort through current performance and trends (as measured by Smart Investing & Trading Score) of various
stocks in the Smallcap Index. Quick View: Move mouse or cursor over stock symbol (ticker) to view short-term technical chart and over stock name to view long term chart. Click on  to add stock symbol to your watchlist and to add stock symbol to your watchlist and  to view watchlist. Click on any ticker or stock name for detailed market intelligence report for that stock. to view watchlist. Click on any ticker or stock name for detailed market intelligence report for that stock. |
12Stocks.com Performance of Stocks in Smallcap Index
| Ticker | Stock Name | Watchlist | Category | Recent Price | Smart Investing & Trading Score | Change % | YTD Change% |
| LRN | K12 |   | Services & Goods | 136.28 | 10 | 0.04% | 31.13% |
| RES | RPC | | Energy | 5.22 | 90 | -3.15% | -11.51% |
| TG | Tredegar | | Materials | 9.07 | 48 | 0.78% | 18.10% |
| CSTL | Castle Biosciences | | Health Care | 20.12 | 55 | 1.82% | -24.50% |
| TRST | TrustCo Bank | | Financials | 35.28 | 68 | 0.00% | 7.14% |
| AGM | Federal Agricultural | | Financials | 197.94 | 63 | -1.62% | 1.30% |
| ARDX | Ardelyx | | Health Care | 4.60 | 74 | 2.68% | -9.27% |
| SCSC | ScanSource | | Technology | 42.54 | 56 | 0.97% | -10.35% |
| NFBK | Northfield Bancorp | | Financials | 11.99 | 58 | 0.00% | 4.32% |
| NPK | National Presto | | Industrials | 105.73 | 75 | -0.53% | 8.52% |
| YORW | York Water | | Utilities | 32.40 | 60 | 1.31% | -0.30% |
| RCUS | Arcus Biosciences | | Health Care | 9.33 | 100 | 9.76% | -37.34% |
| MBI | MBIA | | Financials | 4.40 | 42 | -0.23% | -31.89% |
| OFG | OFG Bancorp | | Financials | 44.39 | 68 | -0.20% | 5.68% |
| HMST | HomeStreet | | Financials | 13.41 | 70 | 1.21% | 17.43% |
| CMPO | CompoSecure | | Industrials | 14.47 | 53 | 0.21% | 13.65% |
| HLIT | Harmonic | | Technology | 9.46 | 61 | 2.88% | -28.53% |
| GMRE | Global Medical | | Industrials | 7.11 | 42 | -0.84% | -5.62% |
| UCTT | Ultra Clean | | Technology | 24.62 | 68 | -1.20% | -31.52% |
| ZUMZ | Zumiez | | Services & Goods | 13.85 | 68 | -0.07% | -27.75% |
| GSBC | Great Southern | | Financials | 61.83 | 68 | -0.10% | 4.31% |
| COOK | Traeger | | Services & Goods | 1.94 | 93 | -0.51% | -18.83% |
| LMAT | LeMaitre Vascular | | Health Care | 84.55 | 57 | 0.76% | -8.01% |
| INSW | Seaways | | Services & Goods | 38.28 | 43 | -3.58% | 8.82% |
| WINA | Winmark | | Services & Goods | 364.80 | 36 | 0.26% | -6.98% |
| For chart view version of above stock list: Chart View ➞ 0 - 25 , 25 - 50 , 50 - 75 , 75 - 100 , 100 - 125 , 125 - 150 , 150 - 175 , 175 - 200 , 200 - 225 , 225 - 250 , 250 - 275 , 275 - 300 , 300 - 325 , 325 - 350 , 350 - 375 , 375 - 400 , 400 - 425 , 425 - 450 , 450 - 475 , 475 - 500 , 500 - 525 , 525 - 550 , 550 - 575 , 575 - 600 , 600 - 625 , 625 - 650 , 650 - 675 , 675 - 700 , 700 - 725 , 725 - 750 , 750 - 775 , 775 - 800 , 800 - 825 , 825 - 850 , 850 - 875 , 875 - 900 , 900 - 925 , 925 - 950 , 950 - 975 , 975 - 1000 , 1000 - 1025 , 1025 - 1050 , 1050 - 1075 , 1075 - 1100 , 1100 - 1125 , 1125 - 1150 , 1150 - 1175 , 1175 - 1200 , 1200 - 1225 , 1225 - 1250 , 1250 - 1275 , 1275 - 1300 , 1300 - 1325 , 1325 - 1350 , 1350 - 1375 , 1375 - 1400 , 1400 - 1425 , 1425 - 1450 , 1450 - 1475 | ||
 | Click To Change The Sort Order: By Market Cap or Company Size Performance: Year-to-date, Week and Day |  |
| Too many stocks? View smallcap stocks filtered by marketcap & sector |
| Marketcap: All SmallCap Stocks (default-no microcap), Large, Mid-Range, Small |
| Smallcap Sector: Tech, Finance, Energy, Staples, Retail, Industrial, Materials, & Medical |
|
Get the most comprehensive stock market coverage daily at 12Stocks.com ➞ Best Stocks Today ➞ Best Stocks Weekly ➞ Best Stocks Year-to-Date ➞ Best Stocks Trends ➞  Best Stocks Today 12Stocks.com Best Nasdaq Stocks ➞ Best S&P 500 Stocks ➞ Best Tech Stocks ➞ Best Biotech Stocks ➞ |
| Detailed Overview of SmallCap Stocks |
| SmallCap Technical Overview, Leaders & Laggards, Top SmallCap ETF Funds & Detailed SmallCap Stocks List, Charts, Trends & More |
| Smallcap: Technical Analysis, Trends & YTD Performance | |
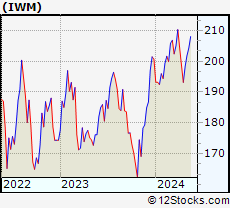
| SmallCap segment as represented by
IWM, an exchange-traded fund [ETF], holds basket of thousands of smallcap stocks from across all major sectors of the US stock market. The smallcap index (contains stocks like Riverbed & Sotheby's) is up by 1.44% and is currently underperforming the overall market by -5.04% year-to-date. Below is a quick view of technical charts and trends: | |
 IWM Weekly Chart |
|
| Long Term Trend: Very Good | |
| Medium Term Trend: Very Good | |
 IWM Daily Chart |
|
| Short Term Trend: Very Good | |
| Overall Trend Score: 93 | |
| YTD Performance: 1.44% | |
| **Trend Scores & Views Are Only For Educational Purposes And Not For Investing | |
| 12Stocks.com: Top Performing Small Cap Index Stocks | ||||||||||||||||||||||||||||||||||||||||||||||||
 The top performing Small Cap Index stocks year to date are
Now, more recently, over last week, the top performing Small Cap Index stocks on the move are


|
||||||||||||||||||||||||||||||||||||||||||||||||
| 12Stocks.com: Investing in Smallcap Index using Exchange Traded Funds | |
|
The following table shows list of key exchange traded funds (ETF) that
help investors track Smallcap index. The following list also includes leveraged ETF funds that track twice or thrice the daily returns of Smallcap indices. Short or inverse ETF funds move in the opposite direction to the index they track and are useful during market pullbacks or during bear markets. Quick View: Move mouse or cursor over ETF symbol (ticker) to view short-term technical chart and over ETF name to view long term chart. Click on ticker or stock name for detailed view. Click on to add stock symbol to your watchlist and to view watchlist. |
12Stocks.com List of ETFs that track Smallcap Index
| Ticker | ETF Name | Watchlist | Recent Price | Smart Investing & Trading Score | Change % | Week % | Year-to-date % |
| IWM | iShares Russell 2000 | | 223.65 | 93 | 1.08 | 0.26 | 1.44% |
| 12Stocks.com: Charts, Trends, Fundamental Data and Performances of SmallCap Stocks | |
|
We now take in-depth look at all SmallCap stocks including charts, multi-period performances and overall trends (as measured by Smart Investing & Trading Score). One can sort SmallCap stocks (click link to choose) by Daily, Weekly and by Year-to-Date performances. Also, one can sort by size of the company or by market capitalization. |
| Select Your Default Chart Type: | |||||
| |||||
| Click on stock symbol or name for detailed view. Click on to add stock symbol to your watchlist and to view watchlist. Quick View: Move mouse or cursor over "Daily" to quickly view daily technical stock chart and over "Weekly" to view weekly technical stock chart. | |||||

 | LRN K12 Inc. |
| Sector: Services & Goods | |
| SubSector: Education & Training Services | |
| MarketCap: 549.606 Millions | |
| Recent Price: 136.28 Smart Investing & Trading Score: 10 | |
| Day Percent Change: 0.04% Day Change: 0.06 | |
| Week Change: -1.67% Year-to-date Change: 31.1% | |
| LRN Links: Profile News Message Board | |
| Charts:- Daily , Weekly | |
| Add LRN to Watchlist: View: Get Complete LRN Trend Analysis ➞ | |
 | RES RPC, Inc. |
| Sector: Energy | |
| SubSector: Oil & Gas Equipment & Services | |
| MarketCap: 546.261 Millions | |
| Recent Price: 5.22 Smart Investing & Trading Score: 90 | |
| Day Percent Change: -3.15% Day Change: -0.17 | |
| Week Change: 0.77% Year-to-date Change: -11.5% | |
| RES Links: Profile News Message Board | |
| Charts:- Daily , Weekly | |
| Add RES to Watchlist: View: Get Complete RES Trend Analysis ➞ | |
 | TG Tredegar Corporation |
| Sector: Materials | |
| SubSector: Specialty Chemicals | |
| MarketCap: 545.057 Millions | |
| Recent Price: 9.07 Smart Investing & Trading Score: 48 | |
| Day Percent Change: 0.78% Day Change: 0.07 | |
| Week Change: -2.47% Year-to-date Change: 18.1% | |
| TG Links: Profile News Message Board | |
| Charts:- Daily , Weekly | |
| Add TG to Watchlist: View: Get Complete TG Trend Analysis ➞ | |
 | CSTL Castle Biosciences, Inc. |
| Sector: Health Care | |
| SubSector: Medical Laboratories & Research | |
| MarketCap: 545 Millions | |
| Recent Price: 20.12 Smart Investing & Trading Score: 55 | |
| Day Percent Change: 1.82% Day Change: 0.36 | |
| Week Change: -0.89% Year-to-date Change: -24.5% | |
| CSTL Links: Profile News Message Board | |
| Charts:- Daily , Weekly | |
| Add CSTL to Watchlist: View: Get Complete CSTL Trend Analysis ➞ | |
 | TRST TrustCo Bank Corp NY |
| Sector: Financials | |
| SubSector: Regional - Northeast Banks | |
| MarketCap: 543.999 Millions | |
| Recent Price: 35.28 Smart Investing & Trading Score: 68 | |
| Day Percent Change: 0% Day Change: 0 | |
| Week Change: -0.84% Year-to-date Change: 7.1% | |
| TRST Links: Profile News Message Board | |
| Charts:- Daily , Weekly | |
| Add TRST to Watchlist: View: Get Complete TRST Trend Analysis ➞ | |
 | AGM Federal Agricultural Mortgage Corporation |
| Sector: Financials | |
| SubSector: Credit Services | |
| MarketCap: 542.008 Millions | |
| Recent Price: 197.94 Smart Investing & Trading Score: 63 | |
| Day Percent Change: -1.62% Day Change: -3.26 | |
| Week Change: -1.53% Year-to-date Change: 1.3% | |
| AGM Links: Profile News Message Board | |
| Charts:- Daily , Weekly | |
| Add AGM to Watchlist: View: Get Complete AGM Trend Analysis ➞ | |
 | ARDX Ardelyx, Inc. |
| Sector: Health Care | |
| SubSector: Biotechnology | |
| MarketCap: 541.985 Millions | |
| Recent Price: 4.60 Smart Investing & Trading Score: 74 | |
| Day Percent Change: 2.68% Day Change: 0.12 | |
| Week Change: 7.73% Year-to-date Change: -9.3% | |
| ARDX Links: Profile News Message Board | |
| Charts:- Daily , Weekly | |
| Add ARDX to Watchlist: View: Get Complete ARDX Trend Analysis ➞ | |
 | SCSC ScanSource, Inc. |
| Sector: Technology | |
| SubSector: Technical & System Software | |
| MarketCap: 541 Millions | |
| Recent Price: 42.54 Smart Investing & Trading Score: 56 | |
| Day Percent Change: 0.97% Day Change: 0.41 | |
| Week Change: -0.84% Year-to-date Change: -10.4% | |
| SCSC Links: Profile News Message Board | |
| Charts:- Daily , Weekly | |
| Add SCSC to Watchlist: View: Get Complete SCSC Trend Analysis ➞ | |
 | NFBK Northfield Bancorp, Inc. (Staten Island, NY) |
| Sector: Financials | |
| SubSector: Regional - Northeast Banks | |
| MarketCap: 540.699 Millions | |
| Recent Price: 11.99 Smart Investing & Trading Score: 58 | |
| Day Percent Change: 0% Day Change: 0 | |
| Week Change: -1.88% Year-to-date Change: 4.3% | |
| NFBK Links: Profile News Message Board | |
| Charts:- Daily , Weekly | |
| Add NFBK to Watchlist: View: Get Complete NFBK Trend Analysis ➞ | |
 | NPK National Presto Industries, Inc. |
| Sector: Industrials | |
| SubSector: Aerospace/Defense Products & Services | |
| MarketCap: 540.401 Millions | |
| Recent Price: 105.73 Smart Investing & Trading Score: 75 | |
| Day Percent Change: -0.53% Day Change: -0.56 | |
| Week Change: -2.37% Year-to-date Change: 8.5% | |
| NPK Links: Profile News Message Board | |
| Charts:- Daily , Weekly | |
| Add NPK to Watchlist: View: Get Complete NPK Trend Analysis ➞ | |
 | YORW The York Water Company |
| Sector: Utilities | |
| SubSector: Water Utilities | |
| MarketCap: 539.502 Millions | |
| Recent Price: 32.40 Smart Investing & Trading Score: 60 | |
| Day Percent Change: 1.31% Day Change: 0.42 | |
| Week Change: 0.19% Year-to-date Change: -0.3% | |
| YORW Links: Profile News Message Board | |
| Charts:- Daily , Weekly | |
| Add YORW to Watchlist: View: Get Complete YORW Trend Analysis ➞ | |
 | RCUS Arcus Biosciences, Inc. |
| Sector: Health Care | |
| SubSector: Biotechnology | |
| MarketCap: 539.285 Millions | |
| Recent Price: 9.33 Smart Investing & Trading Score: 100 | |
| Day Percent Change: 9.76% Day Change: 0.83 | |
| Week Change: 10.15% Year-to-date Change: -37.3% | |
| RCUS Links: Profile News Message Board | |
| Charts:- Daily , Weekly | |
| Add RCUS to Watchlist: View: Get Complete RCUS Trend Analysis ➞ | |
 | MBI MBIA Inc. |
| Sector: Financials | |
| SubSector: Property & Casualty Insurance | |
| MarketCap: 539.012 Millions | |
| Recent Price: 4.40 Smart Investing & Trading Score: 42 | |
| Day Percent Change: -0.23% Day Change: -0.01 | |
| Week Change: -0.23% Year-to-date Change: -31.9% | |
| MBI Links: Profile News Message Board | |
| Charts:- Daily , Weekly | |
| Add MBI to Watchlist: View: Get Complete MBI Trend Analysis ➞ | |
 | OFG OFG Bancorp |
| Sector: Financials | |
| SubSector: Money Center Banks | |
| MarketCap: 537.599 Millions | |
| Recent Price: 44.39 Smart Investing & Trading Score: 68 | |
| Day Percent Change: -0.2% Day Change: -0.09 | |
| Week Change: -1.38% Year-to-date Change: 5.7% | |
| OFG Links: Profile News Message Board | |
| Charts:- Daily , Weekly | |
| Add OFG to Watchlist: View: Get Complete OFG Trend Analysis ➞ | |
 | HMST HomeStreet, Inc. |
| Sector: Financials | |
| SubSector: Savings & Loans | |
| MarketCap: 535.33 Millions | |
| Recent Price: 13.41 Smart Investing & Trading Score: 70 | |
| Day Percent Change: 1.21% Day Change: 0.16 | |
| Week Change: 0.07% Year-to-date Change: 17.4% | |
| HMST Links: Profile News Message Board | |
| Charts:- Daily , Weekly | |
| Add HMST to Watchlist: View: Get Complete HMST Trend Analysis ➞ | |
 | CMPO CompoSecure, Inc. |
| Sector: Industrials | |
| SubSector: Metal Fabrication | |
| MarketCap: 535 Millions | |
| Recent Price: 14.47 Smart Investing & Trading Score: 53 | |
| Day Percent Change: 0.21% Day Change: 0.03 | |
| Week Change: -2.56% Year-to-date Change: 13.7% | |
| CMPO Links: Profile News Message Board | |
| Charts:- Daily , Weekly | |
| Add CMPO to Watchlist: View: Get Complete CMPO Trend Analysis ➞ | |
 | HLIT Harmonic Inc. |
| Sector: Technology | |
| SubSector: Communication Equipment | |
| MarketCap: 533.539 Millions | |
| Recent Price: 9.46 Smart Investing & Trading Score: 61 | |
| Day Percent Change: 2.88% Day Change: 0.26 | |
| Week Change: -3.62% Year-to-date Change: -28.5% | |
| HLIT Links: Profile News Message Board | |
| Charts:- Daily , Weekly | |
| Add HLIT to Watchlist: View: Get Complete HLIT Trend Analysis ➞ | |
 | GMRE Global Medical REIT Inc. |
| Sector: Industrials | |
| SubSector: Conglomerates | |
| MarketCap: 529.748 Millions | |
| Recent Price: 7.11 Smart Investing & Trading Score: 42 | |
| Day Percent Change: -0.84% Day Change: -0.06 | |
| Week Change: -2.2% Year-to-date Change: -5.6% | |
| GMRE Links: Profile News Message Board | |
| Charts:- Daily , Weekly | |
| Add GMRE to Watchlist: View: Get Complete GMRE Trend Analysis ➞ | |
 | UCTT Ultra Clean Holdings, Inc. |
| Sector: Technology | |
| SubSector: Semiconductor Equipment & Materials | |
| MarketCap: 528.518 Millions | |
| Recent Price: 24.62 Smart Investing & Trading Score: 68 | |
| Day Percent Change: -1.2% Day Change: -0.3 | |
| Week Change: -2.53% Year-to-date Change: -31.5% | |
| UCTT Links: Profile News Message Board | |
| Charts:- Daily , Weekly | |
| Add UCTT to Watchlist: View: Get Complete UCTT Trend Analysis ➞ | |
 | ZUMZ Zumiez Inc. |
| Sector: Services & Goods | |
| SubSector: Specialty Retail, Other | |
| MarketCap: 526.244 Millions | |
| Recent Price: 13.85 Smart Investing & Trading Score: 68 | |
| Day Percent Change: -0.07% Day Change: -0.01 | |
| Week Change: -4.61% Year-to-date Change: -27.8% | |
| ZUMZ Links: Profile News Message Board | |
| Charts:- Daily , Weekly | |
| Add ZUMZ to Watchlist: View: Get Complete ZUMZ Trend Analysis ➞ | |
 | GSBC Great Southern Bancorp, Inc. |
| Sector: Financials | |
| SubSector: Regional - Southwest Banks | |
| MarketCap: 524.765 Millions | |
| Recent Price: 61.83 Smart Investing & Trading Score: 68 | |
| Day Percent Change: -0.1% Day Change: -0.06 | |
| Week Change: -1.09% Year-to-date Change: 4.3% | |
| GSBC Links: Profile News Message Board | |
| Charts:- Daily , Weekly | |
| Add GSBC to Watchlist: View: Get Complete GSBC Trend Analysis ➞ | |
 | COOK Traeger, Inc. |
| Sector: Services & Goods | |
| SubSector: Furnishings, Fixtures & Appliances | |
| MarketCap: 524 Millions | |
| Recent Price: 1.94 Smart Investing & Trading Score: 93 | |
| Day Percent Change: -0.51% Day Change: -0.01 | |
| Week Change: 4.3% Year-to-date Change: -18.8% | |
| COOK Links: Profile News Message Board | |
| Charts:- Daily , Weekly | |
| Add COOK to Watchlist: View: Get Complete COOK Trend Analysis ➞ | |
 | LMAT LeMaitre Vascular, Inc. |
| Sector: Health Care | |
| SubSector: Medical Instruments & Supplies | |
| MarketCap: 522.16 Millions | |
| Recent Price: 84.55 Smart Investing & Trading Score: 57 | |
| Day Percent Change: 0.76% Day Change: 0.64 | |
| Week Change: 0.19% Year-to-date Change: -8.0% | |
| LMAT Links: Profile News Message Board | |
| Charts:- Daily , Weekly | |
| Add LMAT to Watchlist: View: Get Complete LMAT Trend Analysis ➞ | |
 | INSW International Seaways, Inc. |
| Sector: Services & Goods | |
| SubSector: Business Services | |
| MarketCap: 521.582 Millions | |
| Recent Price: 38.28 Smart Investing & Trading Score: 43 | |
| Day Percent Change: -3.58% Day Change: -1.42 | |
| Week Change: -2.67% Year-to-date Change: 8.8% | |
| INSW Links: Profile News Message Board | |
| Charts:- Daily , Weekly | |
| Add INSW to Watchlist: View: Get Complete INSW Trend Analysis ➞ | |
 | WINA Winmark Corporation |
| Sector: Services & Goods | |
| SubSector: Specialty Retail, Other | |
| MarketCap: 520.444 Millions | |
| Recent Price: 364.80 Smart Investing & Trading Score: 36 | |
| Day Percent Change: 0.26% Day Change: 0.95 | |
| Week Change: -2.56% Year-to-date Change: -7.0% | |
| WINA Links: Profile News Message Board | |
| Charts:- Daily , Weekly | |
| Add WINA to Watchlist: View: Get Complete WINA Trend Analysis ➞ | |
| For tabular summary view of above stock list: Summary View ➞ 0 - 25 , 25 - 50 , 50 - 75 , 75 - 100 , 100 - 125 , 125 - 150 , 150 - 175 , 175 - 200 , 200 - 225 , 225 - 250 , 250 - 275 , 275 - 300 , 300 - 325 , 325 - 350 , 350 - 375 , 375 - 400 , 400 - 425 , 425 - 450 , 450 - 475 , 475 - 500 , 500 - 525 , 525 - 550 , 550 - 575 , 575 - 600 , 600 - 625 , 625 - 650 , 650 - 675 , 675 - 700 , 700 - 725 , 725 - 750 , 750 - 775 , 775 - 800 , 800 - 825 , 825 - 850 , 850 - 875 , 875 - 900 , 900 - 925 , 925 - 950 , 950 - 975 , 975 - 1000 , 1000 - 1025 , 1025 - 1050 , 1050 - 1075 , 1075 - 1100 , 1100 - 1125 , 1125 - 1150 , 1150 - 1175 , 1175 - 1200 , 1200 - 1225 , 1225 - 1250 , 1250 - 1275 , 1275 - 1300 , 1300 - 1325 , 1325 - 1350 , 1350 - 1375 , 1375 - 1400 , 1400 - 1425 , 1425 - 1450 , 1450 - 1475 | ||
| Click To Change The Sort Order: By Market Cap or Company Size Performance: Year-to-date, Week and Day | |
| Select Chart Type: | ||
| Too many stocks? View smallcap stocks filtered by marketcap & sector |
| Marketcap: All SmallCap Stocks (default-no microcap), Large, Mid-Range, Small & MicroCap |
| Sector: Tech, Finance, Energy, Staples, Retail, Industrial, Materials, Utilities & Medical |
|
Best Stocks Today 12Stocks.com |
© 2025 12Stocks.com Terms & Conditions Privacy Contact Us
All Information Provided Only For Education And Not To Be Used For Investing or Trading. See Terms & Conditions


One More Thing ... Get Best Stocks Delivered Daily!
Never Ever Miss A Move With Our Top Ten Stocks Lists
Find Best Stocks In Any Market - Bull or Bear Market
Take A Peek At Our Top Ten Stocks Lists: Daily, Weekly, Year-to-Date & Top Trends
Find Best Stocks In Any Market - Bull or Bear Market
Take A Peek At Our Top Ten Stocks Lists: Daily, Weekly, Year-to-Date & Top Trends
Smallcap Stocks With Best Up Trends [0-bearish to 100-bullish]: Rhythm [100], Bloom Energy[100], Lexicon [100], ProKidney [100], Nuvation Bio[100], Foghorn [100], Precigen [100], Replimune Group[100], EyePoint [100], E.W. Scripps[100], Arcus Biosciences[100]
Best Smallcap Stocks Year-to-Date:
RAPT [434.18%], ThredUp [383.45%], Digital Turbine[227.81%], 908 Devices[221.36%], PaySign [181.46%], OptimizeRx [178.6%], Centrus Energy[169.28%], ProKidney [156.8%], Sana [148.47%], Editas Medicine[142.52%], National Vision[142.32%] Best Smallcap Stocks This Week:
ProKidney [581.1%], Prime Medicine[45.98%], Cogint [37.2%], Rhythm [35.32%], KalVista [33.47%], B. Riley[30.49%], Ovid [29.26%], Inhibrx [28.11%], Caribou Biosciences[27.74%], Amprius [27.35%], Sana [26.96%] Best Smallcap Stocks Daily:
Rhythm [36.63%], Bloom Energy[18.15%], Lexicon [16.74%], ProKidney [16.35%], Nuvation Bio[15.61%], Ventyx Biosciences[15.38%], Design [14.56%], Pliant [14.29%], Kodiak Sciences[13.85%], Cabaletta Bio[13.25%], Xencor [12.82%]