
 Login Sign Up


| |||||
 |  | ||||

| 12Stocks.com Market Intelligence |
Best SmallCap Stocks
|
| In a hurry? Small Cap Stock Lists: Performance Trends Table, Stock Charts
Sort Small Cap stocks: Daily, Weekly, Year-to-Date, Market Cap & Trends. Filter Small Cap stocks list by sector: Show all, Tech, Finance, Energy, Staples, Retail, Industrial, Materials, Utilities and HealthCare Filter Small Cap stocks list by size: All Large Medium Small and MicroCap |
| 12Stocks.com Small Cap Stocks Performances & Trends Daily | |||||||||
|
|  The overall Smart Investing & Trading Score is 76 (0-bearish to 100-bullish) which puts Small Cap index in short term neutral to bullish trend. The Smart Investing & Trading Score from previous trading session is 100 and hence a deterioration of trend.
| ||||||||
Here are the Smart Investing & Trading Scores of the most requested small cap stocks at 12Stocks.com (click stock name for detailed review):
|


| 12Stocks.com: Investing in Smallcap Index with Stocks | |
|
The following table helps investors and traders sort through current performance and trends (as measured by Smart Investing & Trading Score) of various
stocks in the Smallcap Index. Quick View: Move mouse or cursor over stock symbol (ticker) to view short-term technical chart and over stock name to view long term chart. Click on  to add stock symbol to your watchlist and to add stock symbol to your watchlist and  to view watchlist. Click on any ticker or stock name for detailed market intelligence report for that stock. to view watchlist. Click on any ticker or stock name for detailed market intelligence report for that stock. |
12Stocks.com Performance of Stocks in Smallcap Index
| Ticker | Stock Name | Watchlist | Category | Recent Price | Smart Investing & Trading Score | Change % | YTD Change% |
| FCBC | First Community |   | Financials | 40.35 | 68 | -1.75% | -2.41% |
| VCEL | Vericel | | Health Care | 39.93 | 34 | -3.15% | -27.28% |
| AGYS | Agilysys | | Technology | 113.92 | 58 | -1.12% | -13.51% |
| BLX | Banco Latinoamericano | | Financials | 42.21 | 95 | -0.24% | 20.57% |
| CALX | Calix | | Technology | 50.49 | 51 | -1.10% | 44.79% |
| RSVR | Reservoir Media | | Services & Goods | 7.99 | 95 | -0.75% | -11.71% |
| VKTX | Viking | | Health Care | 31.11 | 100 | -0.58% | -22.69% |
| ZYXI | Zynex | | Health Care | 2.24 | 46 | -2.61% | -72.03% |
| SRDX | Surmodics | | Health Care | 30.87 | 88 | -0.48% | -22.05% |
| SWIM | Latham Group | | Industrials | 6.59 | 58 | -5.04% | -5.32% |
| ONTF | ON24 | | Technology | 5.12 | 26 | -3.21% | -20.74% |
| CUBI | Customers Bancorp | | Financials | 63.47 | 68 | -0.63% | 30.38% |
| TPC | Tutor Perini | | Industrials | 48.98 | 95 | 1.91% | 102.40% |
| TPB | Turning Point | | Consumer Staples | 72.26 | 58 | -0.56% | 20.39% |
| BY | Byline Bancorp | | Financials | 27.95 | 68 | -1.10% | -3.29% |
| CRNX | Crinetics | | Health Care | 31.93 | 74 | -0.19% | -37.55% |
| NUVB | Nuvation Bio | | Health Care | 2.20 | 57 | -4.76% | -17.29% |
| SGHT | Sight Sciences | | Health Care | 3.41 | 36 | -0.58% | -6.32% |
| IESC | IES | | Industrials | 309.16 | 85 | -0.37% | 53.84% |
| EFC | Ellington Financial | | Financials | 13.22 | 66 | -0.15% | 12.40% |
| OLP | One Liberty | | Financials | 24.13 | 18 | 0.17% | -9.89% |
| FSBC | Five Star | | Financials | 30.01 | 68 | -0.99% | 0.39% |
| HIPO | Hippo | | Financials | 25.97 | 26 | -5.43% | -2.99% |
| NVAX | Novavax | | Health Care | 6.84 | 58 | -3.66% | -14.93% |
| GAMB | Gambling.com Group | | Services & Goods | 11.53 | 10 | -4.32% | -18.11% |
| For chart view version of above stock list: Chart View ➞ 0 - 25 , 25 - 50 , 50 - 75 , 75 - 100 , 100 - 125 , 125 - 150 , 150 - 175 , 175 - 200 , 200 - 225 , 225 - 250 , 250 - 275 , 275 - 300 , 300 - 325 , 325 - 350 , 350 - 375 , 375 - 400 , 400 - 425 , 425 - 450 , 450 - 475 , 475 - 500 , 500 - 525 , 525 - 550 , 550 - 575 , 575 - 600 , 600 - 625 , 625 - 650 , 650 - 675 , 675 - 700 , 700 - 725 , 725 - 750 , 750 - 775 , 775 - 800 , 800 - 825 , 825 - 850 , 850 - 875 , 875 - 900 , 900 - 925 , 925 - 950 , 950 - 975 , 975 - 1000 , 1000 - 1025 , 1025 - 1050 , 1050 - 1075 , 1075 - 1100 , 1100 - 1125 , 1125 - 1150 , 1150 - 1175 , 1175 - 1200 , 1200 - 1225 , 1225 - 1250 , 1250 - 1275 , 1275 - 1300 , 1300 - 1325 , 1325 - 1350 , 1350 - 1375 , 1375 - 1400 , 1400 - 1425 , 1425 - 1450 , 1450 - 1475 | ||
 | Click To Change The Sort Order: By Market Cap or Company Size Performance: Year-to-date, Week and Day |  |
| Too many stocks? View smallcap stocks filtered by marketcap & sector |
| Marketcap: All SmallCap Stocks (default-no microcap), Large, Mid-Range, Small |
| Smallcap Sector: Tech, Finance, Energy, Staples, Retail, Industrial, Materials, & Medical |
|
Get the most comprehensive stock market coverage daily at 12Stocks.com ➞ Best Stocks Today ➞ Best Stocks Weekly ➞ Best Stocks Year-to-Date ➞ Best Stocks Trends ➞  Best Stocks Today 12Stocks.com Best Nasdaq Stocks ➞ Best S&P 500 Stocks ➞ Best Tech Stocks ➞ Best Biotech Stocks ➞ |
| Detailed Overview of SmallCap Stocks |
| SmallCap Technical Overview, Leaders & Laggards, Top SmallCap ETF Funds & Detailed SmallCap Stocks List, Charts, Trends & More |
| Smallcap: Technical Analysis, Trends & YTD Performance | |
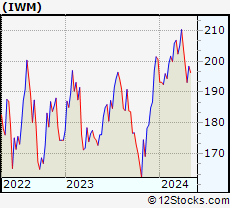
| SmallCap segment as represented by
IWM, an exchange-traded fund [ETF], holds basket of thousands of smallcap stocks from across all major sectors of the US stock market. The smallcap index (contains stocks like Riverbed & Sotheby's) is up by 0.56% and is currently underperforming the overall market by -5.75% year-to-date. Below is a quick view of technical charts and trends: | |
 IWM Weekly Chart |
|
| Long Term Trend: Very Good | |
| Medium Term Trend: Very Good | |
 IWM Daily Chart |
|
| Short Term Trend: Good | |
| Overall Trend Score: 76 | |
| YTD Performance: 0.56% | |
| **Trend Scores & Views Are Only For Educational Purposes And Not For Investing | |
| 12Stocks.com: Top Performing Small Cap Index Stocks | ||||||||||||||||||||||||||||||||||||||||||||||||
 The top performing Small Cap Index stocks year to date are
Now, more recently, over last week, the top performing Small Cap Index stocks on the move are


|
||||||||||||||||||||||||||||||||||||||||||||||||
| 12Stocks.com: Investing in Smallcap Index using Exchange Traded Funds | |
|
The following table shows list of key exchange traded funds (ETF) that
help investors track Smallcap index. The following list also includes leveraged ETF funds that track twice or thrice the daily returns of Smallcap indices. Short or inverse ETF funds move in the opposite direction to the index they track and are useful during market pullbacks or during bear markets. Quick View: Move mouse or cursor over ETF symbol (ticker) to view short-term technical chart and over ETF name to view long term chart. Click on ticker or stock name for detailed view. Click on to add stock symbol to your watchlist and to view watchlist. |
12Stocks.com List of ETFs that track Smallcap Index
| Ticker | ETF Name | Watchlist | Recent Price | Smart Investing & Trading Score | Change % | Week % | Year-to-date % |
| IWM | iShares Russell 2000 | | 221.70 | 76 | -1.38 | -0.62 | 0.56% |
| 12Stocks.com: Charts, Trends, Fundamental Data and Performances of SmallCap Stocks | |
|
We now take in-depth look at all SmallCap stocks including charts, multi-period performances and overall trends (as measured by Smart Investing & Trading Score). One can sort SmallCap stocks (click link to choose) by Daily, Weekly and by Year-to-Date performances. Also, one can sort by size of the company or by market capitalization. |
| Select Your Default Chart Type: | |||||
| |||||
| Click on stock symbol or name for detailed view. Click on to add stock symbol to your watchlist and to view watchlist. Quick View: Move mouse or cursor over "Daily" to quickly view daily technical stock chart and over "Weekly" to view weekly technical stock chart. | |||||

 | FCBC First Community Bankshares, Inc. |
| Sector: Financials | |
| SubSector: Regional - Mid-Atlantic Banks | |
| MarketCap: 393.459 Millions | |
| Recent Price: 40.35 Smart Investing & Trading Score: 68 | |
| Day Percent Change: -1.75% Day Change: -0.72 | |
| Week Change: -3.45% Year-to-date Change: -2.4% | |
| FCBC Links: Profile News Message Board | |
| Charts:- Daily , Weekly | |
| Add FCBC to Watchlist: View: Get Complete FCBC Trend Analysis ➞ | |
 | VCEL Vericel Corporation |
| Sector: Health Care | |
| SubSector: Biotechnology | |
| MarketCap: 391.885 Millions | |
| Recent Price: 39.93 Smart Investing & Trading Score: 34 | |
| Day Percent Change: -3.15% Day Change: -1.3 | |
| Week Change: -4.34% Year-to-date Change: -27.3% | |
| VCEL Links: Profile News Message Board | |
| Charts:- Daily , Weekly | |
| Add VCEL to Watchlist: View: Get Complete VCEL Trend Analysis ➞ | |
 | AGYS Agilysys, Inc. |
| Sector: Technology | |
| SubSector: Application Software | |
| MarketCap: 391.862 Millions | |
| Recent Price: 113.92 Smart Investing & Trading Score: 58 | |
| Day Percent Change: -1.12% Day Change: -1.29 | |
| Week Change: -1.19% Year-to-date Change: -13.5% | |
| AGYS Links: Profile News Message Board | |
| Charts:- Daily , Weekly | |
| Add AGYS to Watchlist: View: Get Complete AGYS Trend Analysis ➞ | |
 | BLX Banco Latinoamericano de Comercio Exterior, S.A |
| Sector: Financials | |
| SubSector: Foreign Money Center Banks | |
| MarketCap: 390.471 Millions | |
| Recent Price: 42.21 Smart Investing & Trading Score: 95 | |
| Day Percent Change: -0.24% Day Change: -0.1 | |
| Week Change: 3.38% Year-to-date Change: 20.6% | |
| BLX Links: Profile News Message Board | |
| Charts:- Daily , Weekly | |
| Add BLX to Watchlist: View: Get Complete BLX Trend Analysis ➞ | |
 | CALX Calix, Inc. |
| Sector: Technology | |
| SubSector: Communication Equipment | |
| MarketCap: 390.039 Millions | |
| Recent Price: 50.49 Smart Investing & Trading Score: 51 | |
| Day Percent Change: -1.1% Day Change: -0.56 | |
| Week Change: -6.38% Year-to-date Change: 44.8% | |
| CALX Links: Profile News Message Board | |
| Charts:- Daily , Weekly | |
| Add CALX to Watchlist: View: Get Complete CALX Trend Analysis ➞ | |
 | RSVR Reservoir Media, Inc. |
| Sector: Services & Goods | |
| SubSector: Entertainment | |
| MarketCap: 389 Millions | |
| Recent Price: 7.99 Smart Investing & Trading Score: 95 | |
| Day Percent Change: -0.75% Day Change: -0.06 | |
| Week Change: 1.4% Year-to-date Change: -11.7% | |
| RSVR Links: Profile News Message Board | |
| Charts:- Daily , Weekly | |
| Add RSVR to Watchlist: View: Get Complete RSVR Trend Analysis ➞ | |
 | VKTX Viking Therapeutics, Inc. |
| Sector: Health Care | |
| SubSector: Biotechnology | |
| MarketCap: 388.585 Millions | |
| Recent Price: 31.11 Smart Investing & Trading Score: 100 | |
| Day Percent Change: -0.58% Day Change: -0.18 | |
| Week Change: 10.36% Year-to-date Change: -22.7% | |
| VKTX Links: Profile News Message Board | |
| Charts:- Daily , Weekly | |
| Add VKTX to Watchlist: View: Get Complete VKTX Trend Analysis ➞ | |
 | ZYXI Zynex, Inc. |
| Sector: Health Care | |
| SubSector: Medical Appliances & Equipment | |
| MarketCap: 388.58 Millions | |
| Recent Price: 2.24 Smart Investing & Trading Score: 46 | |
| Day Percent Change: -2.61% Day Change: -0.06 | |
| Week Change: -6.67% Year-to-date Change: -72.0% | |
| ZYXI Links: Profile News Message Board | |
| Charts:- Daily , Weekly | |
| Add ZYXI to Watchlist: View: Get Complete ZYXI Trend Analysis ➞ | |
 | SRDX Surmodics, Inc. |
| Sector: Health Care | |
| SubSector: Diagnostic Substances | |
| MarketCap: 388.171 Millions | |
| Recent Price: 30.87 Smart Investing & Trading Score: 88 | |
| Day Percent Change: -0.48% Day Change: -0.15 | |
| Week Change: 2.93% Year-to-date Change: -22.1% | |
| SRDX Links: Profile News Message Board | |
| Charts:- Daily , Weekly | |
| Add SRDX to Watchlist: View: Get Complete SRDX Trend Analysis ➞ | |
 | SWIM Latham Group, Inc. |
| Sector: Industrials | |
| SubSector: Building Products & Equipment | |
| MarketCap: 388 Millions | |
| Recent Price: 6.59 Smart Investing & Trading Score: 58 | |
| Day Percent Change: -5.04% Day Change: -0.35 | |
| Week Change: -6.26% Year-to-date Change: -5.3% | |
| SWIM Links: Profile News Message Board | |
| Charts:- Daily , Weekly | |
| Add SWIM to Watchlist: View: Get Complete SWIM Trend Analysis ➞ | |
 | ONTF ON24, Inc. |
| Sector: Technology | |
| SubSector: Software - Application | |
| MarketCap: 386 Millions | |
| Recent Price: 5.12 Smart Investing & Trading Score: 26 | |
| Day Percent Change: -3.21% Day Change: -0.17 | |
| Week Change: -6.91% Year-to-date Change: -20.7% | |
| ONTF Links: Profile News Message Board | |
| Charts:- Daily , Weekly | |
| Add ONTF to Watchlist: View: Get Complete ONTF Trend Analysis ➞ | |
 | CUBI Customers Bancorp, Inc. |
| Sector: Financials | |
| SubSector: Regional - Northeast Banks | |
| MarketCap: 385.399 Millions | |
| Recent Price: 63.47 Smart Investing & Trading Score: 68 | |
| Day Percent Change: -0.63% Day Change: -0.4 | |
| Week Change: -3.76% Year-to-date Change: 30.4% | |
| CUBI Links: Profile News Message Board | |
| Charts:- Daily , Weekly | |
| Add CUBI to Watchlist: View: Get Complete CUBI Trend Analysis ➞ | |
 | TPC Tutor Perini Corporation |
| Sector: Industrials | |
| SubSector: Heavy Construction | |
| MarketCap: 382.595 Millions | |
| Recent Price: 48.98 Smart Investing & Trading Score: 95 | |
| Day Percent Change: 1.91% Day Change: 0.92 | |
| Week Change: 1.66% Year-to-date Change: 102.4% | |
| TPC Links: Profile News Message Board | |
| Charts:- Daily , Weekly | |
| Add TPC to Watchlist: View: Get Complete TPC Trend Analysis ➞ | |
 | TPB Turning Point Brands, Inc. |
| Sector: Consumer Staples | |
| SubSector: Tobacco Products, Other | |
| MarketCap: 381.97 Millions | |
| Recent Price: 72.26 Smart Investing & Trading Score: 58 | |
| Day Percent Change: -0.56% Day Change: -0.41 | |
| Week Change: -2.18% Year-to-date Change: 20.4% | |
| TPB Links: Profile News Message Board | |
| Charts:- Daily , Weekly | |
| Add TPB to Watchlist: View: Get Complete TPB Trend Analysis ➞ | |
 | BY Byline Bancorp, Inc. |
| Sector: Financials | |
| SubSector: Regional - Midwest Banks | |
| MarketCap: 381.87 Millions | |
| Recent Price: 27.95 Smart Investing & Trading Score: 68 | |
| Day Percent Change: -1.1% Day Change: -0.31 | |
| Week Change: -1.52% Year-to-date Change: -3.3% | |
| BY Links: Profile News Message Board | |
| Charts:- Daily , Weekly | |
| Add BY to Watchlist: View: Get Complete BY Trend Analysis ➞ | |
 | CRNX Crinetics Pharmaceuticals, Inc. |
| Sector: Health Care | |
| SubSector: Biotechnology | |
| MarketCap: 381.085 Millions | |
| Recent Price: 31.93 Smart Investing & Trading Score: 74 | |
| Day Percent Change: -0.19% Day Change: -0.06 | |
| Week Change: 7.15% Year-to-date Change: -37.6% | |
| CRNX Links: Profile News Message Board | |
| Charts:- Daily , Weekly | |
| Add CRNX to Watchlist: View: Get Complete CRNX Trend Analysis ➞ | |
 | NUVB Nuvation Bio Inc. |
| Sector: Health Care | |
| SubSector: Biotechnology | |
| MarketCap: 381 Millions | |
| Recent Price: 2.20 Smart Investing & Trading Score: 57 | |
| Day Percent Change: -4.76% Day Change: -0.11 | |
| Week Change: 5.26% Year-to-date Change: -17.3% | |
| NUVB Links: Profile News Message Board | |
| Charts:- Daily , Weekly | |
| Add NUVB to Watchlist: View: Get Complete NUVB Trend Analysis ➞ | |
 | SGHT Sight Sciences, Inc. |
| Sector: Health Care | |
| SubSector: Medical Devices | |
| MarketCap: 381 Millions | |
| Recent Price: 3.41 Smart Investing & Trading Score: 36 | |
| Day Percent Change: -0.58% Day Change: -0.02 | |
| Week Change: -19% Year-to-date Change: -6.3% | |
| SGHT Links: Profile News Message Board | |
| Charts:- Daily , Weekly | |
| Add SGHT to Watchlist: View: Get Complete SGHT Trend Analysis ➞ | |
 | IESC IES Holdings, Inc. |
| Sector: Industrials | |
| SubSector: General Contractors | |
| MarketCap: 380.963 Millions | |
| Recent Price: 309.16 Smart Investing & Trading Score: 85 | |
| Day Percent Change: -0.37% Day Change: -1.14 | |
| Week Change: 0.9% Year-to-date Change: 53.8% | |
| IESC Links: Profile News Message Board | |
| Charts:- Daily , Weekly | |
| Add IESC to Watchlist: View: Get Complete IESC Trend Analysis ➞ | |
 | EFC Ellington Financial Inc. |
| Sector: Financials | |
| SubSector: Mortgage Investment | |
| MarketCap: 380.239 Millions | |
| Recent Price: 13.22 Smart Investing & Trading Score: 66 | |
| Day Percent Change: -0.15% Day Change: -0.02 | |
| Week Change: 0.46% Year-to-date Change: 12.4% | |
| EFC Links: Profile News Message Board | |
| Charts:- Daily , Weekly | |
| Add EFC to Watchlist: View: Get Complete EFC Trend Analysis ➞ | |
 | OLP One Liberty Properties, Inc. |
| Sector: Financials | |
| SubSector: REIT - Diversified | |
| MarketCap: 378.353 Millions | |
| Recent Price: 24.13 Smart Investing & Trading Score: 18 | |
| Day Percent Change: 0.17% Day Change: 0.04 | |
| Week Change: -1.35% Year-to-date Change: -9.9% | |
| OLP Links: Profile News Message Board | |
| Charts:- Daily , Weekly | |
| Add OLP to Watchlist: View: Get Complete OLP Trend Analysis ➞ | |
 | FSBC Five Star Bancorp |
| Sector: Financials | |
| SubSector: Banks - Regional | |
| MarketCap: 377 Millions | |
| Recent Price: 30.01 Smart Investing & Trading Score: 68 | |
| Day Percent Change: -0.99% Day Change: -0.3 | |
| Week Change: -1.35% Year-to-date Change: 0.4% | |
| FSBC Links: Profile News Message Board | |
| Charts:- Daily , Weekly | |
| Add FSBC to Watchlist: View: Get Complete FSBC Trend Analysis ➞ | |
 | HIPO Hippo Holdings Inc. |
| Sector: Financials | |
| SubSector: Insurance - Specialty | |
| MarketCap: 377 Millions | |
| Recent Price: 25.97 Smart Investing & Trading Score: 26 | |
| Day Percent Change: -5.43% Day Change: -1.49 | |
| Week Change: -7.61% Year-to-date Change: -3.0% | |
| HIPO Links: Profile News Message Board | |
| Charts:- Daily , Weekly | |
| Add HIPO to Watchlist: View: Get Complete HIPO Trend Analysis ➞ | |
 | NVAX Novavax, Inc. |
| Sector: Health Care | |
| SubSector: Biotechnology | |
| MarketCap: 376.185 Millions | |
| Recent Price: 6.84 Smart Investing & Trading Score: 58 | |
| Day Percent Change: -3.66% Day Change: -0.26 | |
| Week Change: 0.59% Year-to-date Change: -14.9% | |
| NVAX Links: Profile News Message Board | |
| Charts:- Daily , Weekly | |
| Add NVAX to Watchlist: View: Get Complete NVAX Trend Analysis ➞ | |
 | GAMB Gambling.com Group Limited |
| Sector: Services & Goods | |
| SubSector: Gambling | |
| MarketCap: 376 Millions | |
| Recent Price: 11.53 Smart Investing & Trading Score: 10 | |
| Day Percent Change: -4.32% Day Change: -0.52 | |
| Week Change: -4.87% Year-to-date Change: -18.1% | |
| GAMB Links: Profile News Message Board | |
| Charts:- Daily , Weekly | |
| Add GAMB to Watchlist: View: Get Complete GAMB Trend Analysis ➞ | |
| For tabular summary view of above stock list: Summary View ➞ 0 - 25 , 25 - 50 , 50 - 75 , 75 - 100 , 100 - 125 , 125 - 150 , 150 - 175 , 175 - 200 , 200 - 225 , 225 - 250 , 250 - 275 , 275 - 300 , 300 - 325 , 325 - 350 , 350 - 375 , 375 - 400 , 400 - 425 , 425 - 450 , 450 - 475 , 475 - 500 , 500 - 525 , 525 - 550 , 550 - 575 , 575 - 600 , 600 - 625 , 625 - 650 , 650 - 675 , 675 - 700 , 700 - 725 , 725 - 750 , 750 - 775 , 775 - 800 , 800 - 825 , 825 - 850 , 850 - 875 , 875 - 900 , 900 - 925 , 925 - 950 , 950 - 975 , 975 - 1000 , 1000 - 1025 , 1025 - 1050 , 1050 - 1075 , 1075 - 1100 , 1100 - 1125 , 1125 - 1150 , 1150 - 1175 , 1175 - 1200 , 1200 - 1225 , 1225 - 1250 , 1250 - 1275 , 1275 - 1300 , 1300 - 1325 , 1325 - 1350 , 1350 - 1375 , 1375 - 1400 , 1400 - 1425 , 1425 - 1450 , 1450 - 1475 | ||
| Click To Change The Sort Order: By Market Cap or Company Size Performance: Year-to-date, Week and Day | |
| Select Chart Type: | ||
| Too many stocks? View smallcap stocks filtered by marketcap & sector |
| Marketcap: All SmallCap Stocks (default-no microcap), Large, Mid-Range, Small & MicroCap |
| Sector: Tech, Finance, Energy, Staples, Retail, Industrial, Materials, Utilities & Medical |
|
Best Stocks Today 12Stocks.com |
© 2025 12Stocks.com Terms & Conditions Privacy Contact Us
All Information Provided Only For Education And Not To Be Used For Investing or Trading. See Terms & Conditions


One More Thing ... Get Best Stocks Delivered Daily!
Never Ever Miss A Move With Our Top Ten Stocks Lists
Find Best Stocks In Any Market - Bull or Bear Market
Take A Peek At Our Top Ten Stocks Lists: Daily, Weekly, Year-to-Date & Top Trends
Find Best Stocks In Any Market - Bull or Bear Market
Take A Peek At Our Top Ten Stocks Lists: Daily, Weekly, Year-to-Date & Top Trends
Smallcap Stocks With Best Up Trends [0-bearish to 100-bullish]: Agenus [100], NextDecade [100], Ramaco Resources[100], Kratos Defense[100], Harrow Health[100], Central Garden[100], Central Garden[100], Hecla Mining[100], Century Aluminum[100], Green Plains[100], Centrus Energy[100]
Best Smallcap Stocks Year-to-Date:
System1 [589.08%], RAPT [435.44%], ThredUp [409.35%], 908 Devices[215.45%], Centrus Energy[209.86%], Digital Turbine[200.59%], ProKidney [168.64%], OptimizeRx [161.32%], PaySign [159.93%], Agenus [157.66%], Sana [156.44%] Best Smallcap Stocks This Week:
ProKidney [612.49%], Cogint [44.85%], Ramaco Resources[44.42%], Prime Medicine[39.87%], Amprius [37.61%], Inhibrx [33.31%], Rhythm [31.82%], Ventyx Biosciences[31.73%], B. Riley[31.1%], Sana [31.03%], Rimini Street[25.66%] Best Smallcap Stocks Daily:
Agenus [19.26%], NextDecade [16.94%], Astronics [16.15%], Ramaco Resources[15.72%], Kratos Defense[11.76%], Harrow Health[11.35%], AeroVironment [11.04%], Central Garden[10.61%], Central Garden[9.88%], Pulmonx [9.43%], Hecla Mining[7.3%]