
 Login Sign Up


| |||||
 |  | ||||

| 12Stocks.com Market Intelligence |
Best SmallCap Stocks
|
| In a hurry? Small Cap Stock Lists: Performance Trends Table, Stock Charts
Sort Small Cap stocks: Daily, Weekly, Year-to-Date, Market Cap & Trends. Filter Small Cap stocks list by sector: Show all, Tech, Finance, Energy, Staples, Retail, Industrial, Materials, Utilities and HealthCare Filter Small Cap stocks list by size: All Large Medium Small and MicroCap |
| 12Stocks.com Small Cap Stocks Performances & Trends Daily | |||||||||
|
|  The overall Smart Investing & Trading Score is 100 (0-bearish to 100-bullish) which puts Small Cap index in short term bullish trend. The Smart Investing & Trading Score from previous trading session is 93 and hence an improvement of trend.
| ||||||||
Here are the Smart Investing & Trading Scores of the most requested small cap stocks at 12Stocks.com (click stock name for detailed review):
|


| 12Stocks.com: Investing in Smallcap Index with Stocks | |
|
The following table helps investors and traders sort through current performance and trends (as measured by Smart Investing & Trading Score) of various
stocks in the Smallcap Index. Quick View: Move mouse or cursor over stock symbol (ticker) to view short-term technical chart and over stock name to view long term chart. Click on  to add stock symbol to your watchlist and to add stock symbol to your watchlist and  to view watchlist. Click on any ticker or stock name for detailed market intelligence report for that stock. to view watchlist. Click on any ticker or stock name for detailed market intelligence report for that stock. |
12Stocks.com Performance of Stocks in Smallcap Index
| Ticker | Stock Name | Watchlist | Category | Recent Price | Smart Investing & Trading Score | Change % | YTD Change% |
| SPNS | Sapiens |   | Technology | 29.36 | 95 | 0.38% | 12.15% |
| NXRT | NexPoint Residential | | Financials | 33.55 | 35 | 0.69% | -18.57% |
| SUPN | Supernus | | Health Care | 31.82 | 42 | 0.95% | -12.00% |
| PFS | Provident Financial | | Financials | 18.09 | 83 | 3.19% | -2.90% |
| CAKE | Cheesecake Factory | | Services & Goods | 63.70 | 100 | 1.66% | 35.00% |
| CDNA | CareDx | | Services & Goods | 18.85 | 90 | -3.53% | -11.96% |
| IMKTA | Ingles Markets | | Services & Goods | 66.05 | 74 | 4.21% | 3.03% |
| BMEA | Biomea Fusion | | Health Care | 1.72 | 15 | -4.44% | -55.67% |
| CDRE | Cadre | | Industrials | 31.73 | 54 | -0.38% | -1.53% |
| NMIH | NMI | | Financials | 42.88 | 85 | 1.64% | 16.65% |
| UPWK | Upwork | | Technology | 13.52 | 44 | 0.60% | -17.31% |
| DHC | Diversified Healthcare | | Financials | 3.76 | 66 | 5.03% | 64.97% |
| STNG | Scorpio Tankers | | Transports | 39.90 | 36 | 1.97% | -18.89% |
| XPOF | Xponential Fitness | | Services & Goods | 7.37 | 15 | -1.60% | -45.20% |
| PHR | Phreesia | | Technology | 28.49 | 100 | 0.11% | 13.24% |
| TROX | Tronox | | Materials | 5.40 | 10 | 6.51% | -45.50% |
| EB | Eventbrite | | Technology | 2.69 | 85 | 2.28% | -19.94% |
| UIS | Unisys | | Technology | 4.59 | 49 | 1.32% | -27.49% |
| CODI | Compass Diversified | | Industrials | 6.39 | 52 | 1.75% | -71.56% |
| MATW | Matthews | | Services & Goods | 24.59 | 93 | 2.84% | -10.32% |
| WEST | Westrock Coffee | | Consumer Staples | 5.94 | 28 | 3.66% | -7.48% |
| RMR | RMR Group | | Financials | 16.94 | 71 | 3.61% | -13.38% |
| USPH | U.S. Physical | | Health Care | 80.61 | 76 | 3.08% | -8.60% |
| SCHL | Scholastic | | Services & Goods | 21.71 | 68 | 3.48% | 2.81% |
| KAI | Kadant | | Industrials | 325.20 | 57 | 2.44% | -5.54% |
| For chart view version of above stock list: Chart View ➞ 0 - 25 , 25 - 50 , 50 - 75 , 75 - 100 , 100 - 125 , 125 - 150 , 150 - 175 , 175 - 200 , 200 - 225 , 225 - 250 , 250 - 275 , 275 - 300 , 300 - 325 , 325 - 350 , 350 - 375 , 375 - 400 , 400 - 425 , 425 - 450 , 450 - 475 , 475 - 500 , 500 - 525 , 525 - 550 , 550 - 575 , 575 - 600 , 600 - 625 , 625 - 650 , 650 - 675 , 675 - 700 , 700 - 725 , 725 - 750 , 750 - 775 , 775 - 800 , 800 - 825 , 825 - 850 , 850 - 875 , 875 - 900 , 900 - 925 , 925 - 950 , 950 - 975 , 975 - 1000 , 1000 - 1025 , 1025 - 1050 , 1050 - 1075 , 1075 - 1100 , 1100 - 1125 , 1125 - 1150 , 1150 - 1175 , 1175 - 1200 , 1200 - 1225 , 1225 - 1250 , 1250 - 1275 , 1275 - 1300 , 1300 - 1325 , 1325 - 1350 , 1350 - 1375 , 1375 - 1400 , 1400 - 1425 , 1425 - 1450 , 1450 - 1475 | ||
 | Click To Change The Sort Order: By Market Cap or Company Size Performance: Year-to-date, Week and Day |  |
| Too many stocks? View smallcap stocks filtered by marketcap & sector |
| Marketcap: All SmallCap Stocks (default-no microcap), Large, Mid-Range, Small |
| Smallcap Sector: Tech, Finance, Energy, Staples, Retail, Industrial, Materials, & Medical |
|
Get the most comprehensive stock market coverage daily at 12Stocks.com ➞ Best Stocks Today ➞ Best Stocks Weekly ➞ Best Stocks Year-to-Date ➞ Best Stocks Trends ➞  Best Stocks Today 12Stocks.com Best Nasdaq Stocks ➞ Best S&P 500 Stocks ➞ Best Tech Stocks ➞ Best Biotech Stocks ➞ |
| Detailed Overview of SmallCap Stocks |
| SmallCap Technical Overview, Leaders & Laggards, Top SmallCap ETF Funds & Detailed SmallCap Stocks List, Charts, Trends & More |
| Smallcap: Technical Analysis, Trends & YTD Performance | |
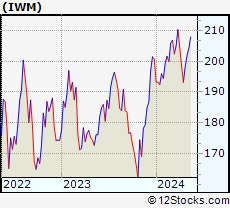
| SmallCap segment as represented by
IWM, an exchange-traded fund [ETF], holds basket of thousands of smallcap stocks from across all major sectors of the US stock market. The smallcap index (contains stocks like Riverbed & Sotheby's) is down by -1.11% and is currently underperforming the overall market by -6.35% year-to-date. Below is a quick view of technical charts and trends: | |
 IWM Weekly Chart |
|
| Long Term Trend: Very Good | |
| Medium Term Trend: Very Good | |
 IWM Daily Chart |
|
| Short Term Trend: Very Good | |
| Overall Trend Score: 100 | |
| YTD Performance: -1.11% | |
| **Trend Scores & Views Are Only For Educational Purposes And Not For Investing | |
| 12Stocks.com: Top Performing Small Cap Index Stocks | ||||||||||||||||||||||||||||||||||||||||||||||||
 The top performing Small Cap Index stocks year to date are
Now, more recently, over last week, the top performing Small Cap Index stocks on the move are


|
||||||||||||||||||||||||||||||||||||||||||||||||
| 12Stocks.com: Investing in Smallcap Index using Exchange Traded Funds | |
|
The following table shows list of key exchange traded funds (ETF) that
help investors track Smallcap index. The following list also includes leveraged ETF funds that track twice or thrice the daily returns of Smallcap indices. Short or inverse ETF funds move in the opposite direction to the index they track and are useful during market pullbacks or during bear markets. Quick View: Move mouse or cursor over ETF symbol (ticker) to view short-term technical chart and over ETF name to view long term chart. Click on ticker or stock name for detailed view. Click on to add stock symbol to your watchlist and to view watchlist. |
12Stocks.com List of ETFs that track Smallcap Index
| Ticker | ETF Name | Watchlist | Recent Price | Smart Investing & Trading Score | Change % | Week % | Year-to-date % |
| IWM | iShares Russell 2000 | | 218.01 | 100 | 1.03 | 1.17 | -1.11% |
| 12Stocks.com: Charts, Trends, Fundamental Data and Performances of SmallCap Stocks | |
|
We now take in-depth look at all SmallCap stocks including charts, multi-period performances and overall trends (as measured by Smart Investing & Trading Score). One can sort SmallCap stocks (click link to choose) by Daily, Weekly and by Year-to-Date performances. Also, one can sort by size of the company or by market capitalization. |
| Select Your Default Chart Type: | |||||
| |||||
| Click on stock symbol or name for detailed view. Click on to add stock symbol to your watchlist and to view watchlist. Quick View: Move mouse or cursor over "Daily" to quickly view daily technical stock chart and over "Weekly" to view weekly technical stock chart. | |||||

 | SPNS Sapiens International Corporation N.V. |
| Sector: Technology | |
| SubSector: Business Software & Services | |
| MarketCap: 841.858 Millions | |
| Recent Price: 29.36 Smart Investing & Trading Score: 95 | |
| Day Percent Change: 0.38% Day Change: 0.11 | |
| Week Change: 2.12% Year-to-date Change: 12.2% | |
| SPNS Links: Profile News Message Board | |
| Charts:- Daily , Weekly | |
| Add SPNS to Watchlist: View: Get Complete SPNS Trend Analysis ➞ | |
 | NXRT NexPoint Residential Trust, Inc. |
| Sector: Financials | |
| SubSector: REIT - Residential | |
| MarketCap: 839.161 Millions | |
| Recent Price: 33.55 Smart Investing & Trading Score: 35 | |
| Day Percent Change: 0.69% Day Change: 0.23 | |
| Week Change: 1.08% Year-to-date Change: -18.6% | |
| NXRT Links: Profile News Message Board | |
| Charts:- Daily , Weekly | |
| Add NXRT to Watchlist: View: Get Complete NXRT Trend Analysis ➞ | |
 | SUPN Supernus Pharmaceuticals, Inc. |
| Sector: Health Care | |
| SubSector: Drugs - Generic | |
| MarketCap: 833.585 Millions | |
| Recent Price: 31.82 Smart Investing & Trading Score: 42 | |
| Day Percent Change: 0.95% Day Change: 0.3 | |
| Week Change: 2.12% Year-to-date Change: -12.0% | |
| SUPN Links: Profile News Message Board | |
| Charts:- Daily , Weekly | |
| Add SUPN to Watchlist: View: Get Complete SUPN Trend Analysis ➞ | |
 | PFS Provident Financial Services, Inc. |
| Sector: Financials | |
| SubSector: Savings & Loans | |
| MarketCap: 829.73 Millions | |
| Recent Price: 18.09 Smart Investing & Trading Score: 83 | |
| Day Percent Change: 3.19% Day Change: 0.56 | |
| Week Change: 2.15% Year-to-date Change: -2.9% | |
| PFS Links: Profile News Message Board | |
| Charts:- Daily , Weekly | |
| Add PFS to Watchlist: View: Get Complete PFS Trend Analysis ➞ | |
 | CAKE The Cheesecake Factory Incorporated |
| Sector: Services & Goods | |
| SubSector: Restaurants | |
| MarketCap: 829 Millions | |
| Recent Price: 63.70 Smart Investing & Trading Score: 100 | |
| Day Percent Change: 1.66% Day Change: 1.04 | |
| Week Change: 2.33% Year-to-date Change: 35.0% | |
| CAKE Links: Profile News Message Board | |
| Charts:- Daily , Weekly | |
| Add CAKE to Watchlist: View: Get Complete CAKE Trend Analysis ➞ | |
 | CDNA CareDx, Inc |
| Sector: Services & Goods | |
| SubSector: Research Services | |
| MarketCap: 828.194 Millions | |
| Recent Price: 18.85 Smart Investing & Trading Score: 90 | |
| Day Percent Change: -3.53% Day Change: -0.69 | |
| Week Change: -1.98% Year-to-date Change: -12.0% | |
| CDNA Links: Profile News Message Board | |
| Charts:- Daily , Weekly | |
| Add CDNA to Watchlist: View: Get Complete CDNA Trend Analysis ➞ | |
 | IMKTA Ingles Markets, Incorporated |
| Sector: Services & Goods | |
| SubSector: Grocery Stores | |
| MarketCap: 827.075 Millions | |
| Recent Price: 66.05 Smart Investing & Trading Score: 74 | |
| Day Percent Change: 4.21% Day Change: 2.67 | |
| Week Change: 5.61% Year-to-date Change: 3.0% | |
| IMKTA Links: Profile News Message Board | |
| Charts:- Daily , Weekly | |
| Add IMKTA to Watchlist: View: Get Complete IMKTA Trend Analysis ➞ | |
 | BMEA Biomea Fusion, Inc. |
| Sector: Health Care | |
| SubSector: Biotechnology | |
| MarketCap: 818 Millions | |
| Recent Price: 1.72 Smart Investing & Trading Score: 15 | |
| Day Percent Change: -4.44% Day Change: -0.08 | |
| Week Change: -4.97% Year-to-date Change: -55.7% | |
| BMEA Links: Profile News Message Board | |
| Charts:- Daily , Weekly | |
| Add BMEA to Watchlist: View: Get Complete BMEA Trend Analysis ➞ | |
 | CDRE Cadre Holdings, Inc. |
| Sector: Industrials | |
| SubSector: Aerospace & Defense | |
| MarketCap: 817 Millions | |
| Recent Price: 31.73 Smart Investing & Trading Score: 54 | |
| Day Percent Change: -0.38% Day Change: -0.12 | |
| Week Change: -0.94% Year-to-date Change: -1.5% | |
| CDRE Links: Profile News Message Board | |
| Charts:- Daily , Weekly | |
| Add CDRE to Watchlist: View: Get Complete CDRE Trend Analysis ➞ | |
 | NMIH NMI Holdings, Inc. |
| Sector: Financials | |
| SubSector: Surety & Title Insurance | |
| MarketCap: 816.018 Millions | |
| Recent Price: 42.88 Smart Investing & Trading Score: 85 | |
| Day Percent Change: 1.64% Day Change: 0.69 | |
| Week Change: 1.64% Year-to-date Change: 16.7% | |
| NMIH Links: Profile News Message Board | |
| Charts:- Daily , Weekly | |
| Add NMIH to Watchlist: View: Get Complete NMIH Trend Analysis ➞ | |
 | UPWK Upwork Inc. |
| Sector: Technology | |
| SubSector: Internet Information Providers | |
| MarketCap: 815.98 Millions | |
| Recent Price: 13.52 Smart Investing & Trading Score: 44 | |
| Day Percent Change: 0.6% Day Change: 0.08 | |
| Week Change: -0.81% Year-to-date Change: -17.3% | |
| UPWK Links: Profile News Message Board | |
| Charts:- Daily , Weekly | |
| Add UPWK to Watchlist: View: Get Complete UPWK Trend Analysis ➞ | |
 | DHC Diversified Healthcare Trust |
| Sector: Financials | |
| SubSector: REIT - Healthcare Facilities | |
| MarketCap: 814.114 Millions | |
| Recent Price: 3.76 Smart Investing & Trading Score: 66 | |
| Day Percent Change: 5.03% Day Change: 0.18 | |
| Week Change: 5.62% Year-to-date Change: 65.0% | |
| DHC Links: Profile News Message Board | |
| Charts:- Daily , Weekly | |
| Add DHC to Watchlist: View: Get Complete DHC Trend Analysis ➞ | |
 | STNG Scorpio Tankers Inc. |
| Sector: Transports | |
| SubSector: Shipping | |
| MarketCap: 813.214 Millions | |
| Recent Price: 39.90 Smart Investing & Trading Score: 36 | |
| Day Percent Change: 1.97% Day Change: 0.77 | |
| Week Change: -1.24% Year-to-date Change: -18.9% | |
| STNG Links: Profile News Message Board | |
| Charts:- Daily , Weekly | |
| Add STNG to Watchlist: View: Get Complete STNG Trend Analysis ➞ | |
 | XPOF Xponential Fitness, Inc. |
| Sector: Services & Goods | |
| SubSector: Leisure | |
| MarketCap: 811 Millions | |
| Recent Price: 7.37 Smart Investing & Trading Score: 15 | |
| Day Percent Change: -1.6% Day Change: -0.12 | |
| Week Change: -3.03% Year-to-date Change: -45.2% | |
| XPOF Links: Profile News Message Board | |
| Charts:- Daily , Weekly | |
| Add XPOF to Watchlist: View: Get Complete XPOF Trend Analysis ➞ | |
 | PHR Phreesia, Inc. |
| Sector: Technology | |
| SubSector: Healthcare Information Services | |
| MarketCap: 810.255 Millions | |
| Recent Price: 28.49 Smart Investing & Trading Score: 100 | |
| Day Percent Change: 0.11% Day Change: 0.03 | |
| Week Change: 0% Year-to-date Change: 13.2% | |
| PHR Links: Profile News Message Board | |
| Charts:- Daily , Weekly | |
| Add PHR to Watchlist: View: Get Complete PHR Trend Analysis ➞ | |
 | TROX Tronox Holdings plc |
| Sector: Materials | |
| SubSector: Chemicals - Major Diversified | |
| MarketCap: 807 Millions | |
| Recent Price: 5.40 Smart Investing & Trading Score: 10 | |
| Day Percent Change: 6.51% Day Change: 0.33 | |
| Week Change: -4.26% Year-to-date Change: -45.5% | |
| TROX Links: Profile News Message Board | |
| Charts:- Daily , Weekly | |
| Add TROX to Watchlist: View: Get Complete TROX Trend Analysis ➞ | |
 | EB Eventbrite, Inc. |
| Sector: Technology | |
| SubSector: Application Software | |
| MarketCap: 805.262 Millions | |
| Recent Price: 2.69 Smart Investing & Trading Score: 85 | |
| Day Percent Change: 2.28% Day Change: 0.06 | |
| Week Change: -0.37% Year-to-date Change: -19.9% | |
| EB Links: Profile News Message Board | |
| Charts:- Daily , Weekly | |
| Add EB to Watchlist: View: Get Complete EB Trend Analysis ➞ | |
 | UIS Unisys Corporation |
| Sector: Technology | |
| SubSector: Information Technology Services | |
| MarketCap: 803.868 Millions | |
| Recent Price: 4.59 Smart Investing & Trading Score: 49 | |
| Day Percent Change: 1.32% Day Change: 0.06 | |
| Week Change: 2.23% Year-to-date Change: -27.5% | |
| UIS Links: Profile News Message Board | |
| Charts:- Daily , Weekly | |
| Add UIS to Watchlist: View: Get Complete UIS Trend Analysis ➞ | |
 | CODI Compass Diversified Holdings LLC |
| Sector: Industrials | |
| SubSector: Conglomerates | |
| MarketCap: 803.348 Millions | |
| Recent Price: 6.39 Smart Investing & Trading Score: 52 | |
| Day Percent Change: 1.75% Day Change: 0.11 | |
| Week Change: 4.07% Year-to-date Change: -71.6% | |
| CODI Links: Profile News Message Board | |
| Charts:- Daily , Weekly | |
| Add CODI to Watchlist: View: Get Complete CODI Trend Analysis ➞ | |
 | MATW Matthews International Corporation |
| Sector: Services & Goods | |
| SubSector: Personal Services | |
| MarketCap: 803.325 Millions | |
| Recent Price: 24.59 Smart Investing & Trading Score: 93 | |
| Day Percent Change: 2.84% Day Change: 0.68 | |
| Week Change: 0.94% Year-to-date Change: -10.3% | |
| MATW Links: Profile News Message Board | |
| Charts:- Daily , Weekly | |
| Add MATW to Watchlist: View: Get Complete MATW Trend Analysis ➞ | |
 | WEST Westrock Coffee Company, LLC |
| Sector: Consumer Staples | |
| SubSector: Packaged Foods | |
| MarketCap: 799 Millions | |
| Recent Price: 5.94 Smart Investing & Trading Score: 28 | |
| Day Percent Change: 3.66% Day Change: 0.21 | |
| Week Change: -0.17% Year-to-date Change: -7.5% | |
| WEST Links: Profile News Message Board | |
| Charts:- Daily , Weekly | |
| Add WEST to Watchlist: View: Get Complete WEST Trend Analysis ➞ | |
 | RMR The RMR Group Inc. |
| Sector: Financials | |
| SubSector: Real Estate Development | |
| MarketCap: 797.419 Millions | |
| Recent Price: 16.94 Smart Investing & Trading Score: 71 | |
| Day Percent Change: 3.61% Day Change: 0.59 | |
| Week Change: 1.56% Year-to-date Change: -13.4% | |
| RMR Links: Profile News Message Board | |
| Charts:- Daily , Weekly | |
| Add RMR to Watchlist: View: Get Complete RMR Trend Analysis ➞ | |
 | USPH U.S. Physical Therapy, Inc. |
| Sector: Health Care | |
| SubSector: Specialized Health Services | |
| MarketCap: 793.556 Millions | |
| Recent Price: 80.61 Smart Investing & Trading Score: 76 | |
| Day Percent Change: 3.08% Day Change: 2.41 | |
| Week Change: 2% Year-to-date Change: -8.6% | |
| USPH Links: Profile News Message Board | |
| Charts:- Daily , Weekly | |
| Add USPH to Watchlist: View: Get Complete USPH Trend Analysis ➞ | |
 | SCHL Scholastic Corporation |
| Sector: Services & Goods | |
| SubSector: Publishing - Books | |
| MarketCap: 791 Millions | |
| Recent Price: 21.71 Smart Investing & Trading Score: 68 | |
| Day Percent Change: 3.48% Day Change: 0.73 | |
| Week Change: 2.07% Year-to-date Change: 2.8% | |
| SCHL Links: Profile News Message Board | |
| Charts:- Daily , Weekly | |
| Add SCHL to Watchlist: View: Get Complete SCHL Trend Analysis ➞ | |
 | KAI Kadant Inc. |
| Sector: Industrials | |
| SubSector: Diversified Machinery | |
| MarketCap: 787.116 Millions | |
| Recent Price: 325.20 Smart Investing & Trading Score: 57 | |
| Day Percent Change: 2.44% Day Change: 7.75 | |
| Week Change: 3.72% Year-to-date Change: -5.5% | |
| KAI Links: Profile News Message Board | |
| Charts:- Daily , Weekly | |
| Add KAI to Watchlist: View: Get Complete KAI Trend Analysis ➞ | |
| For tabular summary view of above stock list: Summary View ➞ 0 - 25 , 25 - 50 , 50 - 75 , 75 - 100 , 100 - 125 , 125 - 150 , 150 - 175 , 175 - 200 , 200 - 225 , 225 - 250 , 250 - 275 , 275 - 300 , 300 - 325 , 325 - 350 , 350 - 375 , 375 - 400 , 400 - 425 , 425 - 450 , 450 - 475 , 475 - 500 , 500 - 525 , 525 - 550 , 550 - 575 , 575 - 600 , 600 - 625 , 625 - 650 , 650 - 675 , 675 - 700 , 700 - 725 , 725 - 750 , 750 - 775 , 775 - 800 , 800 - 825 , 825 - 850 , 850 - 875 , 875 - 900 , 900 - 925 , 925 - 950 , 950 - 975 , 975 - 1000 , 1000 - 1025 , 1025 - 1050 , 1050 - 1075 , 1075 - 1100 , 1100 - 1125 , 1125 - 1150 , 1150 - 1175 , 1175 - 1200 , 1200 - 1225 , 1225 - 1250 , 1250 - 1275 , 1275 - 1300 , 1300 - 1325 , 1325 - 1350 , 1350 - 1375 , 1375 - 1400 , 1400 - 1425 , 1425 - 1450 , 1450 - 1475 | ||
| Click To Change The Sort Order: By Market Cap or Company Size Performance: Year-to-date, Week and Day | |
| Select Chart Type: | ||
| Too many stocks? View smallcap stocks filtered by marketcap & sector |
| Marketcap: All SmallCap Stocks (default-no microcap), Large, Mid-Range, Small & MicroCap |
| Sector: Tech, Finance, Energy, Staples, Retail, Industrial, Materials, Utilities & Medical |
|
Best Stocks Today 12Stocks.com |
© 2025 12Stocks.com Terms & Conditions Privacy Contact Us
All Information Provided Only For Education And Not To Be Used For Investing or Trading. See Terms & Conditions


One More Thing ... Get Best Stocks Delivered Daily!
Never Ever Miss A Move With Our Top Ten Stocks Lists
Find Best Stocks In Any Market - Bull or Bear Market
Take A Peek At Our Top Ten Stocks Lists: Daily, Weekly, Year-to-Date & Top Trends
Find Best Stocks In Any Market - Bull or Bear Market
Take A Peek At Our Top Ten Stocks Lists: Daily, Weekly, Year-to-Date & Top Trends
Smallcap Stocks With Best Up Trends [0-bearish to 100-bullish]: Commercial Vehicle[100], Fluence Energy[100], Aehr Test[100], Stoneridge [100], Monro [100], Abercrombie & Fitch Co[100], ArcBest [100], Sally Beauty[100], Shutterstock [100], America s[100], EVI Industries[100]
Best Smallcap Stocks Year-to-Date:
ThredUp [460.43%], System1 [459.95%], RAPT [363.92%], Digital Turbine[244.97%], 908 Devices[194.55%], OptimizeRx [179.63%], X4 [153.41%], Centrus Energy[153.28%], PaySign [144.37%], National Vision[132.25%], Easterly Government[109.1%] Best Smallcap Stocks This Week:
Ispire [38.7%], Tilly s[30.4%], FiscalNote [28.17%], Commercial Vehicle[23.49%], Altimmune [20.86%], Krispy Kreme[20.38%], Fluence Energy[19.54%], Energy Vault[19.46%], IGM Biosciences[19.44%], Vivid Seats[18.13%], Cipher Mining[15.02%] Best Smallcap Stocks Daily:
Dillard s[9999%], Ispire [24.61%], Shoals [23.88%], Tilly s[18.12%], BRC [15.27%], IGM Biosciences[15.18%], FiscalNote [15.01%], Chegg [14.05%], Designer Brands[13.45%], Verrica [13.37%], Beauty Health[13.09%]