
 Login Sign Up


| |||||
 |  | ||||

| 12Stocks.com Market Intelligence |
Best SmallCap Stocks
|
| In a hurry? Small Cap Stock Lists: Performance Trends Table, Stock Charts
Sort Small Cap stocks: Daily, Weekly, Year-to-Date, Market Cap & Trends. Filter Small Cap stocks list by sector: Show all, Tech, Finance, Energy, Staples, Retail, Industrial, Materials, Utilities and HealthCare Filter Small Cap stocks list by size: All Large Medium Small and MicroCap |
| 12Stocks.com Small Cap Stocks Performances & Trends Daily | |||||||||
|
|  The overall Smart Investing & Trading Score is 76 (0-bearish to 100-bullish) which puts Small Cap index in short term neutral to bullish trend. The Smart Investing & Trading Score from previous trading session is 78 and hence a deterioration of trend.
| ||||||||
Here are the Smart Investing & Trading Scores of the most requested small cap stocks at 12Stocks.com (click stock name for detailed review):
|


| 12Stocks.com: Investing in Smallcap Index with Stocks | |
|
The following table helps investors and traders sort through current performance and trends (as measured by Smart Investing & Trading Score) of various
stocks in the Smallcap Index. Quick View: Move mouse or cursor over stock symbol (ticker) to view short-term technical chart and over stock name to view long term chart. Click on  to add stock symbol to your watchlist and to add stock symbol to your watchlist and  to view watchlist. Click on any ticker or stock name for detailed market intelligence report for that stock. to view watchlist. Click on any ticker or stock name for detailed market intelligence report for that stock. |
12Stocks.com Performance of Stocks in Smallcap Index
| Ticker | Stock Name | Watchlist | Category | Recent Price | Smart Investing & Trading Score | Change % | YTD Change% |
| GEF | Greif |   | Consumer Staples | 68.21 | 63 | -0.84% | 12.69% |
| SEAT | Vivid Seats | | Services & Goods | 1.92 | 54 | -2.54% | -58.53% |
| WABC | Westamerica Ban | | Financials | 51.18 | 88 | 0.97% | -1.60% |
| TMCI | Treace Medical | | Health Care | 6.16 | 52 | 1.82% | -17.20% |
| BAND | Bandwidth | | Technology | 16.07 | 78 | 1.97% | -5.58% |
| HMN | Horace Mann | | Financials | 41.50 | 13 | -0.72% | 6.68% |
| AIN | Albany | | Industrials | 70.31 | 63 | -0.68% | -11.76% |
| ABCB | Ameris Bancorp | | Financials | 67.22 | 83 | 0.28% | 7.81% |
| WK | Workiva | | Technology | 71.01 | 74 | 4.07% | -35.15% |
| KFY | Korn Ferry | | Services & Goods | 73.81 | 70 | 0.60% | 10.20% |
| AIT | Applied Industrial | | Services & Goods | 247.66 | 95 | 1.44% | 3.60% |
| BMI | Badger Meter | | Technology | 237.96 | 26 | -0.65% | 12.37% |
| ALKT | Alkami | | Technology | 30.19 | 83 | -0.23% | -17.69% |
| ACLX | Arcellx | | Health Care | 66.56 | 93 | 1.54% | -13.21% |
| TTEC | TTEC | | Technology | 5.19 | 90 | 3.80% | 4.01% |
| VICR | Vicor | | Technology | 45.64 | 66 | 0.55% | -5.55% |
| RHP | Ryman Hospitality | | Financials | 102.32 | 70 | 0.77% | -0.69% |
| APLE | Apple Hospitality | | Financials | 12.07 | 88 | 1.77% | -20.03% |
| MNRO | Monro | | Consumer Staples | 15.92 | 68 | 0.89% | -34.82% |
| CMP | Compass Minerals | | Materials | 21.84 | 58 | -0.27% | 94.13% |
| COCO | Vita Coco | | Consumer Staples | 37.56 | 90 | -2.16% | 1.76% |
| SMR | NuScale Power | | Industrials | 35.08 | 56 | -4.41% | 95.65% |
| MATX | Matson | | Transports | 112.79 | 68 | 2.26% | -16.14% |
| AMBA | Ambarella | | Technology | 66.81 | 90 | 1.89% | -8.15% |
| CTRE | CareTrust REIT | | Financials | 30.95 | 78 | -0.29% | 15.76% |
| For chart view version of above stock list: Chart View ➞ 0 - 25 , 25 - 50 , 50 - 75 , 75 - 100 , 100 - 125 , 125 - 150 , 150 - 175 , 175 - 200 , 200 - 225 , 225 - 250 , 250 - 275 , 275 - 300 , 300 - 325 , 325 - 350 , 350 - 375 , 375 - 400 , 400 - 425 , 425 - 450 , 450 - 475 , 475 - 500 , 500 - 525 , 525 - 550 , 550 - 575 , 575 - 600 , 600 - 625 , 625 - 650 , 650 - 675 , 675 - 700 , 700 - 725 , 725 - 750 , 750 - 775 , 775 - 800 , 800 - 825 , 825 - 850 , 850 - 875 , 875 - 900 , 900 - 925 , 925 - 950 , 950 - 975 , 975 - 1000 , 1000 - 1025 , 1025 - 1050 , 1050 - 1075 , 1075 - 1100 , 1100 - 1125 , 1125 - 1150 , 1150 - 1175 , 1175 - 1200 , 1200 - 1225 , 1225 - 1250 , 1250 - 1275 , 1275 - 1300 , 1300 - 1325 , 1325 - 1350 , 1350 - 1375 , 1375 - 1400 , 1400 - 1425 , 1425 - 1450 , 1450 - 1475 | ||
 | Click To Change The Sort Order: By Market Cap or Company Size Performance: Year-to-date, Week and Day |  |
| Too many stocks? View smallcap stocks filtered by marketcap & sector |
| Marketcap: All SmallCap Stocks (default-no microcap), Large, Mid-Range, Small |
| Smallcap Sector: Tech, Finance, Energy, Staples, Retail, Industrial, Materials, & Medical |
|
Get the most comprehensive stock market coverage daily at 12Stocks.com ➞ Best Stocks Today ➞ Best Stocks Weekly ➞ Best Stocks Year-to-Date ➞ Best Stocks Trends ➞  Best Stocks Today 12Stocks.com Best Nasdaq Stocks ➞ Best S&P 500 Stocks ➞ Best Tech Stocks ➞ Best Biotech Stocks ➞ |
| Detailed Overview of SmallCap Stocks |
| SmallCap Technical Overview, Leaders & Laggards, Top SmallCap ETF Funds & Detailed SmallCap Stocks List, Charts, Trends & More |
| Smallcap: Technical Analysis, Trends & YTD Performance | |
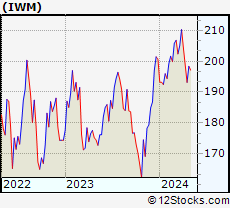
| SmallCap segment as represented by
IWM, an exchange-traded fund [ETF], holds basket of thousands of smallcap stocks from across all major sectors of the US stock market. The smallcap index (contains stocks like Riverbed & Sotheby's) is up by 0.36% and is currently underperforming the overall market by -5.45% year-to-date. Below is a quick view of technical charts and trends: | |
 IWM Weekly Chart |
|
| Long Term Trend: Very Good | |
| Medium Term Trend: Very Good | |
 IWM Daily Chart |
|
| Short Term Trend: Good | |
| Overall Trend Score: 76 | |
| YTD Performance: 0.36% | |
| **Trend Scores & Views Are Only For Educational Purposes And Not For Investing | |
| 12Stocks.com: Top Performing Small Cap Index Stocks | ||||||||||||||||||||||||||||||||||||||||||||||||
 The top performing Small Cap Index stocks year to date are
Now, more recently, over last week, the top performing Small Cap Index stocks on the move are


|
||||||||||||||||||||||||||||||||||||||||||||||||
| 12Stocks.com: Investing in Smallcap Index using Exchange Traded Funds | |
|
The following table shows list of key exchange traded funds (ETF) that
help investors track Smallcap index. The following list also includes leveraged ETF funds that track twice or thrice the daily returns of Smallcap indices. Short or inverse ETF funds move in the opposite direction to the index they track and are useful during market pullbacks or during bear markets. Quick View: Move mouse or cursor over ETF symbol (ticker) to view short-term technical chart and over ETF name to view long term chart. Click on ticker or stock name for detailed view. Click on to add stock symbol to your watchlist and to view watchlist. |
12Stocks.com List of ETFs that track Smallcap Index
| Ticker | ETF Name | Watchlist | Recent Price | Smart Investing & Trading Score | Change % | Week % | Year-to-date % |
| IWM | iShares Russell 2000 | | 221.25 | 76 | 0.69 | -0.82 | 0.36% |
| 12Stocks.com: Charts, Trends, Fundamental Data and Performances of SmallCap Stocks | |
|
We now take in-depth look at all SmallCap stocks including charts, multi-period performances and overall trends (as measured by Smart Investing & Trading Score). One can sort SmallCap stocks (click link to choose) by Daily, Weekly and by Year-to-Date performances. Also, one can sort by size of the company or by market capitalization. |
| Select Your Default Chart Type: | |||||
| |||||
| Click on stock symbol or name for detailed view. Click on to add stock symbol to your watchlist and to view watchlist. Quick View: Move mouse or cursor over "Daily" to quickly view daily technical stock chart and over "Weekly" to view weekly technical stock chart. | |||||

 | GEF Greif, Inc. |
| Sector: Consumer Staples | |
| SubSector: Packaging & Containers | |
| MarketCap: 1563.03 Millions | |
| Recent Price: 68.21 Smart Investing & Trading Score: 63 | |
| Day Percent Change: -0.84% Day Change: -0.58 | |
| Week Change: -2.18% Year-to-date Change: 12.7% | |
| GEF Links: Profile News Message Board | |
| Charts:- Daily , Weekly | |
| Add GEF to Watchlist: View: Get Complete GEF Trend Analysis ➞ | |
 | SEAT Vivid Seats Inc. |
| Sector: Services & Goods | |
| SubSector: Internet Content & Information | |
| MarketCap: 1560 Millions | |
| Recent Price: 1.92 Smart Investing & Trading Score: 54 | |
| Day Percent Change: -2.54% Day Change: -0.05 | |
| Week Change: 3.23% Year-to-date Change: -58.5% | |
| SEAT Links: Profile News Message Board | |
| Charts:- Daily , Weekly | |
| Add SEAT to Watchlist: View: Get Complete SEAT Trend Analysis ➞ | |
 | WABC Westamerica Bancorporation |
| Sector: Financials | |
| SubSector: Regional - Pacific Banks | |
| MarketCap: 1557.69 Millions | |
| Recent Price: 51.18 Smart Investing & Trading Score: 88 | |
| Day Percent Change: 0.97% Day Change: 0.49 | |
| Week Change: -0.33% Year-to-date Change: -1.6% | |
| WABC Links: Profile News Message Board | |
| Charts:- Daily , Weekly | |
| Add WABC to Watchlist: View: Get Complete WABC Trend Analysis ➞ | |
 | TMCI Treace Medical Concepts, Inc. |
| Sector: Health Care | |
| SubSector: Medical Devices | |
| MarketCap: 1550 Millions | |
| Recent Price: 6.16 Smart Investing & Trading Score: 52 | |
| Day Percent Change: 1.82% Day Change: 0.11 | |
| Week Change: -0.32% Year-to-date Change: -17.2% | |
| TMCI Links: Profile News Message Board | |
| Charts:- Daily , Weekly | |
| Add TMCI to Watchlist: View: Get Complete TMCI Trend Analysis ➞ | |
 | BAND Bandwidth Inc. |
| Sector: Technology | |
| SubSector: Business Software & Services | |
| MarketCap: 1549.38 Millions | |
| Recent Price: 16.07 Smart Investing & Trading Score: 78 | |
| Day Percent Change: 1.97% Day Change: 0.31 | |
| Week Change: 0.12% Year-to-date Change: -5.6% | |
| BAND Links: Profile News Message Board | |
| Charts:- Daily , Weekly | |
| Add BAND to Watchlist: View: Get Complete BAND Trend Analysis ➞ | |
 | HMN Horace Mann Educators Corporation |
| Sector: Financials | |
| SubSector: Property & Casualty Insurance | |
| MarketCap: 1545.52 Millions | |
| Recent Price: 41.50 Smart Investing & Trading Score: 13 | |
| Day Percent Change: -0.72% Day Change: -0.3 | |
| Week Change: -2.58% Year-to-date Change: 6.7% | |
| HMN Links: Profile News Message Board | |
| Charts:- Daily , Weekly | |
| Add HMN to Watchlist: View: Get Complete HMN Trend Analysis ➞ | |
 | AIN Albany International Corp. |
| Sector: Industrials | |
| SubSector: Textile Industrial | |
| MarketCap: 1538.4 Millions | |
| Recent Price: 70.31 Smart Investing & Trading Score: 63 | |
| Day Percent Change: -0.68% Day Change: -0.48 | |
| Week Change: -2.66% Year-to-date Change: -11.8% | |
| AIN Links: Profile News Message Board | |
| Charts:- Daily , Weekly | |
| Add AIN to Watchlist: View: Get Complete AIN Trend Analysis ➞ | |
 | ABCB Ameris Bancorp |
| Sector: Financials | |
| SubSector: Regional - Mid-Atlantic Banks | |
| MarketCap: 1537.79 Millions | |
| Recent Price: 67.22 Smart Investing & Trading Score: 83 | |
| Day Percent Change: 0.28% Day Change: 0.19 | |
| Week Change: -0.77% Year-to-date Change: 7.8% | |
| ABCB Links: Profile News Message Board | |
| Charts:- Daily , Weekly | |
| Add ABCB to Watchlist: View: Get Complete ABCB Trend Analysis ➞ | |
 | WK Workiva Inc. |
| Sector: Technology | |
| SubSector: Application Software | |
| MarketCap: 1537.42 Millions | |
| Recent Price: 71.01 Smart Investing & Trading Score: 74 | |
| Day Percent Change: 4.07% Day Change: 2.78 | |
| Week Change: 2.59% Year-to-date Change: -35.2% | |
| WK Links: Profile News Message Board | |
| Charts:- Daily , Weekly | |
| Add WK to Watchlist: View: Get Complete WK Trend Analysis ➞ | |
 | KFY Korn Ferry |
| Sector: Services & Goods | |
| SubSector: Staffing & Outsourcing Services | |
| MarketCap: 1534.28 Millions | |
| Recent Price: 73.81 Smart Investing & Trading Score: 70 | |
| Day Percent Change: 0.6% Day Change: 0.44 | |
| Week Change: -0.23% Year-to-date Change: 10.2% | |
| KFY Links: Profile News Message Board | |
| Charts:- Daily , Weekly | |
| Add KFY to Watchlist: View: Get Complete KFY Trend Analysis ➞ | |
 | AIT Applied Industrial Technologies, Inc. |
| Sector: Services & Goods | |
| SubSector: Industrial Equipment Wholesale | |
| MarketCap: 1531.58 Millions | |
| Recent Price: 247.66 Smart Investing & Trading Score: 95 | |
| Day Percent Change: 1.44% Day Change: 3.51 | |
| Week Change: 0.78% Year-to-date Change: 3.6% | |
| AIT Links: Profile News Message Board | |
| Charts:- Daily , Weekly | |
| Add AIT to Watchlist: View: Get Complete AIT Trend Analysis ➞ | |
 | BMI Badger Meter, Inc. |
| Sector: Technology | |
| SubSector: Scientific & Technical Instruments | |
| MarketCap: 1530.53 Millions | |
| Recent Price: 237.96 Smart Investing & Trading Score: 26 | |
| Day Percent Change: -0.65% Day Change: -1.55 | |
| Week Change: -1.92% Year-to-date Change: 12.4% | |
| BMI Links: Profile News Message Board | |
| Charts:- Daily , Weekly | |
| Add BMI to Watchlist: View: Get Complete BMI Trend Analysis ➞ | |
 | ALKT Alkami Technology, Inc. |
| Sector: Technology | |
| SubSector: Software - Application | |
| MarketCap: 1530 Millions | |
| Recent Price: 30.19 Smart Investing & Trading Score: 83 | |
| Day Percent Change: -0.23% Day Change: -0.07 | |
| Week Change: -1.47% Year-to-date Change: -17.7% | |
| ALKT Links: Profile News Message Board | |
| Charts:- Daily , Weekly | |
| Add ALKT to Watchlist: View: Get Complete ALKT Trend Analysis ➞ | |
 | ACLX Arcellx, Inc. |
| Sector: Health Care | |
| SubSector: Biotechnology | |
| MarketCap: 1530 Millions | |
| Recent Price: 66.56 Smart Investing & Trading Score: 93 | |
| Day Percent Change: 1.54% Day Change: 1.01 | |
| Week Change: -0.89% Year-to-date Change: -13.2% | |
| ACLX Links: Profile News Message Board | |
| Charts:- Daily , Weekly | |
| Add ACLX to Watchlist: View: Get Complete ACLX Trend Analysis ➞ | |
 | TTEC TTEC Holdings, Inc. |
| Sector: Technology | |
| SubSector: Information Technology Services | |
| MarketCap: 1528.48 Millions | |
| Recent Price: 5.19 Smart Investing & Trading Score: 90 | |
| Day Percent Change: 3.8% Day Change: 0.19 | |
| Week Change: 0.39% Year-to-date Change: 4.0% | |
| TTEC Links: Profile News Message Board | |
| Charts:- Daily , Weekly | |
| Add TTEC to Watchlist: View: Get Complete TTEC Trend Analysis ➞ | |
 | VICR Vicor Corporation |
| Sector: Technology | |
| SubSector: Diversified Electronics | |
| MarketCap: 1526.76 Millions | |
| Recent Price: 45.64 Smart Investing & Trading Score: 66 | |
| Day Percent Change: 0.55% Day Change: 0.25 | |
| Week Change: -1.36% Year-to-date Change: -5.6% | |
| VICR Links: Profile News Message Board | |
| Charts:- Daily , Weekly | |
| Add VICR to Watchlist: View: Get Complete VICR Trend Analysis ➞ | |
 | RHP Ryman Hospitality Properties, Inc. |
| Sector: Financials | |
| SubSector: REIT - Hotel/Motel | |
| MarketCap: 1519.74 Millions | |
| Recent Price: 102.32 Smart Investing & Trading Score: 70 | |
| Day Percent Change: 0.77% Day Change: 0.78 | |
| Week Change: -0.8% Year-to-date Change: -0.7% | |
| RHP Links: Profile News Message Board | |
| Charts:- Daily , Weekly | |
| Add RHP to Watchlist: View: Get Complete RHP Trend Analysis ➞ | |
 | APLE Apple Hospitality REIT, Inc. |
| Sector: Financials | |
| SubSector: REIT - Hotel/Motel | |
| MarketCap: 1515.74 Millions | |
| Recent Price: 12.07 Smart Investing & Trading Score: 88 | |
| Day Percent Change: 1.77% Day Change: 0.21 | |
| Week Change: -0.41% Year-to-date Change: -20.0% | |
| APLE Links: Profile News Message Board | |
| Charts:- Daily , Weekly | |
| Add APLE to Watchlist: View: Get Complete APLE Trend Analysis ➞ | |
 | MNRO Monro, Inc. |
| Sector: Consumer Staples | |
| SubSector: Auto Parts | |
| MarketCap: 1514.89 Millions | |
| Recent Price: 15.92 Smart Investing & Trading Score: 68 | |
| Day Percent Change: 0.89% Day Change: 0.14 | |
| Week Change: -4.27% Year-to-date Change: -34.8% | |
| MNRO Links: Profile News Message Board | |
| Charts:- Daily , Weekly | |
| Add MNRO to Watchlist: View: Get Complete MNRO Trend Analysis ➞ | |
 | CMP Compass Minerals International, Inc. |
| Sector: Materials | |
| SubSector: Industrial Metals & Minerals | |
| MarketCap: 1512.1 Millions | |
| Recent Price: 21.84 Smart Investing & Trading Score: 58 | |
| Day Percent Change: -0.27% Day Change: -0.06 | |
| Week Change: -1.84% Year-to-date Change: 94.1% | |
| CMP Links: Profile News Message Board | |
| Charts:- Daily , Weekly | |
| Add CMP to Watchlist: View: Get Complete CMP Trend Analysis ➞ | |
 | COCO The Vita Coco Company, Inc. |
| Sector: Consumer Staples | |
| SubSector: Beverages - Non-Alcoholic | |
| MarketCap: 1510 Millions | |
| Recent Price: 37.56 Smart Investing & Trading Score: 90 | |
| Day Percent Change: -2.16% Day Change: -0.83 | |
| Week Change: 0% Year-to-date Change: 1.8% | |
| COCO Links: Profile News Message Board | |
| Charts:- Daily , Weekly | |
| Add COCO to Watchlist: View: Get Complete COCO Trend Analysis ➞ | |
 | SMR NuScale Power Corporation |
| Sector: Industrials | |
| SubSector: Specialty Industrial Machinery | |
| MarketCap: 1510 Millions | |
| Recent Price: 35.08 Smart Investing & Trading Score: 56 | |
| Day Percent Change: -4.41% Day Change: -1.62 | |
| Week Change: -2.23% Year-to-date Change: 95.7% | |
| SMR Links: Profile News Message Board | |
| Charts:- Daily , Weekly | |
| Add SMR to Watchlist: View: Get Complete SMR Trend Analysis ➞ | |
 | MATX Matson, Inc. |
| Sector: Transports | |
| SubSector: Shipping | |
| MarketCap: 1509.94 Millions | |
| Recent Price: 112.79 Smart Investing & Trading Score: 68 | |
| Day Percent Change: 2.26% Day Change: 2.49 | |
| Week Change: -0.32% Year-to-date Change: -16.1% | |
| MATX Links: Profile News Message Board | |
| Charts:- Daily , Weekly | |
| Add MATX to Watchlist: View: Get Complete MATX Trend Analysis ➞ | |
 | AMBA Ambarella, Inc. |
| Sector: Technology | |
| SubSector: Semiconductor Equipment & Materials | |
| MarketCap: 1509.38 Millions | |
| Recent Price: 66.81 Smart Investing & Trading Score: 90 | |
| Day Percent Change: 1.89% Day Change: 1.24 | |
| Week Change: -0.76% Year-to-date Change: -8.2% | |
| AMBA Links: Profile News Message Board | |
| Charts:- Daily , Weekly | |
| Add AMBA to Watchlist: View: Get Complete AMBA Trend Analysis ➞ | |
 | CTRE CareTrust REIT, Inc. |
| Sector: Financials | |
| SubSector: REIT - Healthcare Facilities | |
| MarketCap: 1507.94 Millions | |
| Recent Price: 30.95 Smart Investing & Trading Score: 78 | |
| Day Percent Change: -0.29% Day Change: -0.09 | |
| Week Change: -0.8% Year-to-date Change: 15.8% | |
| CTRE Links: Profile News Message Board | |
| Charts:- Daily , Weekly | |
| Add CTRE to Watchlist: View: Get Complete CTRE Trend Analysis ➞ | |
| For tabular summary view of above stock list: Summary View ➞ 0 - 25 , 25 - 50 , 50 - 75 , 75 - 100 , 100 - 125 , 125 - 150 , 150 - 175 , 175 - 200 , 200 - 225 , 225 - 250 , 250 - 275 , 275 - 300 , 300 - 325 , 325 - 350 , 350 - 375 , 375 - 400 , 400 - 425 , 425 - 450 , 450 - 475 , 475 - 500 , 500 - 525 , 525 - 550 , 550 - 575 , 575 - 600 , 600 - 625 , 625 - 650 , 650 - 675 , 675 - 700 , 700 - 725 , 725 - 750 , 750 - 775 , 775 - 800 , 800 - 825 , 825 - 850 , 850 - 875 , 875 - 900 , 900 - 925 , 925 - 950 , 950 - 975 , 975 - 1000 , 1000 - 1025 , 1025 - 1050 , 1050 - 1075 , 1075 - 1100 , 1100 - 1125 , 1125 - 1150 , 1150 - 1175 , 1175 - 1200 , 1200 - 1225 , 1225 - 1250 , 1250 - 1275 , 1275 - 1300 , 1300 - 1325 , 1325 - 1350 , 1350 - 1375 , 1375 - 1400 , 1400 - 1425 , 1425 - 1450 , 1450 - 1475 | ||
| Click To Change The Sort Order: By Market Cap or Company Size Performance: Year-to-date, Week and Day | |
| Select Chart Type: | ||
| Too many stocks? View smallcap stocks filtered by marketcap & sector |
| Marketcap: All SmallCap Stocks (default-no microcap), Large, Mid-Range, Small & MicroCap |
| Sector: Tech, Finance, Energy, Staples, Retail, Industrial, Materials, Utilities & Medical |
|
Best Stocks Today 12Stocks.com |
© 2025 12Stocks.com Terms & Conditions Privacy Contact Us
All Information Provided Only For Education And Not To Be Used For Investing or Trading. See Terms & Conditions


One More Thing ... Get Best Stocks Delivered Daily!
Never Ever Miss A Move With Our Top Ten Stocks Lists
Find Best Stocks In Any Market - Bull or Bear Market
Take A Peek At Our Top Ten Stocks Lists: Daily, Weekly, Year-to-Date & Top Trends
Find Best Stocks In Any Market - Bull or Bear Market
Take A Peek At Our Top Ten Stocks Lists: Daily, Weekly, Year-to-Date & Top Trends
Smallcap Stocks With Best Up Trends [0-bearish to 100-bullish]: ProKidney [100], Sana [100], B. Riley[100], Humacyte [100], Alta Equipment[100], Caribou Biosciences[100], Ovid [100], Terns [100], Progyny [100], Editas Medicine[100], LanzaTech Global[100]
Best Smallcap Stocks Year-to-Date:
System1 [522.29%], RAPT [408.23%], ThredUp [398.56%], Digital Turbine[234.32%], 908 Devices[209.55%], OptimizeRx [181.69%], PaySign [165.23%], Centrus Energy[161%], Sana [138.65%], National Vision[137.33%], X4 [126.84%] Best Smallcap Stocks This Week:
ProKidney [485.37%], Prime Medicine[31.83%], Cogint [29.02%], Ovid [27.07%], KalVista [24.79%], Inhibrx [22.11%], Verrica [21.96%], Sana [21.94%], B. Riley[19.51%], Amprius [18.16%], Enovix [18%] Best Smallcap Stocks Daily:
ProKidney [515%], Sana [25.48%], B. Riley[19.15%], Humacyte [18.98%], Alta Equipment[16.06%], Caribou Biosciences[15.11%], Ovid [14.97%], Terns [13.25%], Progyny [13.15%], PrimeEnergy Resources[12.98%], Editas Medicine[12.6%]