
 Login Sign Up


| |||||
 |  | ||||

| 12Stocks.com Market Intelligence |
Best S&P 500 Stocks
|
On this page, you will find the most comprehensive analysis of S&P 500 stocks and ETFs - from latest trends to performances to charts ➞. First, here are the year-to-date (YTD) performances of the most requested S&P 500 stocks at 12Stocks.com (click stock for review):
| Intel Corp 84% | ||
| Caterpillar Inc 38% | ||
| Goldman Sachs 37% | ||
| NVIDIA Corp 37% | ||
| Johnson & Johnson 31% | ||
| JPMorgan Chase 30% | ||
| Google Inc 30% | ||
| Boeing Co 27% | ||
| Microsoft 24% | ||
| Gilead 22% | ||
| Walmart Inc 13% | ||
| Chevron Corp 7% | ||
| Apple Inc 6% | ||
| McDonald's Corp 4% | ||
| Amazon.com Inc 1% | ||
| Starbucks Corp -5% | ||
| Merck & Co Inc -8% | ||
| Quick: S&P 500 Stocks Lists: Performances & Trends, S&P 500 Stock Charts
Sort S&P 500 stocks: Daily, Weekly, Year-to-Date, Market Cap & Trends. Filter S&P 500 stocks list by sector: Show all, Tech, Finance, Energy, Staples, Retail, Industrial, Materials, Utilities and HealthCare |
| 12Stocks.com S&P 500 Stocks Performances & Trends Daily Report | |||||||||
|
| 
The overall Smart Investing & Trading Score is 90 (0-bearish to 100-bullish) which puts S&P 500 index in short term bullish trend. The Smart Investing & Trading Score from previous trading session is 80 and an improvement of trend continues. | ||||||||
Here are the Smart Investing & Trading Scores of the most requested S&P 500 stocks at 12Stocks.com (click stock name for detailed review):
|


| 12Stocks.com: Top Performing S&P 500 Index Stocks | ||||||||||||||||||||||||||||||||||||||||||||||||
 The top performing S&P 500 Index stocks year to date are
Now, more recently, over last week, the top performing S&P 500 Index stocks on the move are


|
||||||||||||||||||||||||||||||||||||||||||||||||
| 12Stocks.com: Investing in S&P 500 Index with Stocks | |
|
The following table helps investors and traders sort through current performance and trends (as measured by Smart Investing & Trading Score) of various
stocks in the S&P 500 Index. Quick View: Move mouse or cursor over stock symbol (ticker) to view short-term technical chart and over stock name to view long term chart. Click on  to add stock symbol to your watchlist and to add stock symbol to your watchlist and  to view watchlist. Click on any ticker or stock name for detailed market intelligence report for that stock. to view watchlist. Click on any ticker or stock name for detailed market intelligence report for that stock. |
12Stocks.com Performance of Stocks in S&P 500 Index
| Ticker | Stock Name | Watchlist | Category | Recent Price | Smart Investing & Trading Score | Change % | YTD Change% |
| NEE | NextEra |   | Utilities | 78.18 | 100 | -0.62% | 10.96% |
| SO | Southern | | Utilities | 93.89 | 40 | -0.96% | 16.34% |
| CEG | Constellation | | Utilities | 357.46 | 100 | 1.87% | 47.82% |
| DUK | Duke | | Utilities | 121.57 | 10 | -0.67% | 14.83% |
| AEP | American Electric | | Utilities | 113.47 | 90 | 0.64% | 26.72% |
| SRE | Sempra | | Utilities | 89.28 | 60 | 0.02% | 4.30% |
| D | Dominion | | Utilities | 61.09 | 80 | 0.31% | 15.01% |
| EXC | Exelon Corp | | Utilities | 44.97 | 60 | -0.20% | 22.68% |
| XEL | Xcel | | Utilities | 79.59 | 60 | -0.90% | 22.04% |
| PEG | Public Service | | Utilities | 81.58 | 10 | -1.18% | -2.60% |
| ETR | Entergy Corp | | Utilities | 93.57 | 60 | 0.18% | 25.91% |
| ED | Consolidated Edison | | Utilities | 97.64 | 30 | -0.54% | 11.60% |
| WEC | WEC | | Utilities | 112.03 | 50 | -0.85% | 21.27% |
| PCG | PG&E Corp | | Utilities | 15.63 | 100 | -0.19% | -21.63% |
| AWK | American Water | | Utilities | 135.59 | 10 | -0.35% | 11.45% |
| NRG | NRG | | Utilities | 167.30 | 70 | 3.33% | 82.37% |
| DTE | DTE | | Utilities | 139.28 | 40 | -0.63% | 16.92% |
| AEE | Ameren Corp | | Utilities | 102.92 | 50 | -0.49% | 17.36% |
| ATO | Atmos | | Utilities | 168.85 | 50 | -0.31% | 23.50% |
| PPL | PPL Corp | | Utilities | 36.40 | 30 | -0.52% | 14.95% |
| FE | First Corp | | Utilities | 45.46 | 70 | -1.11% | 17.53% |
| CNP | Centerpoint | | Utilities | 38.29 | 20 | 0.31% | 23.12% |
| ES | Eversource | | Utilities | 71.79 | 90 | 0.27% | 28.29% |
| CMS | CMS | | Utilities | 71.83 | 30 | -0.75% | 10.43% |
| EIX | Edison | | Utilities | 54.49 | 40 | -3.18% | -29.00% |
| For chart view version of above stock list: Chart View ➞ 0 - 25 , 25 - 50 | ||
 | Click To Change The Sort Order: By Market Cap or Company Size Performance: Year-to-date, Week and Day |  |
|
Get the most comprehensive stock market coverage daily at 12Stocks.com ➞ Best Stocks Today ➞ Best Stocks Weekly ➞ Best Stocks Year-to-Date ➞ Best Stocks Trends ➞  Best Stocks Today 12Stocks.com Best Nasdaq Stocks ➞ Best S&P 500 Stocks ➞ Best Tech Stocks ➞ Best Biotech Stocks ➞ |
| Detailed Overview of S&P 500 Stocks |
| S&P 500 Technical Overview, Leaders & Laggards, Top S&P 500 ETF Funds & Detailed S&P 500 Stocks List, Charts, Trends & More |
| S&P 500: Technical Analysis, Trends & YTD Performance | |
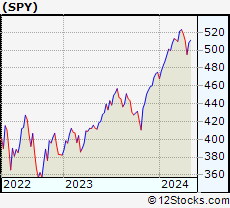
| S&P 500 index as represented by
SPY, an exchange-traded fund [ETF], holds basket of five hundred (mostly largecap) stocks from across all major sectors of the US stock market. The S&P 500 index (contains stocks like Apple and Exxon) is up by 15.1527% and is currently outperforming the overall market by 0.3948% year-to-date. Below is a quick view of technical charts and trends: | |
 SPY Weekly Chart |
|
| Long Term Trend: Very Good | |
| Medium Term Trend: Good | |
 SPY Daily Chart |
|
| Short Term Trend: Very Good | |
| Overall Trend Score: 90 | |
| YTD Performance: 15.1527% | |
| **Trend Scores & Views Are Only For Educational Purposes And Not For Investing | |
| 12Stocks.com: Investing in S&P 500 Index using Exchange Traded Funds | |
|
The following table shows list of key exchange traded funds (ETF) that
help investors track S&P 500 index. The following list also includes leveraged ETF funds that track twice or thrice the daily returns of S&P 500 indices. Short or inverse ETF funds move in the opposite direction to the index they track and are useful during market pullbacks or during bear markets. Quick View: Move mouse or cursor over ETF symbol (ticker) to view short-term technical chart and over ETF name to view long term chart. Click on ticker or stock name for detailed view. Click on to add stock symbol to your watchlist and to view watchlist. |
12Stocks.com List of ETFs that track S&P 500 Index
| Ticker | ETF Name | Watchlist | Recent Price | Smart Investing & Trading Score | Change % | Week % | Year-to-date % |
| SPY | SPDR S&P 500 ETF Trust | | 669.22 | 90 | 0.115192 | 1.22826 | 15.1527% |
| IVV | iShares Core S&P 500 ETF | | 672.50 | 90 | 0.0982377 | 1.24048 | 15.1922% |
| VOO | Vanguard S&P 500 ETF | | 615.25 | 90 | 0.107389 | 0.943396 | 15.2251% |
| OEF | iShares S&P 100 ETF | | 334.28 | 90 | 0.00598337 | 1.05505 | 16.5396% |
| SSO | ProShares Ultra S&P500 2x Shares | | 113.12 | 90 | 0.177117 | 2.334 | 23.4297% |
| UPRO | ProShares UltraPro S&P 500 ETF 3x Shares | | 113.01 | 90 | 0.275067 | 3.45112 | 29.2069% |
| SPXL | Direxion Daily S&P 500 Bull 3X Shares | | 214.76 | 90 | 0.28953 | 3.47386 | 29.2396% |
| SH | ProShares Short S&P500 -1x Shares | | 36.80 | 10 | -0.0543183 | -1.07527 | -11.8852% |
| SDS | ProShares UltraShort S&P500 -2x Shares | | 14.33 | 10 | -0.139373 | -2.1843 | -25.9516% |
| SPXU | ProShares UltraPro Short S&P 500 | | 13.34 | 10 | -0.224383 | -3.26323 | -40.0301% |
| SPXS | Direxion Daily S&P 500 Bear -3X Shares | | 37.50 | 70 | -0.239425 | 868.992 | 503.962% |
| 12Stocks.com: Charts, Trends, Fundamental Data and Performances of S&P 500 Stocks | |
|
We now take in-depth look at all S&P 500 stocks including charts, multi-period performances and overall trends (as measured by Smart Investing & Trading Score). One can sort S&P 500 stocks (click link to choose) by Daily, Weekly and by Year-to-Date performances. Also, one can sort by size of the company or by market capitalization. |
| Select Your Default Chart Type: | |||||
| |||||
| Click on stock symbol or name for detailed view. Click on to add stock symbol to your watchlist and to view watchlist. Quick View: Move mouse or cursor over "Daily" to quickly view daily technical stock chart and over "Weekly" to view weekly technical stock chart. | |||||

 | NEE NextEra Energy Inc |
| Sector: Utilities | |
| SubSector: Utilities - Regulated Electric | |
| MarketCap: 147620 Millions | |
| Recent Price: 78.18 Smart Investing & Trading Score: 100 | |
| Day Percent Change: -0.622855% Day Change: -0.92 | |
| Week Change: 5.89191% Year-to-date Change: 11.0% | |
| NEE Links: Profile News Message Board | |
| Charts:- Daily , Weekly | |
| Add NEE to Watchlist: View: Get NEE Trend Analysis ➞ | |
 | SO Southern Company |
| Sector: Utilities | |
| SubSector: Utilities - Regulated Electric | |
| MarketCap: 100962 Millions | |
| Recent Price: 93.89 Smart Investing & Trading Score: 40 | |
| Day Percent Change: -0.959916% Day Change: -1.05 | |
| Week Change: -0.550789% Year-to-date Change: 16.3% | |
| SO Links: Profile News Message Board | |
| Charts:- Daily , Weekly | |
| Add SO to Watchlist: View: Get SO Trend Analysis ➞ | |
 | CEG Constellation Energy Corporation |
| Sector: Utilities | |
| SubSector: Utilities - Renewable | |
| MarketCap: 94215.3 Millions | |
| Recent Price: 357.46 Smart Investing & Trading Score: 100 | |
| Day Percent Change: 1.86948% Day Change: 1.61 | |
| Week Change: 5.40501% Year-to-date Change: 47.8% | |
| CEG Links: Profile News Message Board | |
| Charts:- Daily , Weekly | |
| Add CEG to Watchlist: View: Get CEG Trend Analysis ➞ | |
 | DUK Duke Energy Corp |
| Sector: Utilities | |
| SubSector: Utilities - Regulated Electric | |
| MarketCap: 93789.3 Millions | |
| Recent Price: 121.57 Smart Investing & Trading Score: 10 | |
| Day Percent Change: -0.669989% Day Change: -1.07 | |
| Week Change: -1.67422% Year-to-date Change: 14.8% | |
| DUK Links: Profile News Message Board | |
| Charts:- Daily , Weekly | |
| Add DUK to Watchlist: View: Get DUK Trend Analysis ➞ | |
 | AEP American Electric Power Company Inc |
| Sector: Utilities | |
| SubSector: Utilities - Regulated Electric | |
| MarketCap: 57816.7 Millions | |
| Recent Price: 113.47 Smart Investing & Trading Score: 90 | |
| Day Percent Change: 0.638581% Day Change: 1.01 | |
| Week Change: 4.21565% Year-to-date Change: 26.7% | |
| AEP Links: Profile News Message Board | |
| Charts:- Daily , Weekly | |
| Add AEP to Watchlist: View: Get AEP Trend Analysis ➞ | |
 | SRE Sempra |
| Sector: Utilities | |
| SubSector: Utilities - Diversified | |
| MarketCap: 52922 Millions | |
| Recent Price: 89.28 Smart Investing & Trading Score: 60 | |
| Day Percent Change: 0.0224065% Day Change: -0.14 | |
| Week Change: 2.29148% Year-to-date Change: 4.3% | |
| SRE Links: Profile News Message Board | |
| Charts:- Daily , Weekly | |
| Add SRE to Watchlist: View: Get SRE Trend Analysis ➞ | |
 | D Dominion Energy Inc |
| Sector: Utilities | |
| SubSector: Utilities - Regulated Electric | |
| MarketCap: 49661.3 Millions | |
| Recent Price: 61.09 Smart Investing & Trading Score: 80 | |
| Day Percent Change: 0.311987% Day Change: 0.13 | |
| Week Change: 0.114716% Year-to-date Change: 15.0% | |
| D Links: Profile News Message Board | |
| Charts:- Daily , Weekly | |
| Add D to Watchlist: View: Get D Trend Analysis ➞ | |
 | EXC Exelon Corp |
| Sector: Utilities | |
| SubSector: Utilities - Regulated Electric | |
| MarketCap: 43863.8 Millions | |
| Recent Price: 44.97 Smart Investing & Trading Score: 60 | |
| Day Percent Change: -0.199734% Day Change: -0.28 | |
| Week Change: 1.67307% Year-to-date Change: 22.7% | |
| EXC Links: Profile News Message Board | |
| Charts:- Daily , Weekly | |
| Add EXC to Watchlist: View: Get EXC Trend Analysis ➞ | |
 | XEL Xcel Energy, Inc |
| Sector: Utilities | |
| SubSector: Utilities - Regulated Electric | |
| MarketCap: 42984.9 Millions | |
| Recent Price: 79.59 Smart Investing & Trading Score: 60 | |
| Day Percent Change: -0.896526% Day Change: -0.67 | |
| Week Change: 2.13012% Year-to-date Change: 22.0% | |
| XEL Links: Profile News Message Board | |
| Charts:- Daily , Weekly | |
| Add XEL to Watchlist: View: Get XEL Trend Analysis ➞ | |
 | PEG Public Service Enterprise Group Inc |
| Sector: Utilities | |
| SubSector: Utilities - Regulated Electric | |
| MarketCap: 40485.4 Millions | |
| Recent Price: 81.58 Smart Investing & Trading Score: 10 | |
| Day Percent Change: -1.17505% Day Change: -1.07 | |
| Week Change: -0.995146% Year-to-date Change: -2.6% | |
| PEG Links: Profile News Message Board | |
| Charts:- Daily , Weekly | |
| Add PEG to Watchlist: View: Get PEG Trend Analysis ➞ | |
 | ETR Entergy Corp |
| Sector: Utilities | |
| SubSector: Utilities - Regulated Electric | |
| MarketCap: 39172.4 Millions | |
| Recent Price: 93.57 Smart Investing & Trading Score: 60 | |
| Day Percent Change: 0.182013% Day Change: 0.08 | |
| Week Change: 2.16181% Year-to-date Change: 25.9% | |
| ETR Links: Profile News Message Board | |
| Charts:- Daily , Weekly | |
| Add ETR to Watchlist: View: Get ETR Trend Analysis ➞ | |
 | ED Consolidated Edison, Inc |
| Sector: Utilities | |
| SubSector: Utilities - Regulated Electric | |
| MarketCap: 35361.9 Millions | |
| Recent Price: 97.64 Smart Investing & Trading Score: 30 | |
| Day Percent Change: -0.53988% Day Change: -0.56 | |
| Week Change: -1.18409% Year-to-date Change: 11.6% | |
| ED Links: Profile News Message Board | |
| Charts:- Daily , Weekly | |
| Add ED to Watchlist: View: Get ED Trend Analysis ➞ | |
 | WEC WEC Energy Group Inc |
| Sector: Utilities | |
| SubSector: Utilities - Regulated Electric | |
| MarketCap: 34694 Millions | |
| Recent Price: 112.03 Smart Investing & Trading Score: 50 | |
| Day Percent Change: -0.849633% Day Change: -1.17 | |
| Week Change: 0.00892698% Year-to-date Change: 21.3% | |
| WEC Links: Profile News Message Board | |
| Charts:- Daily , Weekly | |
| Add WEC to Watchlist: View: Get WEC Trend Analysis ➞ | |
 | PCG PG&E Corp |
| Sector: Utilities | |
| SubSector: Utilities - Regulated Electric | |
| MarketCap: 33165.4 Millions | |
| Recent Price: 15.63 Smart Investing & Trading Score: 100 | |
| Day Percent Change: -0.191571% Day Change: -0.12 | |
| Week Change: 6.61664% Year-to-date Change: -21.6% | |
| PCG Links: Profile News Message Board | |
| Charts:- Daily , Weekly | |
| Add PCG to Watchlist: View: Get PCG Trend Analysis ➞ | |
 | AWK American Water Works Co. Inc |
| Sector: Utilities | |
| SubSector: Utilities - Regulated Water | |
| MarketCap: 29027.4 Millions | |
| Recent Price: 135.59 Smart Investing & Trading Score: 10 | |
| Day Percent Change: -0.35276% Day Change: -0.37 | |
| Week Change: -0.601129% Year-to-date Change: 11.4% | |
| AWK Links: Profile News Message Board | |
| Charts:- Daily , Weekly | |
| Add AWK to Watchlist: View: Get AWK Trend Analysis ➞ | |
 | NRG NRG Energy Inc |
| Sector: Utilities | |
| SubSector: Utilities - Independent Power Producers | |
| MarketCap: 28562 Millions | |
| Recent Price: 167.30 Smart Investing & Trading Score: 70 | |
| Day Percent Change: 3.32901% Day Change: 5.6 | |
| Week Change: 1.03877% Year-to-date Change: 82.4% | |
| NRG Links: Profile News Message Board | |
| Charts:- Daily , Weekly | |
| Add NRG to Watchlist: View: Get NRG Trend Analysis ➞ | |
 | DTE DTE Energy Co |
| Sector: Utilities | |
| SubSector: Utilities - Regulated Electric | |
| MarketCap: 28356.5 Millions | |
| Recent Price: 139.28 Smart Investing & Trading Score: 40 | |
| Day Percent Change: -0.627854% Day Change: -1.02 | |
| Week Change: 0.374748% Year-to-date Change: 16.9% | |
| DTE Links: Profile News Message Board | |
| Charts:- Daily , Weekly | |
| Add DTE to Watchlist: View: Get DTE Trend Analysis ➞ | |
 | AEE Ameren Corp |
| Sector: Utilities | |
| SubSector: Utilities - Regulated Electric | |
| MarketCap: 27211.3 Millions | |
| Recent Price: 102.92 Smart Investing & Trading Score: 50 | |
| Day Percent Change: -0.493087% Day Change: -0.49 | |
| Week Change: 2.05255% Year-to-date Change: 17.4% | |
| AEE Links: Profile News Message Board | |
| Charts:- Daily , Weekly | |
| Add AEE to Watchlist: View: Get AEE Trend Analysis ➞ | |
 | ATO Atmos Energy Corp |
| Sector: Utilities | |
| SubSector: Utilities - Regulated Gas | |
| MarketCap: 26724 Millions | |
| Recent Price: 168.85 Smart Investing & Trading Score: 50 | |
| Day Percent Change: -0.312906% Day Change: -0.92 | |
| Week Change: 1.24723% Year-to-date Change: 23.5% | |
| ATO Links: Profile News Message Board | |
| Charts:- Daily , Weekly | |
| Add ATO to Watchlist: View: Get ATO Trend Analysis ➞ | |
 | PPL PPL Corp |
| Sector: Utilities | |
| SubSector: Utilities - Regulated Electric | |
| MarketCap: 26593 Millions | |
| Recent Price: 36.40 Smart Investing & Trading Score: 30 | |
| Day Percent Change: -0.519268% Day Change: -0.21 | |
| Week Change: -0.273973% Year-to-date Change: 15.0% | |
| PPL Links: Profile News Message Board | |
| Charts:- Daily , Weekly | |
| Add PPL to Watchlist: View: Get PPL Trend Analysis ➞ | |
 | FE Firstenergy Corp |
| Sector: Utilities | |
| SubSector: Utilities - Regulated Electric | |
| MarketCap: 25105.5 Millions | |
| Recent Price: 45.46 Smart Investing & Trading Score: 70 | |
| Day Percent Change: -1.10942% Day Change: -0.26 | |
| Week Change: 3.13067% Year-to-date Change: 17.5% | |
| FE Links: Profile News Message Board | |
| Charts:- Daily , Weekly | |
| Add FE to Watchlist: View: Get FE Trend Analysis ➞ | |
 | CNP Centerpoint Energy Inc |
| Sector: Utilities | |
| SubSector: Utilities - Regulated Electric | |
| MarketCap: 24665.2 Millions | |
| Recent Price: 38.29 Smart Investing & Trading Score: 20 | |
| Day Percent Change: 0.314383% Day Change: 0.01 | |
| Week Change: -1.84568% Year-to-date Change: 23.1% | |
| CNP Links: Profile News Message Board | |
| Charts:- Daily , Weekly | |
| Add CNP to Watchlist: View: Get CNP Trend Analysis ➞ | |
 | ES Eversource Energy |
| Sector: Utilities | |
| SubSector: Utilities - Regulated Electric | |
| MarketCap: 23576.9 Millions | |
| Recent Price: 71.79 Smart Investing & Trading Score: 90 | |
| Day Percent Change: 0.265363% Day Change: 0.21 | |
| Week Change: 3.89291% Year-to-date Change: 28.3% | |
| ES Links: Profile News Message Board | |
| Charts:- Daily , Weekly | |
| Add ES to Watchlist: View: Get ES Trend Analysis ➞ | |
 | CMS CMS Energy Corporation |
| Sector: Utilities | |
| SubSector: Utilities - Regulated Electric | |
| MarketCap: 21417.4 Millions | |
| Recent Price: 71.83 Smart Investing & Trading Score: 30 | |
| Day Percent Change: -0.746166% Day Change: -0.91 | |
| Week Change: 0.237231% Year-to-date Change: 10.4% | |
| CMS Links: Profile News Message Board | |
| Charts:- Daily , Weekly | |
| Add CMS to Watchlist: View: Get CMS Trend Analysis ➞ | |
 | EIX Edison International |
| Sector: Utilities | |
| SubSector: Utilities - Regulated Electric | |
| MarketCap: 20954.2 Millions | |
| Recent Price: 54.49 Smart Investing & Trading Score: 40 | |
| Day Percent Change: -3.18053% Day Change: -1.85 | |
| Week Change: -0.999273% Year-to-date Change: -29.0% | |
| EIX Links: Profile News Message Board | |
| Charts:- Daily , Weekly | |
| Add EIX to Watchlist: View: Get EIX Trend Analysis ➞ | |
| For tabular summary view of above stock list: Summary View ➞ 0 - 25 , 25 - 50 | ||
| Click To Change The Sort Order: By Market Cap or Company Size Performance: Year-to-date, Week and Day | |
| Select Chart Type: | ||
|
Best Stocks Today 12Stocks.com |
© 2025 12Stocks.com Terms & Conditions Privacy Contact Us
All Information Provided Only For Education And Not To Be Used For Investing or Trading. See Terms & Conditions


One More Thing ... Get Best Stocks Delivered Daily!
Never Ever Miss A Move With Our Top Ten Stocks Lists
Find Best Stocks In Any Market - Bull or Bear Market
Take A Peek At Our Top Ten Stocks Lists: Daily, Weekly, Year-to-Date & Top Trends
Find Best Stocks In Any Market - Bull or Bear Market
Take A Peek At Our Top Ten Stocks Lists: Daily, Weekly, Year-to-Date & Top Trends
S&P 500 Stocks With Best Up Trends [0-bearish to 100-bullish]: Fair Isaac[100], Intel Corp[100], Bio-Techne Corp[100], DuPont de[100], First Solar[100], Centene Corp[100], Lam Research[100], Charles River[100], Applied Materials[100], Steel Dynamics[100], Teradyne Inc[100]
Best S&P 500 Stocks Year-to-Date:
Seagate [198.865%], Western Digital[181.204%], Newmont Corp[127.671%], Micron [110.87%], Lam Research[103.976%], Intel Corp[84.4708%], Warner Bros.[84.2%], NRG [82.3658%], CVS Health[81.156%], Amphenol Corp[79.8571%], KLA Corp[79.7904%] Best S&P 500 Stocks This Week:
Pioneer Natural[108.1%], Bio-Techne Corp[21.2222%], Electronic Arts[20.1076%], Western Digital[19.6645%], Intel Corp[19.4747%], Charles River[17.3369%], Fair Isaac[15.6495%], Lamb Weston[15.5663%], Lam Research[14.5184%], Seagate [13.8757%], Micron [13.6232%] Best S&P 500 Stocks Daily:
Fair Isaac[17.979%], Celanese Corp[6.98937%], Humana Inc[3.99157%], CF Industries[3.94539%], Eastman Chemical[3.88961%], Intel Corp[3.78408%], Albemarle Corp[3.7173%], Caesars Entertainment[3.66089%], Bio-Techne Corp[3.6215%], DuPont de[3.54129%], Advanced Micro[3.48759%]