
 Login Sign Up


| |||||
 |  | ||||

| 12Stocks.com Market Intelligence |
Best S&P 500 Stocks
|
On this page, you will find the most comprehensive analysis of S&P 500 stocks and ETFs - from latest trends to performances to charts ➞. First, here are the year-to-date (YTD) performances of the most requested S&P 500 stocks at 12Stocks.com (click stock for review):
| Intel Corp 84% | ||
| Caterpillar Inc 38% | ||
| Goldman Sachs 37% | ||
| NVIDIA Corp 37% | ||
| Johnson & Johnson 31% | ||
| JPMorgan Chase 30% | ||
| Google Inc 30% | ||
| Boeing Co 27% | ||
| Microsoft 24% | ||
| Gilead 22% | ||
| Walmart Inc 13% | ||
| Chevron Corp 7% | ||
| Apple Inc 6% | ||
| McDonald's Corp 4% | ||
| Amazon.com Inc 1% | ||
| Starbucks Corp -5% | ||
| Merck & Co Inc -8% | ||
| Quick: S&P 500 Stocks Lists: Performances & Trends, S&P 500 Stock Charts
Sort S&P 500 stocks: Daily, Weekly, Year-to-Date, Market Cap & Trends. Filter S&P 500 stocks list by sector: Show all, Tech, Finance, Energy, Staples, Retail, Industrial, Materials, Utilities and HealthCare |
| 12Stocks.com S&P 500 Stocks Performances & Trends Daily Report | |||||||||
|
| 
The overall Smart Investing & Trading Score is 90 (0-bearish to 100-bullish) which puts S&P 500 index in short term bullish trend. The Smart Investing & Trading Score from previous trading session is 80 and an improvement of trend continues. | ||||||||
Here are the Smart Investing & Trading Scores of the most requested S&P 500 stocks at 12Stocks.com (click stock name for detailed review):
|


| 12Stocks.com: Top Performing S&P 500 Index Stocks | ||||||||||||||||||||||||||||||||||||||||||||||||
 The top performing S&P 500 Index stocks year to date are
Now, more recently, over last week, the top performing S&P 500 Index stocks on the move are


|
||||||||||||||||||||||||||||||||||||||||||||||||
| 12Stocks.com: Investing in S&P 500 Index with Stocks | |
|
The following table helps investors and traders sort through current performance and trends (as measured by Smart Investing & Trading Score) of various
stocks in the S&P 500 Index. Quick View: Move mouse or cursor over stock symbol (ticker) to view short-term technical chart and over stock name to view long term chart. Click on  to add stock symbol to your watchlist and to add stock symbol to your watchlist and  to view watchlist. Click on any ticker or stock name for detailed market intelligence report for that stock. to view watchlist. Click on any ticker or stock name for detailed market intelligence report for that stock. |
12Stocks.com Performance of Stocks in S&P 500 Index
| Ticker | Stock Name | Watchlist | Category | Recent Price | Smart Investing & Trading Score | Change % | YTD Change% |
| WMT | Walmart Inc |   | Consumer Staples | 101.57 | 20 | -0.38% | 13.44% |
| COST | Costco Wholesale | | Consumer Staples | 916.77 | 30 | -0.06% | 1.15% |
| PG | Procter & Gamble Co | | Consumer Staples | 152.05 | 20 | -0.74% | -6.61% |
| KO | Coca-Cola Co | | Consumer Staples | 66.10 | 20 | -1.02% | 8.44% |
| PM | Philip Morris | | Consumer Staples | 157.91 | 0 | -1.83% | 32.54% |
| PEP | PepsiCo Inc | | Consumer Staples | 142.31 | 70 | -0.58% | -3.37% |
| MO | Altria | | Consumer Staples | 65.75 | 40 | -0.81% | 29.68% |
| MDLZ | Mondelez | | Consumer Staples | 61.78 | 0 | -2.20% | 5.29% |
| CL | Colgate-Palmolive Co | | Consumer Staples | 78.31 | 0 | -0.89% | -12.02% |
| MNST | Monster Beverage | | Consumer Staples | 67.58 | 100 | 0.22% | 29.19% |
| KR | Kroger Co | | Consumer Staples | 66.36 | 30 | -0.23% | 8.18% |
| KMB | Kimberly-Clark Corp | | Consumer Staples | 122.62 | 10 | -0.50% | -4.40% |
| TGT | Target Corp | | Consumer Staples | 89.51 | 70 | 0.42% | -33.45% |
| SYY | Sysco Corp | | Consumer Staples | 83.27 | 90 | 0.54% | 12.27% |
| KDP | Keurig Dr | | Consumer Staples | 25.74 | 20 | 0.55% | -17.24% |
| HSY | Hershey | | Consumer Staples | 189.02 | 80 | 0.10% | 13.90% |
| KVUE | Kenvue Inc | | Consumer Staples | 15.73 | 20 | -0.32% | -24.40% |
| KHC | Kraft Heinz | | Consumer Staples | 26.07 | 50 | -0.80% | -12.89% |
| EL | Estee Lauder | | Consumer Staples | 88.77 | 60 | 2.98% | 21.19% |
| ADM | Archer Daniels | | Consumer Staples | 59.11 | 30 | -0.24% | 20.24% |
| K | Kellanova | | Consumer Staples | 82.65 | 90 | 0.23% | 3.38% |
| GIS | General Mills | | Consumer Staples | 50.32 | 90 | -0.75% | -18.17% |
| STZ | Constellation Brands | | Consumer Staples | 140.51 | 80 | 1.12% | -35.77% |
| DG | Dollar General | | Consumer Staples | 101.40 | 10 | 1.73% | 36.69% |
| CHD | Church & Dwight Co. Inc | | Consumer Staples | 88.40 | 40 | 0.55% | -14.36% |
| For chart view version of above stock list: Chart View ➞ 0 - 25 , 25 - 50 | ||
 | Click To Change The Sort Order: By Market Cap or Company Size Performance: Year-to-date, Week and Day |  |
|
Get the most comprehensive stock market coverage daily at 12Stocks.com ➞ Best Stocks Today ➞ Best Stocks Weekly ➞ Best Stocks Year-to-Date ➞ Best Stocks Trends ➞  Best Stocks Today 12Stocks.com Best Nasdaq Stocks ➞ Best S&P 500 Stocks ➞ Best Tech Stocks ➞ Best Biotech Stocks ➞ |
| Detailed Overview of S&P 500 Stocks |
| S&P 500 Technical Overview, Leaders & Laggards, Top S&P 500 ETF Funds & Detailed S&P 500 Stocks List, Charts, Trends & More |
| S&P 500: Technical Analysis, Trends & YTD Performance | |
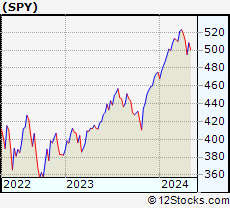
| S&P 500 index as represented by
SPY, an exchange-traded fund [ETF], holds basket of five hundred (mostly largecap) stocks from across all major sectors of the US stock market. The S&P 500 index (contains stocks like Apple and Exxon) is up by 15.1527% and is currently outperforming the overall market by 0.3948% year-to-date. Below is a quick view of technical charts and trends: | |
 SPY Weekly Chart |
|
| Long Term Trend: Very Good | |
| Medium Term Trend: Good | |
 SPY Daily Chart |
|
| Short Term Trend: Very Good | |
| Overall Trend Score: 90 | |
| YTD Performance: 15.1527% | |
| **Trend Scores & Views Are Only For Educational Purposes And Not For Investing | |
| 12Stocks.com: Investing in S&P 500 Index using Exchange Traded Funds | |
|
The following table shows list of key exchange traded funds (ETF) that
help investors track S&P 500 index. The following list also includes leveraged ETF funds that track twice or thrice the daily returns of S&P 500 indices. Short or inverse ETF funds move in the opposite direction to the index they track and are useful during market pullbacks or during bear markets. Quick View: Move mouse or cursor over ETF symbol (ticker) to view short-term technical chart and over ETF name to view long term chart. Click on ticker or stock name for detailed view. Click on to add stock symbol to your watchlist and to view watchlist. |
12Stocks.com List of ETFs that track S&P 500 Index
| Ticker | ETF Name | Watchlist | Recent Price | Smart Investing & Trading Score | Change % | Week % | Year-to-date % |
| SPY | SPDR S&P 500 ETF Trust | | 669.22 | 90 | 0.115192 | 1.22826 | 15.1527% |
| IVV | iShares Core S&P 500 ETF | | 672.50 | 90 | 0.0982377 | 1.24048 | 15.1922% |
| VOO | Vanguard S&P 500 ETF | | 615.25 | 90 | 0.107389 | 0.943396 | 15.2251% |
| OEF | iShares S&P 100 ETF | | 334.28 | 90 | 0.00598337 | 1.05505 | 16.5396% |
| SSO | ProShares Ultra S&P500 2x Shares | | 113.12 | 90 | 0.177117 | 2.334 | 23.4297% |
| UPRO | ProShares UltraPro S&P 500 ETF 3x Shares | | 113.01 | 90 | 0.275067 | 3.45112 | 29.2069% |
| SPXL | Direxion Daily S&P 500 Bull 3X Shares | | 214.76 | 90 | 0.28953 | 3.47386 | 29.2396% |
| SH | ProShares Short S&P500 -1x Shares | | 36.80 | 10 | -0.0543183 | -1.07527 | -11.8852% |
| SDS | ProShares UltraShort S&P500 -2x Shares | | 14.33 | 10 | -0.139373 | -2.1843 | -25.9516% |
| SPXU | ProShares UltraPro Short S&P 500 | | 13.34 | 10 | -0.224383 | -3.26323 | -40.0301% |
| SPXS | Direxion Daily S&P 500 Bear -3X Shares | | 37.50 | 70 | -0.239425 | 868.992 | 503.962% |
| 12Stocks.com: Charts, Trends, Fundamental Data and Performances of S&P 500 Stocks | |
|
We now take in-depth look at all S&P 500 stocks including charts, multi-period performances and overall trends (as measured by Smart Investing & Trading Score). One can sort S&P 500 stocks (click link to choose) by Daily, Weekly and by Year-to-Date performances. Also, one can sort by size of the company or by market capitalization. |
| Select Your Default Chart Type: | |||||
| |||||
| Click on stock symbol or name for detailed view. Click on to add stock symbol to your watchlist and to view watchlist. Quick View: Move mouse or cursor over "Daily" to quickly view daily technical stock chart and over "Weekly" to view weekly technical stock chart. | |||||

 | WMT Walmart Inc |
| Sector: Consumer Staples | |
| SubSector: Discount Stores | |
| MarketCap: 801351 Millions | |
| Recent Price: 101.57 Smart Investing & Trading Score: 20 | |
| Day Percent Change: -0.382503% Day Change: 0.05 | |
| Week Change: -1.12917% Year-to-date Change: 13.4% | |
| WMT Links: Profile News Message Board | |
| Charts:- Daily , Weekly | |
| Add WMT to Watchlist: View: Get WMT Trend Analysis ➞ | |
 | COST Costco Wholesale Corp |
| Sector: Consumer Staples | |
| SubSector: Discount Stores | |
| MarketCap: 427281 Millions | |
| Recent Price: 916.77 Smart Investing & Trading Score: 30 | |
| Day Percent Change: -0.0621362% Day Change: 0.44 | |
| Week Change: -3.01501% Year-to-date Change: 1.1% | |
| COST Links: Profile News Message Board | |
| Charts:- Daily , Weekly | |
| Add COST to Watchlist: View: Get COST Trend Analysis ➞ | |
 | PG Procter & Gamble Co |
| Sector: Consumer Staples | |
| SubSector: Household & Personal Products | |
| MarketCap: 374826 Millions | |
| Recent Price: 152.05 Smart Investing & Trading Score: 20 | |
| Day Percent Change: -0.737694% Day Change: -1.13 | |
| Week Change: -0.24275% Year-to-date Change: -6.6% | |
| PG Links: Profile News Message Board | |
| Charts:- Daily , Weekly | |
| Add PG to Watchlist: View: Get PG Trend Analysis ➞ | |
 | KO Coca-Cola Co |
| Sector: Consumer Staples | |
| SubSector: Beverages - Non-Alcoholic | |
| MarketCap: 292477 Millions | |
| Recent Price: 66.10 Smart Investing & Trading Score: 20 | |
| Day Percent Change: -1.01827% Day Change: -0.76 | |
| Week Change: -0.526712% Year-to-date Change: 8.4% | |
| KO Links: Profile News Message Board | |
| Charts:- Daily , Weekly | |
| Add KO to Watchlist: View: Get KO Trend Analysis ➞ | |
 | PM Philip Morris International Inc |
| Sector: Consumer Staples | |
| SubSector: Tobacco | |
| MarketCap: 251467 Millions | |
| Recent Price: 157.91 Smart Investing & Trading Score: 0 | |
| Day Percent Change: -1.83389% Day Change: -1.89 | |
| Week Change: -3.1227% Year-to-date Change: 32.5% | |
| PM Links: Profile News Message Board | |
| Charts:- Daily , Weekly | |
| Add PM to Watchlist: View: Get PM Trend Analysis ➞ | |
 | PEP PepsiCo Inc |
| Sector: Consumer Staples | |
| SubSector: Beverages - Non-Alcoholic | |
| MarketCap: 200419 Millions | |
| Recent Price: 142.31 Smart Investing & Trading Score: 70 | |
| Day Percent Change: -0.579852% Day Change: -1.2 | |
| Week Change: 0.0984737% Year-to-date Change: -3.4% | |
| PEP Links: Profile News Message Board | |
| Charts:- Daily , Weekly | |
| Add PEP to Watchlist: View: Get PEP Trend Analysis ➞ | |
 | MO Altria Group Inc |
| Sector: Consumer Staples | |
| SubSector: Tobacco | |
| MarketCap: 111797 Millions | |
| Recent Price: 65.75 Smart Investing & Trading Score: 40 | |
| Day Percent Change: -0.814602% Day Change: -0.3 | |
| Week Change: 0.951942% Year-to-date Change: 29.7% | |
| MO Links: Profile News Message Board | |
| Charts:- Daily , Weekly | |
| Add MO to Watchlist: View: Get MO Trend Analysis ➞ | |
 | MDLZ Mondelez International Inc |
| Sector: Consumer Staples | |
| SubSector: Confectioners | |
| MarketCap: 79888.2 Millions | |
| Recent Price: 61.78 Smart Investing & Trading Score: 0 | |
| Day Percent Change: -2.20041% Day Change: -1.1 | |
| Week Change: -4.05342% Year-to-date Change: 5.3% | |
| MDLZ Links: Profile News Message Board | |
| Charts:- Daily , Weekly | |
| Add MDLZ to Watchlist: View: Get MDLZ Trend Analysis ➞ | |
 | CL Colgate-Palmolive Co |
| Sector: Consumer Staples | |
| SubSector: Household & Personal Products | |
| MarketCap: 68803.8 Millions | |
| Recent Price: 78.31 Smart Investing & Trading Score: 0 | |
| Day Percent Change: -0.885964% Day Change: -0.47 | |
| Week Change: -3.4759% Year-to-date Change: -12.0% | |
| CL Links: Profile News Message Board | |
| Charts:- Daily , Weekly | |
| Add CL to Watchlist: View: Get CL Trend Analysis ➞ | |
 | MNST Monster Beverage Corp |
| Sector: Consumer Staples | |
| SubSector: Beverages - Non-Alcoholic | |
| MarketCap: 60987.7 Millions | |
| Recent Price: 67.58 Smart Investing & Trading Score: 100 | |
| Day Percent Change: 0.222453% Day Change: 0.25 | |
| Week Change: 4.08132% Year-to-date Change: 29.2% | |
| MNST Links: Profile News Message Board | |
| Charts:- Daily , Weekly | |
| Add MNST to Watchlist: View: Get MNST Trend Analysis ➞ | |
 | KR Kroger Co |
| Sector: Consumer Staples | |
| SubSector: Grocery Stores | |
| MarketCap: 44793.3 Millions | |
| Recent Price: 66.36 Smart Investing & Trading Score: 30 | |
| Day Percent Change: -0.22553% Day Change: 0.05 | |
| Week Change: 1.2357% Year-to-date Change: 8.2% | |
| KR Links: Profile News Message Board | |
| Charts:- Daily , Weekly | |
| Add KR to Watchlist: View: Get KR Trend Analysis ➞ | |
 | KMB Kimberly-Clark Corp |
| Sector: Consumer Staples | |
| SubSector: Household & Personal Products | |
| MarketCap: 43094.9 Millions | |
| Recent Price: 122.62 Smart Investing & Trading Score: 10 | |
| Day Percent Change: -0.495009% Day Change: -0.62 | |
| Week Change: -1.05705% Year-to-date Change: -4.4% | |
| KMB Links: Profile News Message Board | |
| Charts:- Daily , Weekly | |
| Add KMB to Watchlist: View: Get KMB Trend Analysis ➞ | |
 | TGT Target Corp |
| Sector: Consumer Staples | |
| SubSector: Discount Stores | |
| MarketCap: 42336.4 Millions | |
| Recent Price: 89.51 Smart Investing & Trading Score: 70 | |
| Day Percent Change: 0.415077% Day Change: 0.57 | |
| Week Change: 1.35885% Year-to-date Change: -33.4% | |
| TGT Links: Profile News Message Board | |
| Charts:- Daily , Weekly | |
| Add TGT to Watchlist: View: Get TGT Trend Analysis ➞ | |
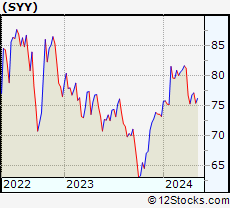 | SYY Sysco Corp |
| Sector: Consumer Staples | |
| SubSector: Food Distribution | |
| MarketCap: 39428.6 Millions | |
| Recent Price: 83.27 Smart Investing & Trading Score: 90 | |
| Day Percent Change: 0.543347% Day Change: 0.41 | |
| Week Change: 1.77218% Year-to-date Change: 12.3% | |
| SYY Links: Profile News Message Board | |
| Charts:- Daily , Weekly | |
| Add SYY to Watchlist: View: Get SYY Trend Analysis ➞ | |
 | KDP Keurig Dr Pepper Inc |
| Sector: Consumer Staples | |
| SubSector: Beverages - Non-Alcoholic | |
| MarketCap: 38919.2 Millions | |
| Recent Price: 25.74 Smart Investing & Trading Score: 20 | |
| Day Percent Change: 0.546875% Day Change: -0.05 | |
| Week Change: -1.94286% Year-to-date Change: -17.2% | |
| KDP Links: Profile News Message Board | |
| Charts:- Daily , Weekly | |
| Add KDP to Watchlist: View: Get KDP Trend Analysis ➞ | |
 | HSY Hershey Company |
| Sector: Consumer Staples | |
| SubSector: Confectioners | |
| MarketCap: 37601.3 Millions | |
| Recent Price: 189.02 Smart Investing & Trading Score: 80 | |
| Day Percent Change: 0.10062% Day Change: 0.68 | |
| Week Change: -0.979622% Year-to-date Change: 13.9% | |
| HSY Links: Profile News Message Board | |
| Charts:- Daily , Weekly | |
| Add HSY to Watchlist: View: Get HSY Trend Analysis ➞ | |
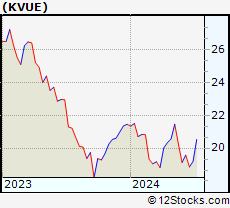 | KVUE Kenvue Inc |
| Sector: Consumer Staples | |
| SubSector: Household & Personal Products | |
| MarketCap: 35733.1 Millions | |
| Recent Price: 15.73 Smart Investing & Trading Score: 20 | |
| Day Percent Change: -0.32% Day Change: -0.05 | |
| Week Change: -3.78% Year-to-date Change: -24.4% | |
| KVUE Links: Profile News Message Board | |
| Charts:- Daily , Weekly | |
| Add KVUE to Watchlist: View: Get KVUE Trend Analysis ➞ | |
 | KHC Kraft Heinz Co |
| Sector: Consumer Staples | |
| SubSector: Packaged Foods | |
| MarketCap: 32300.4 Millions | |
| Recent Price: 26.07 Smart Investing & Trading Score: 50 | |
| Day Percent Change: -0.799087% Day Change: -0.27 | |
| Week Change: -2.50561% Year-to-date Change: -12.9% | |
| KHC Links: Profile News Message Board | |
| Charts:- Daily , Weekly | |
| Add KHC to Watchlist: View: Get KHC Trend Analysis ➞ | |
 | EL Estee Lauder Cos., Inc |
| Sector: Consumer Staples | |
| SubSector: Household & Personal Products | |
| MarketCap: 32102.1 Millions | |
| Recent Price: 88.77 Smart Investing & Trading Score: 60 | |
| Day Percent Change: 2.98144% Day Change: 2.58 | |
| Week Change: 4.03141% Year-to-date Change: 21.2% | |
| EL Links: Profile News Message Board | |
| Charts:- Daily , Weekly | |
| Add EL to Watchlist: View: Get EL Trend Analysis ➞ | |
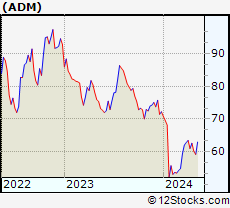 | ADM Archer Daniels Midland Co |
| Sector: Consumer Staples | |
| SubSector: Farm Products | |
| MarketCap: 30240.4 Millions | |
| Recent Price: 59.11 Smart Investing & Trading Score: 30 | |
| Day Percent Change: -0.236287% Day Change: 0.05 | |
| Week Change: -3.85491% Year-to-date Change: 20.2% | |
| ADM Links: Profile News Message Board | |
| Charts:- Daily , Weekly | |
| Add ADM to Watchlist: View: Get ADM Trend Analysis ➞ | |
 | K Kellanova |
| Sector: Consumer Staples | |
| SubSector: Packaged Foods | |
| MarketCap: 27768.3 Millions | |
| Recent Price: 82.65 Smart Investing & Trading Score: 90 | |
| Day Percent Change: 0.230415% Day Change: 0.23 | |
| Week Change: 7.39345% Year-to-date Change: 3.4% | |
| K Links: Profile News Message Board | |
| Charts:- Daily , Weekly | |
| Add K to Watchlist: View: Get K Trend Analysis ➞ | |
 | GIS General Mills, Inc |
| Sector: Consumer Staples | |
| SubSector: Packaged Foods | |
| MarketCap: 27044.4 Millions | |
| Recent Price: 50.32 Smart Investing & Trading Score: 90 | |
| Day Percent Change: -0.749507% Day Change: -0.41 | |
| Week Change: -1.54569% Year-to-date Change: -18.2% | |
| GIS Links: Profile News Message Board | |
| Charts:- Daily , Weekly | |
| Add GIS to Watchlist: View: Get GIS Trend Analysis ➞ | |
 | STZ Constellation Brands Inc |
| Sector: Consumer Staples | |
| SubSector: Beverages - Brewers | |
| MarketCap: 26166.8 Millions | |
| Recent Price: 140.51 Smart Investing & Trading Score: 80 | |
| Day Percent Change: 1.12271% Day Change: 1.05 | |
| Week Change: 5.33773% Year-to-date Change: -35.8% | |
| STZ Links: Profile News Message Board | |
| Charts:- Daily , Weekly | |
| Add STZ to Watchlist: View: Get STZ Trend Analysis ➞ | |
 | DG Dollar General Corp |
| Sector: Consumer Staples | |
| SubSector: Discount Stores | |
| MarketCap: 24053.2 Millions | |
| Recent Price: 101.40 Smart Investing & Trading Score: 10 | |
| Day Percent Change: 1.72552% Day Change: 1.8 | |
| Week Change: -2.96651% Year-to-date Change: 36.7% | |
| DG Links: Profile News Message Board | |
| Charts:- Daily , Weekly | |
| Add DG to Watchlist: View: Get DG Trend Analysis ➞ | |
 | CHD Church & Dwight Co., Inc |
| Sector: Consumer Staples | |
| SubSector: Household & Personal Products | |
| MarketCap: 23337.7 Millions | |
| Recent Price: 88.40 Smart Investing & Trading Score: 40 | |
| Day Percent Change: 0.545951% Day Change: 0.5 | |
| Week Change: 1.77297% Year-to-date Change: -14.4% | |
| CHD Links: Profile News Message Board | |
| Charts:- Daily , Weekly | |
| Add CHD to Watchlist: View: Get CHD Trend Analysis ➞ | |
| For tabular summary view of above stock list: Summary View ➞ 0 - 25 , 25 - 50 | ||
| Click To Change The Sort Order: By Market Cap or Company Size Performance: Year-to-date, Week and Day | |
| Select Chart Type: | ||
|
Best Stocks Today 12Stocks.com |
© 2025 12Stocks.com Terms & Conditions Privacy Contact Us
All Information Provided Only For Education And Not To Be Used For Investing or Trading. See Terms & Conditions


One More Thing ... Get Best Stocks Delivered Daily!
Never Ever Miss A Move With Our Top Ten Stocks Lists
Find Best Stocks In Any Market - Bull or Bear Market
Take A Peek At Our Top Ten Stocks Lists: Daily, Weekly, Year-to-Date & Top Trends
Find Best Stocks In Any Market - Bull or Bear Market
Take A Peek At Our Top Ten Stocks Lists: Daily, Weekly, Year-to-Date & Top Trends
S&P 500 Stocks With Best Up Trends [0-bearish to 100-bullish]: Fair Isaac[100], Intel Corp[100], Bio-Techne Corp[100], DuPont de[100], First Solar[100], Centene Corp[100], Lam Research[100], Charles River[100], Applied Materials[100], Steel Dynamics[100], Teradyne Inc[100]
Best S&P 500 Stocks Year-to-Date:
Seagate [198.865%], Western Digital[181.204%], Newmont Corp[127.671%], Micron [110.87%], Lam Research[103.976%], Intel Corp[84.4708%], Warner Bros.[84.2%], NRG [82.3658%], CVS Health[81.156%], Amphenol Corp[79.8571%], KLA Corp[79.7904%] Best S&P 500 Stocks This Week:
Pioneer Natural[108.1%], Bio-Techne Corp[21.2222%], Electronic Arts[20.1076%], Western Digital[19.6645%], Intel Corp[19.4747%], Charles River[17.3369%], Fair Isaac[15.6495%], Lamb Weston[15.5663%], Lam Research[14.5184%], Seagate [13.8757%], Micron [13.6232%] Best S&P 500 Stocks Daily:
Fair Isaac[17.979%], Celanese Corp[6.98937%], Humana Inc[3.99157%], CF Industries[3.94539%], Eastman Chemical[3.88961%], Intel Corp[3.78408%], Albemarle Corp[3.7173%], Caesars Entertainment[3.66089%], Bio-Techne Corp[3.6215%], DuPont de[3.54129%], Advanced Micro[3.48759%]