
 Login Sign Up


| |||||
 |  | ||||

| 12Stocks.com Market Intelligence |
Best MidCap Stocks
|
| In a hurry? Mid Cap Stocks Lists: Performance Trends Table, Stock Charts
Sort midcap stocks: Daily, Weekly, Year-to-Date, Market Cap & Trends. Filter midcap stocks list by sector: Show all, Tech, Finance, Energy, Staples, Retail, Industrial, Materials, Utilities and HealthCare Filter midcap stocks list by size:All MidCap Large Mid-Range Small |
| 12Stocks.com Mid Cap Stocks Performances & Trends Daily | |||||||||
|
|  The overall Smart Investing & Trading Score is 70 (0-bearish to 100-bullish) which puts Mid Cap index in short term neutral to bullish trend. The Smart Investing & Trading Score from previous trading session is 56 and hence an improvement of trend.
| ||||||||
Here are the Smart Investing & Trading Scores of the most requested mid cap stocks at 12Stocks.com (click stock name for detailed review):
|


| 12Stocks.com: Top Performing Mid Cap Index Stocks | ||||||||||||||||||||||||||||||||||||||||||||||||
 The top performing Mid Cap Index stocks year to date are
Now, more recently, over last week, the top performing Mid Cap Index stocks on the move are


|
||||||||||||||||||||||||||||||||||||||||||||||||
| 12Stocks.com: Investing in Midcap Index with Stocks | |
|
The following table helps investors and traders sort through current performance and trends (as measured by Smart Investing & Trading Score) of various
stocks in the Midcap Index. Quick View: Move mouse or cursor over stock symbol (ticker) to view short-term technical chart and over stock name to view long term chart. Click on  to add stock symbol to your watchlist and to add stock symbol to your watchlist and  to view watchlist. Click on any ticker or stock name for detailed market intelligence report for that stock. to view watchlist. Click on any ticker or stock name for detailed market intelligence report for that stock. |
12Stocks.com Performance of Stocks in Midcap Index
| Ticker | Stock Name | Watchlist | Category | Recent Price | Smart Investing & Trading Score | Change % | YTD Change% |
| NSA | National Storage |   | Financials | 35.53 | 35 | 1.75% | -14.32% |
| CWEN | Clearway Energy | | Utilities | 23.46 | 67 | 1.38% | -14.47% |
| DOCS | Doximity | | Health Care | 24.27 | 35 | 1.89% | -14.63% |
| KSS | Kohl s | | Services & Goods | 24.45 | 37 | -0.33% | -14.75% |
| BERY | Berry Global | | Consumer Staples | 57.45 | 64 | 0.70% | -14.75% |
| BMRN | BioMarin Pharmaceutical | | Health Care | 82.13 | 7 | 1.51% | -14.82% |
| DT | Dynatrace | | Technology | 46.51 | 40 | -1.25% | -14.96% |
| VRSN | VeriSign | | Technology | 175.11 | 0 | -0.21% | -14.98% |
| ETSY | Etsy | | Services & Goods | 68.88 | 93 | 2.15% | -15.02% |
| BC | Brunswick | | Consumer Staples | 82.11 | 43 | 1.27% | -15.13% |
| ON | ON Semiconductor | | Technology | 70.82 | 77 | 4.06% | -15.22% |
| EPR | EPR Properties | | Financials | 41.04 | 45 | 0.12% | -15.29% |
| OLED | Universal Display | | Technology | 162.02 | 64 | 2.34% | -15.29% |
| MSCI | MSCI | | Technology | 476.98 | 32 | -0.17% | -15.68% |
| FAF | First American | | Financials | 54.18 | 7 | -0.07% | -15.92% |
| PLTK | Playtika Holding | | Services & Goods | 7.23 | 74 | 1.12% | -16.17% |
| INCY | yte | | Health Care | 52.56 | 49 | 1.70% | -16.29% |
| ULTA | Ulta Beauty | | Services & Goods | 410.04 | 28 | 0.90% | -16.32% |
| DLTR | Dollar Tree | | Services & Goods | 118.81 | 0 | -2.41% | -16.36% |
| TECH | Bio-Techne | | Health Care | 64.51 | 49 | 0.70% | -16.39% |
| TFX | Teleflex | | Health Care | 208.48 | 27 | 0.86% | -16.39% |
| SNDR | Schneider National | | Transports | 21.22 | 42 | -0.61% | -16.62% |
| BIIB | Biogen | | Health Care | 215.50 | 74 | 3.16% | -16.72% |
| GXO | GXO Logistics | | Industrials | 50.96 | 57 | 0.89% | -16.77% |
| DV | DoubleVerify | | Technology | 30.60 | 28 | 1.22% | -16.80% |
| For chart view version of above stock list: Chart View ➞ 0 - 25 , 25 - 50 , 50 - 75 , 75 - 100 , 100 - 125 , 125 - 150 , 150 - 175 , 175 - 200 , 200 - 225 , 225 - 250 , 250 - 275 , 275 - 300 , 300 - 325 , 325 - 350 , 350 - 375 , 375 - 400 , 400 - 425 , 425 - 450 , 450 - 475 , 475 - 500 , 500 - 525 , 525 - 550 , 550 - 575 , 575 - 600 , 600 - 625 , 625 - 650 , 650 - 675 , 675 - 700 , 700 - 725 , 725 - 750 , 750 - 775 | ||
 | Click To Change The Sort Order: By Market Cap or Company Size Performance: Year-to-date, Week and Day |  |
|
Get the most comprehensive stock market coverage daily at 12Stocks.com ➞ Best Stocks Today ➞ Best Stocks Weekly ➞ Best Stocks Year-to-Date ➞ Best Stocks Trends ➞  Best Stocks Today 12Stocks.com Best Nasdaq Stocks ➞ Best S&P 500 Stocks ➞ Best Tech Stocks ➞ Best Biotech Stocks ➞ |
| Detailed Overview of Midcap Stocks |
| Midcap Technical Overview, Leaders & Laggards, Top Midcap ETF Funds & Detailed Midcap Stocks List, Charts, Trends & More |
| Midcap: Technical Analysis, Trends & YTD Performance | |
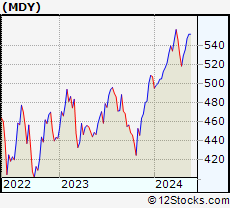
| MidCap segment as represented by
MDY, an exchange-traded fund [ETF], holds basket of about four hundred midcap stocks from across all major sectors of the US stock market. The midcap index (contains stocks like Green Mountain Coffee Roasters and Tractor Supply Company) is up by 4.91% and is currently underperforming the overall market by -1.65% year-to-date. Below is a quick view of technical charts and trends: | |
 MDY Weekly Chart |
|
| Long Term Trend: Very Good | |
| Medium Term Trend: Good | |
 MDY Daily Chart |
|
| Short Term Trend: Very Good | |
| Overall Trend Score: 70 | |
| YTD Performance: 4.91% | |
| **Trend Scores & Views Are Only For Educational Purposes And Not For Investing | |
| 12Stocks.com: Investing in Midcap Index using Exchange Traded Funds | |
|
The following table shows list of key exchange traded funds (ETF) that
help investors track Midcap index. The following list also includes leveraged ETF funds that track twice or thrice the daily returns of Midcap indices. Short or inverse ETF funds move in the opposite direction to the index they track and are useful during market pullbacks or during bear markets. Quick View: Move mouse or cursor over ETF symbol (ticker) to view short-term technical chart and over ETF name to view long term chart. Click on ticker or stock name for detailed view. Click on to add stock symbol to your watchlist and to view watchlist. |
12Stocks.com List of ETFs that track Midcap Index
| Ticker | ETF Name | Watchlist | Recent Price | Smart Investing & Trading Score | Change % | Week % | Year-to-date % |
| IJH | iShares Core S&P Mid-Cap | | 58.17 | 75 | 0.61 | 0.61 | 4.94% |
| IWR | iShares Russell Mid-Cap | | 80.98 | 75 | 0.57 | 0.57 | 4.18% |
| IWP | iShares Russell Mid-Cap Growth | | 109.47 | 78 | 0.45 | 0.45 | 4.8% |
| MDY | SPDR S&P MidCap 400 ETF | | 532.28 | 70 | 0.55 | 0.55 | 4.91% |
| IWS | iShares Russell Mid-Cap Value | | 120.76 | 75 | 0.64 | 0.64 | 3.84% |
| IJK | iShares S&P Mid-Cap 400 Growth | | 87.51 | 70 | 0.59 | 0.59 | 10.46% |
| IJJ | iShares S&P Mid-Cap 400 Value | | 112.85 | 88 | 0.55 | 0.55 | -1.04% |
| XMLV | PowerShares S&P MidCap Low Volatil ETF | | 54.94 | 83 | 0.53 | 0.53 | 3.31% |
| UMDD | ProShares UltraPro MidCap400 | | 24.32 | 71 | 1.50 | 1.5 | 8.96% |
| SMDD | ProShares UltraPro Short MidCap400 | | 11.62 | 10 | -1.78 | -1.78 | -13.69% |
| MYY | ProShares Short MidCap400 | | 20.69 | 18 | -0.48 | -0.48 | -3.56% |
| MZZ | ProShares UltraShort MidCap400 | | 11.59 | 20 | -0.77 | -0.77 | -7.8% |
| MVV | ProShares Ultra MidCap400 | | 61.81 | 75 | 0.61 | 0.61 | 6.76% |
| 12Stocks.com: Charts, Trends, Fundamental Data and Performances of MidCap Stocks | |
|
We now take in-depth look at all MidCap stocks including charts, multi-period performances and overall trends (as measured by Smart Investing & Trading Score). One can sort MidCap stocks (click link to choose) by Daily, Weekly and by Year-to-Date performances. Also, one can sort by size of the company or by market capitalization. |
| Select Your Default Chart Type: | |||||
| |||||
| Click on stock symbol or name for detailed view. Click on to add stock symbol to your watchlist and to view watchlist. Quick View: Move mouse or cursor over "Daily" to quickly view daily technical stock chart and over "Weekly" to view weekly technical stock chart. | |||||

 | NSA National Storage Affiliates Trust |
| Sector: Financials | |
| SubSector: REIT - Industrial | |
| MarketCap: 1623.99 Millions | |
| Recent Price: 35.53 Smart Investing & Trading Score: 35 | |
| Day Percent Change: 1.75% Day Change: 0.61 | |
| Week Change: 1.75% Year-to-date Change: -14.3% | |
| NSA Links: Profile News Message Board | |
| Charts:- Daily , Weekly | |
| Add NSA to Watchlist: View: Get Complete NSA Trend Analysis ➞ | |
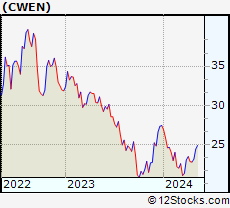 | CWEN Clearway Energy, Inc. |
| Sector: Utilities | |
| SubSector: Electric Utilities | |
| MarketCap: 1545.74 Millions | |
| Recent Price: 23.46 Smart Investing & Trading Score: 67 | |
| Day Percent Change: 1.38% Day Change: 0.32 | |
| Week Change: 1.38% Year-to-date Change: -14.5% | |
| CWEN Links: Profile News Message Board | |
| Charts:- Daily , Weekly | |
| Add CWEN to Watchlist: View: Get Complete CWEN Trend Analysis ➞ | |
 | DOCS Doximity, Inc. |
| Sector: Health Care | |
| SubSector: Health Information Services | |
| MarketCap: 6540 Millions | |
| Recent Price: 24.27 Smart Investing & Trading Score: 35 | |
| Day Percent Change: 1.89% Day Change: 0.45 | |
| Week Change: 1.89% Year-to-date Change: -14.6% | |
| DOCS Links: Profile News Message Board | |
| Charts:- Daily , Weekly | |
| Add DOCS to Watchlist: View: Get Complete DOCS Trend Analysis ➞ | |
 | KSS Kohl s Corporation |
| Sector: Services & Goods | |
| SubSector: Department Stores | |
| MarketCap: 3068 Millions | |
| Recent Price: 24.45 Smart Investing & Trading Score: 37 | |
| Day Percent Change: -0.33% Day Change: -0.08 | |
| Week Change: -0.33% Year-to-date Change: -14.8% | |
| KSS Links: Profile News Message Board | |
| Charts:- Daily , Weekly | |
| Add KSS to Watchlist: View: Get Complete KSS Trend Analysis ➞ | |
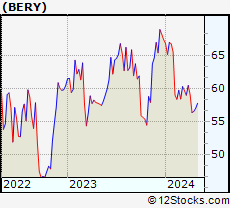 | BERY Berry Global Group, Inc. |
| Sector: Consumer Staples | |
| SubSector: Packaging & Containers | |
| MarketCap: 4349.33 Millions | |
| Recent Price: 57.45 Smart Investing & Trading Score: 64 | |
| Day Percent Change: 0.70% Day Change: 0.40 | |
| Week Change: 0.7% Year-to-date Change: -14.8% | |
| BERY Links: Profile News Message Board | |
| Charts:- Daily , Weekly | |
| Add BERY to Watchlist: View: Get Complete BERY Trend Analysis ➞ | |
 | BMRN BioMarin Pharmaceutical Inc. |
| Sector: Health Care | |
| SubSector: Biotechnology | |
| MarketCap: 14887.5 Millions | |
| Recent Price: 82.13 Smart Investing & Trading Score: 7 | |
| Day Percent Change: 1.51% Day Change: 1.22 | |
| Week Change: 1.51% Year-to-date Change: -14.8% | |
| BMRN Links: Profile News Message Board | |
| Charts:- Daily , Weekly | |
| Add BMRN to Watchlist: View: Get Complete BMRN Trend Analysis ➞ | |
 | DT Dynatrace, Inc. |
| Sector: Technology | |
| SubSector: Application Software | |
| MarketCap: 7007.12 Millions | |
| Recent Price: 46.51 Smart Investing & Trading Score: 40 | |
| Day Percent Change: -1.25% Day Change: -0.59 | |
| Week Change: -1.25% Year-to-date Change: -15.0% | |
| DT Links: Profile News Message Board | |
| Charts:- Daily , Weekly | |
| Add DT to Watchlist: View: Get Complete DT Trend Analysis ➞ | |
 | VRSN VeriSign, Inc. |
| Sector: Technology | |
| SubSector: Internet Information Providers | |
| MarketCap: 19657 Millions | |
| Recent Price: 175.11 Smart Investing & Trading Score: 0 | |
| Day Percent Change: -0.21% Day Change: -0.37 | |
| Week Change: -0.21% Year-to-date Change: -15.0% | |
| VRSN Links: Profile News Message Board | |
| Charts:- Daily , Weekly | |
| Add VRSN to Watchlist: View: Get Complete VRSN Trend Analysis ➞ | |
 | ETSY Etsy, Inc. |
| Sector: Services & Goods | |
| SubSector: Specialty Retail, Other | |
| MarketCap: 4263.24 Millions | |
| Recent Price: 68.88 Smart Investing & Trading Score: 93 | |
| Day Percent Change: 2.15% Day Change: 1.45 | |
| Week Change: 2.15% Year-to-date Change: -15.0% | |
| ETSY Links: Profile News Message Board | |
| Charts:- Daily , Weekly | |
| Add ETSY to Watchlist: View: Get Complete ETSY Trend Analysis ➞ | |
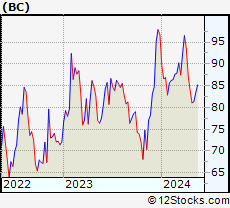 | BC Brunswick Corporation |
| Sector: Consumer Staples | |
| SubSector: Recreational Goods, Other | |
| MarketCap: 2481.59 Millions | |
| Recent Price: 82.11 Smart Investing & Trading Score: 43 | |
| Day Percent Change: 1.27% Day Change: 1.03 | |
| Week Change: 1.27% Year-to-date Change: -15.1% | |
| BC Links: Profile News Message Board | |
| Charts:- Daily , Weekly | |
| Add BC to Watchlist: View: Get Complete BC Trend Analysis ➞ | |
 | ON ON Semiconductor Corporation |
| Sector: Technology | |
| SubSector: Semiconductor - Broad Line | |
| MarketCap: 5183.82 Millions | |
| Recent Price: 70.82 Smart Investing & Trading Score: 77 | |
| Day Percent Change: 4.06% Day Change: 2.76 | |
| Week Change: 4.06% Year-to-date Change: -15.2% | |
| ON Links: Profile News Message Board | |
| Charts:- Daily , Weekly | |
| Add ON to Watchlist: View: Get Complete ON Trend Analysis ➞ | |
 | EPR EPR Properties |
| Sector: Financials | |
| SubSector: REIT - Retail | |
| MarketCap: 2217.64 Millions | |
| Recent Price: 41.04 Smart Investing & Trading Score: 45 | |
| Day Percent Change: 0.12% Day Change: 0.05 | |
| Week Change: 0.12% Year-to-date Change: -15.3% | |
| EPR Links: Profile News Message Board | |
| Charts:- Daily , Weekly | |
| Add EPR to Watchlist: View: Get Complete EPR Trend Analysis ➞ | |
 | OLED Universal Display Corporation |
| Sector: Technology | |
| SubSector: Semiconductor Equipment & Materials | |
| MarketCap: 5660.08 Millions | |
| Recent Price: 162.02 Smart Investing & Trading Score: 64 | |
| Day Percent Change: 2.34% Day Change: 3.71 | |
| Week Change: 2.34% Year-to-date Change: -15.3% | |
| OLED Links: Profile News Message Board | |
| Charts:- Daily , Weekly | |
| Add OLED to Watchlist: View: Get Complete OLED Trend Analysis ➞ | |
 | MSCI MSCI Inc. |
| Sector: Technology | |
| SubSector: Processing Systems & Products | |
| MarketCap: 21086.3 Millions | |
| Recent Price: 476.98 Smart Investing & Trading Score: 32 | |
| Day Percent Change: -0.17% Day Change: -0.80 | |
| Week Change: -0.17% Year-to-date Change: -15.7% | |
| MSCI Links: Profile News Message Board | |
| Charts:- Daily , Weekly | |
| Add MSCI to Watchlist: View: Get Complete MSCI Trend Analysis ➞ | |
 | FAF First American Financial Corporation |
| Sector: Financials | |
| SubSector: Property & Casualty Insurance | |
| MarketCap: 4163.82 Millions | |
| Recent Price: 54.18 Smart Investing & Trading Score: 7 | |
| Day Percent Change: -0.07% Day Change: -0.04 | |
| Week Change: -0.07% Year-to-date Change: -15.9% | |
| FAF Links: Profile News Message Board | |
| Charts:- Daily , Weekly | |
| Add FAF to Watchlist: View: Get Complete FAF Trend Analysis ➞ | |
 | PLTK Playtika Holding Corp. |
| Sector: Services & Goods | |
| SubSector: Electronic Gaming & Multimedia | |
| MarketCap: 4260 Millions | |
| Recent Price: 7.23 Smart Investing & Trading Score: 74 | |
| Day Percent Change: 1.12% Day Change: 0.08 | |
| Week Change: 1.12% Year-to-date Change: -16.2% | |
| PLTK Links: Profile News Message Board | |
| Charts:- Daily , Weekly | |
| Add PLTK to Watchlist: View: Get Complete PLTK Trend Analysis ➞ | |
 | INCY Incyte Corporation |
| Sector: Health Care | |
| SubSector: Biotechnology | |
| MarketCap: 15343.2 Millions | |
| Recent Price: 52.56 Smart Investing & Trading Score: 49 | |
| Day Percent Change: 1.70% Day Change: 0.88 | |
| Week Change: 1.7% Year-to-date Change: -16.3% | |
| INCY Links: Profile News Message Board | |
| Charts:- Daily , Weekly | |
| Add INCY to Watchlist: View: Get Complete INCY Trend Analysis ➞ | |
 | ULTA Ulta Beauty, Inc. |
| Sector: Services & Goods | |
| SubSector: Specialty Retail, Other | |
| MarketCap: 9429.94 Millions | |
| Recent Price: 410.04 Smart Investing & Trading Score: 28 | |
| Day Percent Change: 0.90% Day Change: 3.65 | |
| Week Change: 0.9% Year-to-date Change: -16.3% | |
| ULTA Links: Profile News Message Board | |
| Charts:- Daily , Weekly | |
| Add ULTA to Watchlist: View: Get Complete ULTA Trend Analysis ➞ | |
 | DLTR Dollar Tree, Inc. |
| Sector: Services & Goods | |
| SubSector: Discount, Variety Stores | |
| MarketCap: 21383.2 Millions | |
| Recent Price: 118.81 Smart Investing & Trading Score: 0 | |
| Day Percent Change: -2.41% Day Change: -2.93 | |
| Week Change: -2.41% Year-to-date Change: -16.4% | |
| DLTR Links: Profile News Message Board | |
| Charts:- Daily , Weekly | |
| Add DLTR to Watchlist: View: Get Complete DLTR Trend Analysis ➞ | |
 | TECH Bio-Techne Corporation |
| Sector: Health Care | |
| SubSector: Biotechnology | |
| MarketCap: 6958.05 Millions | |
| Recent Price: 64.51 Smart Investing & Trading Score: 49 | |
| Day Percent Change: 0.70% Day Change: 0.45 | |
| Week Change: 0.7% Year-to-date Change: -16.4% | |
| TECH Links: Profile News Message Board | |
| Charts:- Daily , Weekly | |
| Add TECH to Watchlist: View: Get Complete TECH Trend Analysis ➞ | |
 | TFX Teleflex Incorporated |
| Sector: Health Care | |
| SubSector: Medical Instruments & Supplies | |
| MarketCap: 12989.3 Millions | |
| Recent Price: 208.48 Smart Investing & Trading Score: 27 | |
| Day Percent Change: 0.86% Day Change: 1.77 | |
| Week Change: 0.86% Year-to-date Change: -16.4% | |
| TFX Links: Profile News Message Board | |
| Charts:- Daily , Weekly | |
| Add TFX to Watchlist: View: Get Complete TFX Trend Analysis ➞ | |
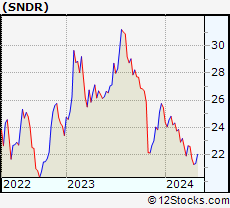 | SNDR Schneider National, Inc. |
| Sector: Transports | |
| SubSector: Trucking | |
| MarketCap: 3299.95 Millions | |
| Recent Price: 21.22 Smart Investing & Trading Score: 42 | |
| Day Percent Change: -0.61% Day Change: -0.13 | |
| Week Change: -0.61% Year-to-date Change: -16.6% | |
| SNDR Links: Profile News Message Board | |
| Charts:- Daily , Weekly | |
| Add SNDR to Watchlist: View: Get Complete SNDR Trend Analysis ➞ | |
 | BIIB Biogen Inc. |
| Sector: Health Care | |
| SubSector: Biotechnology | |
| MarketCap: 53102.6 Millions | |
| Recent Price: 215.50 Smart Investing & Trading Score: 74 | |
| Day Percent Change: 3.16% Day Change: 6.60 | |
| Week Change: 3.16% Year-to-date Change: -16.7% | |
| BIIB Links: Profile News Message Board | |
| Charts:- Daily , Weekly | |
| Add BIIB to Watchlist: View: Get Complete BIIB Trend Analysis ➞ | |
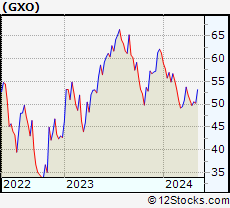 | GXO GXO Logistics, Inc. |
| Sector: Industrials | |
| SubSector: Integrated Freight & Logistics | |
| MarketCap: 7340 Millions | |
| Recent Price: 50.96 Smart Investing & Trading Score: 57 | |
| Day Percent Change: 0.89% Day Change: 0.45 | |
| Week Change: 0.89% Year-to-date Change: -16.8% | |
| GXO Links: Profile News Message Board | |
| Charts:- Daily , Weekly | |
| Add GXO to Watchlist: View: Get Complete GXO Trend Analysis ➞ | |
 | DV DoubleVerify Holdings, Inc. |
| Sector: Technology | |
| SubSector: Software - Application | |
| MarketCap: 6500 Millions | |
| Recent Price: 30.60 Smart Investing & Trading Score: 28 | |
| Day Percent Change: 1.22% Day Change: 0.37 | |
| Week Change: 1.22% Year-to-date Change: -16.8% | |
| DV Links: Profile News Message Board | |
| Charts:- Daily , Weekly | |
| Add DV to Watchlist: View: Get Complete DV Trend Analysis ➞ | |
| For tabular summary view of above stock list: Summary View ➞ 0 - 25 , 25 - 50 , 50 - 75 , 75 - 100 , 100 - 125 , 125 - 150 , 150 - 175 , 175 - 200 , 200 - 225 , 225 - 250 , 250 - 275 , 275 - 300 , 300 - 325 , 325 - 350 , 350 - 375 , 375 - 400 , 400 - 425 , 425 - 450 , 450 - 475 , 475 - 500 , 500 - 525 , 525 - 550 , 550 - 575 , 575 - 600 , 600 - 625 , 625 - 650 , 650 - 675 , 675 - 700 , 700 - 725 , 725 - 750 , 750 - 775 | ||
| Click To Change The Sort Order: By Market Cap or Company Size Performance: Year-to-date, Week and Day | |
| Select Chart Type: | ||
|
Best Stocks Today 12Stocks.com |
© 2024 12Stocks.com Terms & Conditions Privacy Contact Us
All Information Provided Only For Education And Not To Be Used For Investing or Trading. See Terms & Conditions


One More Thing ... Get Best Stocks Delivered Daily!
Never Ever Miss A Move With Our Top Ten Stocks Lists
Find Best Stocks In Any Market - Bull or Bear Market
Take A Peek At Our Top Ten Stocks Lists: Daily, Weekly, Year-to-Date & Top Trends
Find Best Stocks In Any Market - Bull or Bear Market
Take A Peek At Our Top Ten Stocks Lists: Daily, Weekly, Year-to-Date & Top Trends
Midcap Stocks With Best Up Trends [0-bearish to 100-bullish]: Albemarle [100], Medical Properties[100], Domino s[100], Tandem Diabetes[100], Lattice Semiconductor[100], Quest Diagnostics[100], AES [100], Carrier Global[100], Teradyne [100], DaVita [100], Skyworks Solutions[100]
Best Midcap Stocks Year-to-Date:
Vistra Energy[102.39%], AppLovin [83.42%], ShockWave Medical[72.92%], EMCOR [68.8%], CAVA [62.35%], Constellation Energy[61.05%], Spotify [53.34%], Antero Resources[51.23%], Natera [50.13%], Wingstop [49.98%], Pure Storage[47.03%] Best Midcap Stocks This Week:
Ginkgo Bioworks[15.08%], Hertz Global[7.92%], Albemarle [7.57%], Vistra Energy[7.24%], Medical Properties[5.99%], Domino s[5.62%], Liberty SiriusXM[5.49%], Liberty SiriusXM[5.27%], Tandem Diabetes[5.19%], Sirius XM[4.97%], Peloton Interactive[4.43%] Best Midcap Stocks Daily:
Ginkgo Bioworks[15.08%], Hertz Global[7.92%], Albemarle [7.57%], Vistra Energy[7.24%], Medical Properties[5.99%], Domino s[5.62%], Liberty SiriusXM[5.49%], Liberty SiriusXM[5.27%], Tandem Diabetes[5.19%], Sirius XM[4.97%], Peloton Interactive[4.43%]