
 Login Sign Up


| |||||
 |  | ||||

| 12Stocks.com Market Intelligence |
Best MidCap Stocks
|
| In a hurry? Mid Cap Stocks Lists: Performance Trends Table, Stock Charts
Sort midcap stocks: Daily, Weekly, Year-to-Date, Market Cap & Trends. Filter midcap stocks list by sector: Show all, Tech, Finance, Energy, Staples, Retail, Industrial, Materials, Utilities and HealthCare Filter midcap stocks list by size:All MidCap Large Mid-Range Small |
| 12Stocks.com Mid Cap Stocks Performances & Trends Daily | |||||||||
|
|  The overall Smart Investing & Trading Score is 70 (0-bearish to 100-bullish) which puts Mid Cap index in short term neutral to bullish trend. The Smart Investing & Trading Score from previous trading session is 56 and hence an improvement of trend.
| ||||||||
Here are the Smart Investing & Trading Scores of the most requested mid cap stocks at 12Stocks.com (click stock name for detailed review):
|


| 12Stocks.com: Top Performing Mid Cap Index Stocks | ||||||||||||||||||||||||||||||||||||||||||||||||
 The top performing Mid Cap Index stocks year to date are
Now, more recently, over last week, the top performing Mid Cap Index stocks on the move are


|
||||||||||||||||||||||||||||||||||||||||||||||||
| 12Stocks.com: Investing in Midcap Index with Stocks | |
|
The following table helps investors and traders sort through current performance and trends (as measured by Smart Investing & Trading Score) of various
stocks in the Midcap Index. Quick View: Move mouse or cursor over stock symbol (ticker) to view short-term technical chart and over stock name to view long term chart. Click on  to add stock symbol to your watchlist and to add stock symbol to your watchlist and  to view watchlist. Click on any ticker or stock name for detailed market intelligence report for that stock. to view watchlist. Click on any ticker or stock name for detailed market intelligence report for that stock. |
12Stocks.com Performance of Stocks in Midcap Index
| Ticker | Stock Name | Watchlist | Category | Recent Price | Smart Investing & Trading Score | Change % | YTD Change% |
| PINS |   | Industrials | 33.78 | 64 | -0.53% | -8.80% | |
| APA | Apache | | Energy | 32.72 | 75 | 0.71% | -8.81% |
| VICI | VICI Properties | | Financials | 29.05 | 74 | 2.04% | -8.88% |
| ELAN | Elanco Animal | | Health Care | 13.57 | 49 | 2.34% | -8.93% |
| IDXX | IDEXX | | Health Care | 505.34 | 64 | 1.21% | -8.96% |
| PNFP | Pinnacle Financial | | Financials | 79.36 | 25 | -1.16% | -9.01% |
| MDB | MongoDB | | Technology | 371.94 | 52 | -3.09% | -9.03% |
| WCC | WESCO | | Services & Goods | 158.15 | 27 | 1.51% | -9.05% |
| ANSS | ANSYS | | Technology | 329.87 | 38 | -1.16% | -9.10% |
| SJM | J. M. | | Consumer Staples | 114.65 | 35 | 0.92% | -9.28% |
| JAZZ | Jazz | | Health Care | 111.22 | 57 | 1.61% | -9.58% |
| UHAL | AMERCO | | Transports | 64.90 | 57 | -0.03% | -9.61% |
| KMX | CarMax | | Services & Goods | 69.35 | 17 | -0.34% | -9.63% |
| RYN | Rayonier | | Industrials | 30.15 | 38 | -0.03% | -9.76% |
| ROK | Rockwell Automation | | Industrials | 279.97 | 78 | -0.05% | -9.83% |
| EXPE | Expedia | | Services & Goods | 136.66 | 50 | 0.71% | -9.97% |
| SUI | Sun Communities | | Financials | 120.31 | 59 | 1.03% | -9.98% |
| LH | Laboratory | | Health Care | 204.17 | 27 | 2.91% | -10.17% |
| WY | Weyerhaeuser | | Industrials | 31.18 | 10 | 0.42% | -10.32% |
| TTWO | Take-Two Interactive | | Technology | 144.27 | 49 | -0.14% | -10.36% |
| VTR | Ventas | | Financials | 44.67 | 74 | 1.52% | -10.37% |
| VMI | Valmont Industries | | Industrials | 209.24 | 27 | -0.36% | -10.39% |
| ILMN | Illumina | | Health Care | 124.73 | 59 | 2.00% | -10.42% |
| BXP | Boston Properties | | Financials | 62.84 | 67 | 2.16% | -10.45% |
| G | Genpact | | Technology | 31.07 | 47 | 0.55% | -10.49% |
| For chart view version of above stock list: Chart View ➞ 0 - 25 , 25 - 50 , 50 - 75 , 75 - 100 , 100 - 125 , 125 - 150 , 150 - 175 , 175 - 200 , 200 - 225 , 225 - 250 , 250 - 275 , 275 - 300 , 300 - 325 , 325 - 350 , 350 - 375 , 375 - 400 , 400 - 425 , 425 - 450 , 450 - 475 , 475 - 500 , 500 - 525 , 525 - 550 , 550 - 575 , 575 - 600 , 600 - 625 , 625 - 650 , 650 - 675 , 675 - 700 , 700 - 725 , 725 - 750 , 750 - 775 | ||
 | Click To Change The Sort Order: By Market Cap or Company Size Performance: Year-to-date, Week and Day |  |
|
Get the most comprehensive stock market coverage daily at 12Stocks.com ➞ Best Stocks Today ➞ Best Stocks Weekly ➞ Best Stocks Year-to-Date ➞ Best Stocks Trends ➞  Best Stocks Today 12Stocks.com Best Nasdaq Stocks ➞ Best S&P 500 Stocks ➞ Best Tech Stocks ➞ Best Biotech Stocks ➞ |
| Detailed Overview of Midcap Stocks |
| Midcap Technical Overview, Leaders & Laggards, Top Midcap ETF Funds & Detailed Midcap Stocks List, Charts, Trends & More |
| Midcap: Technical Analysis, Trends & YTD Performance | |
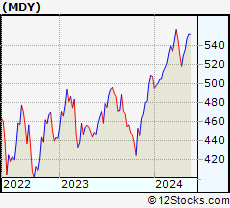
| MidCap segment as represented by
MDY, an exchange-traded fund [ETF], holds basket of about four hundred midcap stocks from across all major sectors of the US stock market. The midcap index (contains stocks like Green Mountain Coffee Roasters and Tractor Supply Company) is up by 4.91% and is currently underperforming the overall market by -1.65% year-to-date. Below is a quick view of technical charts and trends: | |
 MDY Weekly Chart |
|
| Long Term Trend: Very Good | |
| Medium Term Trend: Good | |
 MDY Daily Chart |
|
| Short Term Trend: Very Good | |
| Overall Trend Score: 70 | |
| YTD Performance: 4.91% | |
| **Trend Scores & Views Are Only For Educational Purposes And Not For Investing | |
| 12Stocks.com: Investing in Midcap Index using Exchange Traded Funds | |
|
The following table shows list of key exchange traded funds (ETF) that
help investors track Midcap index. The following list also includes leveraged ETF funds that track twice or thrice the daily returns of Midcap indices. Short or inverse ETF funds move in the opposite direction to the index they track and are useful during market pullbacks or during bear markets. Quick View: Move mouse or cursor over ETF symbol (ticker) to view short-term technical chart and over ETF name to view long term chart. Click on ticker or stock name for detailed view. Click on to add stock symbol to your watchlist and to view watchlist. |
12Stocks.com List of ETFs that track Midcap Index
| Ticker | ETF Name | Watchlist | Recent Price | Smart Investing & Trading Score | Change % | Week % | Year-to-date % |
| IJH | iShares Core S&P Mid-Cap | | 58.17 | 75 | 0.61 | 0.61 | 4.94% |
| IWR | iShares Russell Mid-Cap | | 80.98 | 75 | 0.57 | 0.57 | 4.18% |
| IWP | iShares Russell Mid-Cap Growth | | 109.47 | 78 | 0.45 | 0.45 | 4.8% |
| MDY | SPDR S&P MidCap 400 ETF | | 532.28 | 70 | 0.55 | 0.55 | 4.91% |
| IWS | iShares Russell Mid-Cap Value | | 120.76 | 75 | 0.64 | 0.64 | 3.84% |
| IJK | iShares S&P Mid-Cap 400 Growth | | 87.51 | 70 | 0.59 | 0.59 | 10.46% |
| IJJ | iShares S&P Mid-Cap 400 Value | | 112.85 | 88 | 0.55 | 0.55 | -1.04% |
| XMLV | PowerShares S&P MidCap Low Volatil ETF | | 54.94 | 83 | 0.53 | 0.53 | 3.31% |
| UMDD | ProShares UltraPro MidCap400 | | 24.32 | 71 | 1.50 | 1.5 | 8.96% |
| SMDD | ProShares UltraPro Short MidCap400 | | 11.62 | 10 | -1.78 | -1.78 | -13.69% |
| MYY | ProShares Short MidCap400 | | 20.69 | 18 | -0.48 | -0.48 | -3.56% |
| MZZ | ProShares UltraShort MidCap400 | | 11.59 | 20 | -0.77 | -0.77 | -7.8% |
| MVV | ProShares Ultra MidCap400 | | 61.81 | 83 | 0.61 | 0.61 | 6.76% |
| 12Stocks.com: Charts, Trends, Fundamental Data and Performances of MidCap Stocks | |
|
We now take in-depth look at all MidCap stocks including charts, multi-period performances and overall trends (as measured by Smart Investing & Trading Score). One can sort MidCap stocks (click link to choose) by Daily, Weekly and by Year-to-Date performances. Also, one can sort by size of the company or by market capitalization. |
| Select Your Default Chart Type: | |||||
| |||||
| Click on stock symbol or name for detailed view. Click on to add stock symbol to your watchlist and to view watchlist. Quick View: Move mouse or cursor over "Daily" to quickly view daily technical stock chart and over "Weekly" to view weekly technical stock chart. | |||||

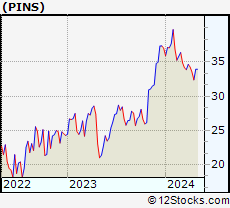 | PINS Pinterest, Inc. |
| Sector: Industrials | |
| SubSector: Conglomerates | |
| MarketCap: 8115.78 Millions | |
| Recent Price: 33.78 Smart Investing & Trading Score: 64 | |
| Day Percent Change: -0.53% Day Change: -0.18 | |
| Week Change: -0.53% Year-to-date Change: -8.8% | |
| PINS Links: Profile News Message Board | |
| Charts:- Daily , Weekly | |
| Add PINS to Watchlist: View: Get Complete PINS Trend Analysis ➞ | |
 | APA Apache Corporation |
| Sector: Energy | |
| SubSector: Independent Oil & Gas | |
| MarketCap: 1937.53 Millions | |
| Recent Price: 32.72 Smart Investing & Trading Score: 75 | |
| Day Percent Change: 0.71% Day Change: 0.23 | |
| Week Change: 0.71% Year-to-date Change: -8.8% | |
| APA Links: Profile News Message Board | |
| Charts:- Daily , Weekly | |
| Add APA to Watchlist: View: Get Complete APA Trend Analysis ➞ | |
 | VICI VICI Properties Inc. |
| Sector: Financials | |
| SubSector: REIT - Diversified | |
| MarketCap: 7327.03 Millions | |
| Recent Price: 29.05 Smart Investing & Trading Score: 74 | |
| Day Percent Change: 2.04% Day Change: 0.58 | |
| Week Change: 2.04% Year-to-date Change: -8.9% | |
| VICI Links: Profile News Message Board | |
| Charts:- Daily , Weekly | |
| Add VICI to Watchlist: View: Get Complete VICI Trend Analysis ➞ | |
 | ELAN Elanco Animal Health Incorporated |
| Sector: Health Care | |
| SubSector: Drugs - Generic | |
| MarketCap: 7752.15 Millions | |
| Recent Price: 13.57 Smart Investing & Trading Score: 49 | |
| Day Percent Change: 2.34% Day Change: 0.31 | |
| Week Change: 2.34% Year-to-date Change: -8.9% | |
| ELAN Links: Profile News Message Board | |
| Charts:- Daily , Weekly | |
| Add ELAN to Watchlist: View: Get Complete ELAN Trend Analysis ➞ | |
 | IDXX IDEXX Laboratories, Inc. |
| Sector: Health Care | |
| SubSector: Diagnostic Substances | |
| MarketCap: 15937.1 Millions | |
| Recent Price: 505.34 Smart Investing & Trading Score: 64 | |
| Day Percent Change: 1.21% Day Change: 6.04 | |
| Week Change: 1.21% Year-to-date Change: -9.0% | |
| IDXX Links: Profile News Message Board | |
| Charts:- Daily , Weekly | |
| Add IDXX to Watchlist: View: Get Complete IDXX Trend Analysis ➞ | |
 | PNFP Pinnacle Financial Partners, Inc. |
| Sector: Financials | |
| SubSector: Regional - Southeast Banks | |
| MarketCap: 2771.75 Millions | |
| Recent Price: 79.36 Smart Investing & Trading Score: 25 | |
| Day Percent Change: -1.16% Day Change: -0.93 | |
| Week Change: -1.16% Year-to-date Change: -9.0% | |
| PNFP Links: Profile News Message Board | |
| Charts:- Daily , Weekly | |
| Add PNFP to Watchlist: View: Get Complete PNFP Trend Analysis ➞ | |
 | MDB MongoDB, Inc. |
| Sector: Technology | |
| SubSector: Application Software | |
| MarketCap: 7591.22 Millions | |
| Recent Price: 371.94 Smart Investing & Trading Score: 52 | |
| Day Percent Change: -3.09% Day Change: -11.86 | |
| Week Change: -3.09% Year-to-date Change: -9.0% | |
| MDB Links: Profile News Message Board | |
| Charts:- Daily , Weekly | |
| Add MDB to Watchlist: View: Get Complete MDB Trend Analysis ➞ | |
 | WCC WESCO International, Inc. |
| Sector: Services & Goods | |
| SubSector: Industrial Equipment Wholesale | |
| MarketCap: 824.358 Millions | |
| Recent Price: 158.15 Smart Investing & Trading Score: 27 | |
| Day Percent Change: 1.51% Day Change: 2.35 | |
| Week Change: 1.51% Year-to-date Change: -9.1% | |
| WCC Links: Profile News Message Board | |
| Charts:- Daily , Weekly | |
| Add WCC to Watchlist: View: Get Complete WCC Trend Analysis ➞ | |
 | ANSS ANSYS, Inc. |
| Sector: Technology | |
| SubSector: Application Software | |
| MarketCap: 19497.4 Millions | |
| Recent Price: 329.87 Smart Investing & Trading Score: 38 | |
| Day Percent Change: -1.16% Day Change: -3.88 | |
| Week Change: -1.16% Year-to-date Change: -9.1% | |
| ANSS Links: Profile News Message Board | |
| Charts:- Daily , Weekly | |
| Add ANSS to Watchlist: View: Get Complete ANSS Trend Analysis ➞ | |
 | SJM The J. M. Smucker Company |
| Sector: Consumer Staples | |
| SubSector: Processed & Packaged Goods | |
| MarketCap: 12635.8 Millions | |
| Recent Price: 114.65 Smart Investing & Trading Score: 35 | |
| Day Percent Change: 0.92% Day Change: 1.05 | |
| Week Change: 0.92% Year-to-date Change: -9.3% | |
| SJM Links: Profile News Message Board | |
| Charts:- Daily , Weekly | |
| Add SJM to Watchlist: View: Get Complete SJM Trend Analysis ➞ | |
 | JAZZ Jazz Pharmaceuticals plc |
| Sector: Health Care | |
| SubSector: Biotechnology | |
| MarketCap: 5576.05 Millions | |
| Recent Price: 111.22 Smart Investing & Trading Score: 57 | |
| Day Percent Change: 1.61% Day Change: 1.76 | |
| Week Change: 1.61% Year-to-date Change: -9.6% | |
| JAZZ Links: Profile News Message Board | |
| Charts:- Daily , Weekly | |
| Add JAZZ to Watchlist: View: Get Complete JAZZ Trend Analysis ➞ | |
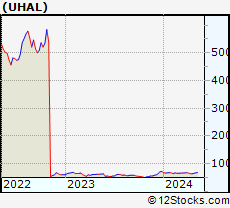 | UHAL AMERCO |
| Sector: Transports | |
| SubSector: Rental & Leasing Services | |
| MarketCap: 5271.94 Millions | |
| Recent Price: 64.90 Smart Investing & Trading Score: 57 | |
| Day Percent Change: -0.03% Day Change: -0.02 | |
| Week Change: -0.03% Year-to-date Change: -9.6% | |
| UHAL Links: Profile News Message Board | |
| Charts:- Daily , Weekly | |
| Add UHAL to Watchlist: View: Get Complete UHAL Trend Analysis ➞ | |
 | KMX CarMax, Inc. |
| Sector: Services & Goods | |
| SubSector: Auto Dealerships | |
| MarketCap: 8121.71 Millions | |
| Recent Price: 69.35 Smart Investing & Trading Score: 17 | |
| Day Percent Change: -0.34% Day Change: -0.24 | |
| Week Change: -0.34% Year-to-date Change: -9.6% | |
| KMX Links: Profile News Message Board | |
| Charts:- Daily , Weekly | |
| Add KMX to Watchlist: View: Get Complete KMX Trend Analysis ➞ | |
 | RYN Rayonier Inc. |
| Sector: Industrials | |
| SubSector: Lumber, Wood Production | |
| MarketCap: 3143 Millions | |
| Recent Price: 30.15 Smart Investing & Trading Score: 38 | |
| Day Percent Change: -0.03% Day Change: -0.01 | |
| Week Change: -0.03% Year-to-date Change: -9.8% | |
| RYN Links: Profile News Message Board | |
| Charts:- Daily , Weekly | |
| Add RYN to Watchlist: View: Get Complete RYN Trend Analysis ➞ | |
 | ROK Rockwell Automation, Inc. |
| Sector: Industrials | |
| SubSector: Diversified Machinery | |
| MarketCap: 15666.1 Millions | |
| Recent Price: 279.97 Smart Investing & Trading Score: 78 | |
| Day Percent Change: -0.05% Day Change: -0.15 | |
| Week Change: -0.05% Year-to-date Change: -9.8% | |
| ROK Links: Profile News Message Board | |
| Charts:- Daily , Weekly | |
| Add ROK to Watchlist: View: Get Complete ROK Trend Analysis ➞ | |
 | EXPE Expedia Group, Inc. |
| Sector: Services & Goods | |
| SubSector: Lodging | |
| MarketCap: 8052.96 Millions | |
| Recent Price: 136.66 Smart Investing & Trading Score: 50 | |
| Day Percent Change: 0.71% Day Change: 0.96 | |
| Week Change: 0.71% Year-to-date Change: -10.0% | |
| EXPE Links: Profile News Message Board | |
| Charts:- Daily , Weekly | |
| Add EXPE to Watchlist: View: Get Complete EXPE Trend Analysis ➞ | |
 | SUI Sun Communities, Inc. |
| Sector: Financials | |
| SubSector: REIT - Residential | |
| MarketCap: 11280.5 Millions | |
| Recent Price: 120.31 Smart Investing & Trading Score: 59 | |
| Day Percent Change: 1.03% Day Change: 1.23 | |
| Week Change: 1.03% Year-to-date Change: -10.0% | |
| SUI Links: Profile News Message Board | |
| Charts:- Daily , Weekly | |
| Add SUI to Watchlist: View: Get Complete SUI Trend Analysis ➞ | |
 | LH Laboratory Corporation of America Holdings |
| Sector: Health Care | |
| SubSector: Medical Laboratories & Research | |
| MarketCap: 12119.2 Millions | |
| Recent Price: 204.17 Smart Investing & Trading Score: 27 | |
| Day Percent Change: 2.91% Day Change: 5.77 | |
| Week Change: 2.91% Year-to-date Change: -10.2% | |
| LH Links: Profile News Message Board | |
| Charts:- Daily , Weekly | |
| Add LH to Watchlist: View: Get Complete LH Trend Analysis ➞ | |
 | WY Weyerhaeuser Company |
| Sector: Industrials | |
| SubSector: Lumber, Wood Production | |
| MarketCap: 13244.8 Millions | |
| Recent Price: 31.18 Smart Investing & Trading Score: 10 | |
| Day Percent Change: 0.42% Day Change: 0.13 | |
| Week Change: 0.42% Year-to-date Change: -10.3% | |
| WY Links: Profile News Message Board | |
| Charts:- Daily , Weekly | |
| Add WY to Watchlist: View: Get Complete WY Trend Analysis ➞ | |
 | TTWO Take-Two Interactive Software, Inc. |
| Sector: Technology | |
| SubSector: Multimedia & Graphics Software | |
| MarketCap: 12479.6 Millions | |
| Recent Price: 144.27 Smart Investing & Trading Score: 49 | |
| Day Percent Change: -0.14% Day Change: -0.20 | |
| Week Change: -0.14% Year-to-date Change: -10.4% | |
| TTWO Links: Profile News Message Board | |
| Charts:- Daily , Weekly | |
| Add TTWO to Watchlist: View: Get Complete TTWO Trend Analysis ➞ | |
 | VTR Ventas, Inc. |
| Sector: Financials | |
| SubSector: REIT - Healthcare Facilities | |
| MarketCap: 11180.4 Millions | |
| Recent Price: 44.67 Smart Investing & Trading Score: 74 | |
| Day Percent Change: 1.52% Day Change: 0.67 | |
| Week Change: 1.52% Year-to-date Change: -10.4% | |
| VTR Links: Profile News Message Board | |
| Charts:- Daily , Weekly | |
| Add VTR to Watchlist: View: Get Complete VTR Trend Analysis ➞ | |
 | VMI Valmont Industries, Inc. |
| Sector: Industrials | |
| SubSector: Metal Fabrication | |
| MarketCap: 2251.6 Millions | |
| Recent Price: 209.24 Smart Investing & Trading Score: 27 | |
| Day Percent Change: -0.36% Day Change: -0.75 | |
| Week Change: -0.36% Year-to-date Change: -10.4% | |
| VMI Links: Profile News Message Board | |
| Charts:- Daily , Weekly | |
| Add VMI to Watchlist: View: Get Complete VMI Trend Analysis ➞ | |
 | ILMN Illumina, Inc. |
| Sector: Health Care | |
| SubSector: Biotechnology | |
| MarketCap: 39194.3 Millions | |
| Recent Price: 124.73 Smart Investing & Trading Score: 59 | |
| Day Percent Change: 2.00% Day Change: 2.45 | |
| Week Change: 2% Year-to-date Change: -10.4% | |
| ILMN Links: Profile News Message Board | |
| Charts:- Daily , Weekly | |
| Add ILMN to Watchlist: View: Get Complete ILMN Trend Analysis ➞ | |
 | BXP Boston Properties, Inc. |
| Sector: Financials | |
| SubSector: REIT - Office | |
| MarketCap: 13788.6 Millions | |
| Recent Price: 62.84 Smart Investing & Trading Score: 67 | |
| Day Percent Change: 2.16% Day Change: 1.33 | |
| Week Change: 2.16% Year-to-date Change: -10.5% | |
| BXP Links: Profile News Message Board | |
| Charts:- Daily , Weekly | |
| Add BXP to Watchlist: View: Get Complete BXP Trend Analysis ➞ | |
 | G Genpact Limited |
| Sector: Technology | |
| SubSector: Information Technology Services | |
| MarketCap: 5485.78 Millions | |
| Recent Price: 31.07 Smart Investing & Trading Score: 47 | |
| Day Percent Change: 0.55% Day Change: 0.17 | |
| Week Change: 0.55% Year-to-date Change: -10.5% | |
| G Links: Profile News Message Board | |
| Charts:- Daily , Weekly | |
| Add G to Watchlist: View: Get Complete G Trend Analysis ➞ | |
| For tabular summary view of above stock list: Summary View ➞ 0 - 25 , 25 - 50 , 50 - 75 , 75 - 100 , 100 - 125 , 125 - 150 , 150 - 175 , 175 - 200 , 200 - 225 , 225 - 250 , 250 - 275 , 275 - 300 , 300 - 325 , 325 - 350 , 350 - 375 , 375 - 400 , 400 - 425 , 425 - 450 , 450 - 475 , 475 - 500 , 500 - 525 , 525 - 550 , 550 - 575 , 575 - 600 , 600 - 625 , 625 - 650 , 650 - 675 , 675 - 700 , 700 - 725 , 725 - 750 , 750 - 775 | ||
| Click To Change The Sort Order: By Market Cap or Company Size Performance: Year-to-date, Week and Day | |
| Select Chart Type: | ||
|
Best Stocks Today 12Stocks.com |
© 2024 12Stocks.com Terms & Conditions Privacy Contact Us
All Information Provided Only For Education And Not To Be Used For Investing or Trading. See Terms & Conditions


One More Thing ... Get Best Stocks Delivered Daily!
Never Ever Miss A Move With Our Top Ten Stocks Lists
Find Best Stocks In Any Market - Bull or Bear Market
Take A Peek At Our Top Ten Stocks Lists: Daily, Weekly, Year-to-Date & Top Trends
Find Best Stocks In Any Market - Bull or Bear Market
Take A Peek At Our Top Ten Stocks Lists: Daily, Weekly, Year-to-Date & Top Trends
Midcap Stocks With Best Up Trends [0-bearish to 100-bullish]: Albemarle [100], Domino s[100], Tandem Diabetes[100], Quest Diagnostics[100], AES [100], Carrier Global[100], Teradyne [100], DaVita [100], Skyworks Solutions[100], LPL Financial[100], Perrigo [100]
Best Midcap Stocks Year-to-Date:
Vistra Energy[102.39%], AppLovin [83.42%], ShockWave Medical[72.92%], EMCOR [68.8%], CAVA [62.35%], Constellation Energy[61.05%], Spotify [53.34%], Antero Resources[51.23%], Natera [50.13%], Wingstop [49.98%], Pure Storage[47.03%] Best Midcap Stocks This Week:
Ginkgo Bioworks[15.08%], Hertz Global[7.92%], Albemarle [7.57%], Vistra Energy[7.24%], Medical Properties[5.99%], Domino s[5.62%], Liberty SiriusXM[5.49%], Liberty SiriusXM[5.27%], Tandem Diabetes[5.19%], Sirius XM[4.97%], Peloton Interactive[4.43%] Best Midcap Stocks Daily:
Ginkgo Bioworks[15.08%], Hertz Global[7.92%], Albemarle [7.57%], Vistra Energy[7.24%], Medical Properties[5.99%], Domino s[5.62%], Liberty SiriusXM[5.49%], Liberty SiriusXM[5.27%], Tandem Diabetes[5.19%], Sirius XM[4.97%], Peloton Interactive[4.43%]